Functional annotation of human long noncoding RNAs via molecular phenotyping
←
→
Page content transcription
If your browser does not render page correctly, please read the page content below
Downloaded from genome.cshlp.org on April 29, 2021 - Published by Cold Spring Harbor Laboratory Press

Resource

Functional annotation of human long noncoding
RNAs via molecular phenotyping
Jordan A. Ramilowski,1,2,46 Chi Wai Yip,1,2,46 Saumya Agrawal,1,2 Jen-Chien Chang,1,2
Yari Ciani,3 Ivan V. Kulakovskiy,4,5 Mickaël Mendez,6 Jasmine Li Ching Ooi,2
John F. Ouyang,7 Nick Parkinson,8 Andreas Petri,9 Leonie Roos,10,11 Jessica Severin,1,2
Kayoko Yasuzawa,1,2 Imad Abugessaisa,1,2 Altuna Akalin,12 Ivan V. Antonov,13
Erik Arner,1,2 Alessandro Bonetti,2 Hidemasa Bono,14 Beatrice Borsari,15
Frank Brombacher,16,17 Chris J.F. Cameron,18 Carlo Vittorio Cannistraci,19,20
Ryan Cardenas,21 Melissa Cardon,1 Howard Chang,22 Josée Dostie,23 Luca Ducoli,24
Alexander Favorov,25,26 Alexandre Fort,2 Diego Garrido,15 Noa Gil,27
Juliette Gimenez,28 Reto Guler,16,17 Lusy Handoko,2 Jayson Harshbarger,2
Akira Hasegawa,1,2 Yuki Hasegawa,2 Kosuke Hashimoto,1,2 Norihito Hayatsu,1
Peter Heutink,29 Tetsuro Hirose,30 Eddie L. Imada,26 Masayoshi Itoh,2,31
Bogumil Kaczkowski,1,2 Aditi Kanhere,21 Emily Kawabata,2 Hideya Kawaji,31
Tsugumi Kawashima,1,2 S. Thomas Kelly,1 Miki Kojima,1,2 Naoto Kondo,2
Haruhiko Koseki,1 Tsukasa Kouno,1,2 Anton Kratz,2 Mariola Kurowska-Stolarska,32
Andrew Tae Jun Kwon,1,2 Jeffrey Leek,26 Andreas Lennartsson,33 Marina Lizio,1,2
Fernando López-Redondo,1,2 Joachim Luginbühl,1,2 Shiori Maeda,1
Vsevolod J. Makeev,25,34 Luigi Marchionni,26 Yulia A. Medvedeva,13,34 Aki Minoda,1,2
Ferenc Müller,21 Manuel Muñoz-Aguirre,15 Mitsuyoshi Murata,1,2 Hiromi Nishiyori,1,2
Kazuhiro R. Nitta,1,2 Shuhei Noguchi,1,2 Yukihiko Noro,2 Ramil Nurtdinov,15
Yasushi Okazaki,1,2 Valerio Orlando,35 Denis Paquette,23 Callum J.C. Parr,1
Owen J.L. Rackham,7 Patrizia Rizzu,29 Diego Fernando Sánchez Martinez,26
Albin Sandelin,36 Pillay Sanjana,21 Colin A.M. Semple,37 Youtaro Shibayama,1,2
Divya M. Sivaraman,1,2 Takahiro Suzuki,1,2 Suzannah C. Szumowski,2
Michihira Tagami,1,2 Martin S. Taylor,37 Chikashi Terao,1 Malte Thodberg,36
Supat Thongjuea,2 Vidisha Tripathi,38 Igor Ulitsky,27 Roberto Verardo,3
Ilya E. Vorontsov,25 Chinatsu Yamamoto,2 Robert S. Young,39 J. Kenneth Baillie,8
Alistair R.R. Forrest,1,2,40 Roderic Guigó,15,41 Michael M. Hoffman,42
Chung Chau Hon,1,2 Takeya Kasukawa,1,2 Sakari Kauppinen,9 Juha Kere,33,43
Boris Lenhard,10,11,44 Claudio Schneider,3,45 Harukazu Suzuki,1,2 Ken Yagi,1,2
Michiel J.L. de Hoon,1,2 Jay W. Shin,1,2 and Piero Carninci1,2

46
   These authors contributed equally to this work.
Corresponding authors: michiel.dehoon@riken.jp, jay.shin@riken.jp,
carninci@riken.jp
Article published online before print. Article, supplemental material, and publi-   © 2020 Ramilowski et al. This article, published in Genome Research, is avail-
cation date are at http://www.genome.org/cgi/doi/10.1101/gr.254219.119.             able under a Creative Commons License (Attribution 4.0 International), as de-
Freely available online through the Genome Research Open Access option.             scribed at http://creativecommons.org/licenses/by/4.0/.

30:1–13 Published by Cold Spring Harbor Laboratory Press; ISSN 1088-9051/20; www.genome.org                                      Genome Research               1
                                                                                                                                    www.genome.org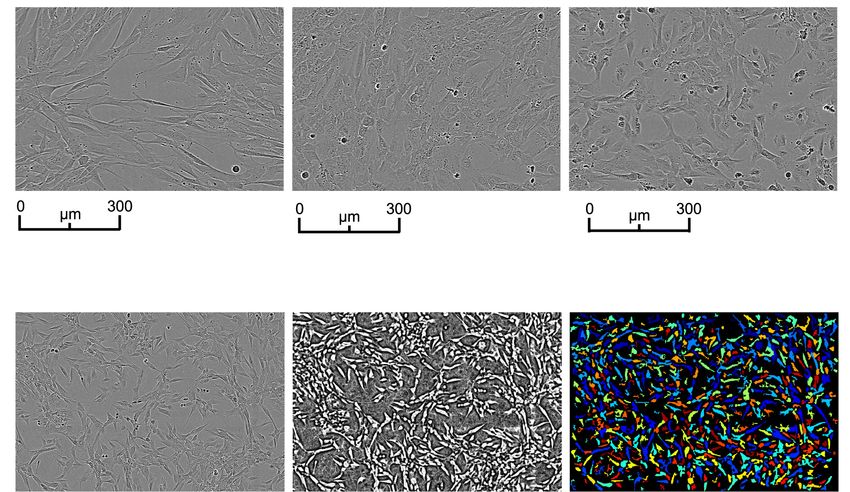
Downloaded from genome.cshlp.org on April 29, 2021 - Published by Cold Spring Harbor Laboratory Press

Ramilowski et al.

1
 RIKEN Center for Integrative Medical Sciences, Yokohama, Kanagawa 230-0045, Japan; 2RIKEN Center for Life Science
Technologies, Yokohama, Kanagawa 230-0045, Japan; 3Laboratorio Nazionale Consorzio Interuniversitario Biotecnologie (CIB),
Trieste 34127, Italy; 4Engelhardt Institute of Molecular Biology, Russian Academy of Sciences, Moscow 119991, Russia; 5Institute of
Protein Research, Russian Academy of Sciences, Pushchino 142290, Russia; 6Department of Computer Science, University of Toronto,
Toronto, Ontario M5S 1A1, Canada; 7Program in Cardiovascular and Metabolic Disorders, Duke-National University of Singapore
Medical School, Singapore 169857, Singapore; 8Roslin Institute, University of Edinburgh, Edinburgh EH25 9RG, United Kingdom;
9
 Center for RNA Medicine, Department of Clinical Medicine, Aalborg University, Copenhagen 9220, Denmark; 10Institute of Clinical
Sciences, Faculty of Medicine, Imperial College London, London W12 0NN, United Kingdom; 11Computational Regulatory Genomics,
MRC London Institute of Medical Sciences, London W12 0NN, United Kingdom; 12Berlin Institute for Medical Systems Biology, Max
Delbrük Center for Molecular Medicine in the Helmholtz Association, Berlin 13125, Germany; 13Institute of Bioengineering, Research
Center of Biotechnology, Russian Academy of Sciences, Moscow 117312, Russia; 14Graduate School of Integrated Sciences for Life,
Hiroshima University, Higashi-Hiroshima City 739-0046, Japan; 15Centre for Genomic Regulation (CRG), The Barcelona Institute of
Science and Technology, Barcelona, Catalonia 08003, Spain; 16International Centre for Genetic Engineering and Biotechnology
(ICGEB), University of Cape Town, Cape Town 7925, South Africa; 17Institute of Infectious Diseases and Molecular Medicine (IDM),
Department of Pathology, Division of Immunology and South African Medical Research Council (SAMRC) Immunology of Infectious
Diseases, Faculty of Health Sciences, University of Cape Town, Cape Town 7925, South Africa; 18School of Computer Science, McGill
University, Montréal, Québec H3G 1Y6, Canada; 19Biomedical Cybernetics Group, Biotechnology Center (BIOTEC), Center for
Molecular and Cellular Bioengineering (CMCB), Center for Systems Biology Dresden (CSBD), Cluster of Excellence Physics of Life (PoL),
Department of Physics, Technische Universität Dresden, Dresden 01062, Germany; 20Center for Complex Network Intelligence
(CCNI) at the Tsinghua Laboratory of Brain and Intelligence (THBI), Department of Bioengineering, Tsinghua University, Beijing
100084, China; 21Institute of Cancer and Genomic Sciences, College of Medical and Dental Sciences, University of Birmingham,
Birmingham B15 2TT, United Kingdom; 22Center for Personal Dynamic Regulome, Stanford University, Stanford, California 94305,
USA; 23Department of Biochemistry, Rosalind and Morris Goodman Cancer Research Center, McGill University, Montréal, Québec
H3G 1Y6, Canada; 24Institute of Pharmaceutical Sciences, Swiss Federal Institute of Technology, Zurich 8093, Switzerland;
25
   Department of Computational Systems Biology, Vavilov Institute of General Genetics, Russian Academy of Sciences, Moscow
119991, Russia; 26Department of Oncology, Johns Hopkins University, Baltimore, Maryland 21287, USA; 27Department of Biological
Regulation, Weizmann Institute of Science, Rehovot 76100, Israel; 28Epigenetics and Genome Reprogramming Laboratory, IRCCS
Fondazione Santa Lucia, Rome00179, Italy; 29Genome Biology of Neurodegenerative Diseases, German Center for
Neurodegenerative Diseases (DZNE), Tübingen 72076, Germany; 30Graduate School of Frontier Biosciences, Osaka University, Suita
565-0871, Japan; 31RIKEN Preventive Medicine and Diagnosis Innovation Program (PMI), Saitama 351-0198, Japan; 32Institute of
Infection, Immunity, and Inflammation, University of Glasgow, Glasgow, Scotland G12 8QQ, United Kingdom; 33Department of
Biosciences and Nutrition, Karolinska Institutet, Huddinge 14157, Sweden; 34Moscow Institute of Physics and Technology,
Dolgoprudny 141701, Russia; 35Biological and Environmental Sciences and Engineering Division, King Abdullah University of Science
and Technology, Thuwal 23955-6900, Kingdom of Saudi Arabia; 36Department of Biology and BRIC, University of Copenhagen,
Denmark, Copenhagen N DK2200, Denmark; 37MRC Human Genetics Unit, University of Edinburgh, Edinburgh EH4 2XU, United
Kingdom; 38National Centre for Cell Science, Pune, Maharashtra 411007, India; 39Centre for Global Health Research, Usher Institute,
University of Edinburgh, Edinburgh EH8 9AG, United Kingdom; 40Harry Perkins Institute of Medical Research, QEII Medical Centre and
Centre for Medical Research, The University of Western Australia, Nedlands, Perth, Western Australia 6009, Australia; 41Universitat
Pompeu Fabra (UPF), Barcelona, Catalonia 08002, Spain; 42Princess Margaret Cancer Centre, Toronto, Ontario M5G 1L7, Canada;
43
   Stem Cells and Metabolism Research Program, University of Helsinki and Folkhälsan Research Center, 00290 Helsinki, Finland;
44
   Sars International Centre for Marine Molecular Biology, University of Bergen, Bergen N-5008, Norway; 45Department of Medicine
and Consorzio Interuniversitario Biotecnologie p.zle Kolbe 1 University of Udine, Udine 33100, Italy

      Long noncoding RNAs (lncRNAs) constitute the majority of transcripts in the mammalian genomes, and yet, their func-
      tions remain largely unknown. As part of the FANTOM6 project, we systematically knocked down the expression of
      285 lncRNAs in human dermal fibroblasts and quantified cellular growth, morphological changes, and transcriptomic re-
      sponses using Capped Analysis of Gene Expression (CAGE). Antisense oligonucleotides targeting the same lncRNAs exhib-
      ited global concordance, and the molecular phenotype, measured by CAGE, recapitulated the observed cellular
      phenotypes while providing additional insights on the affected genes and pathways. Here, we disseminate the largest-to-
      date lncRNA knockdown data set with molecular phenotyping (over 1000 CAGE deep-sequencing libraries) for further
      exploration and highlight functional roles for ZNF213-AS1 and lnc-KHDC3L-2.
      [Supplemental material is available for this article.]

2   Genome Research
       www.genome.org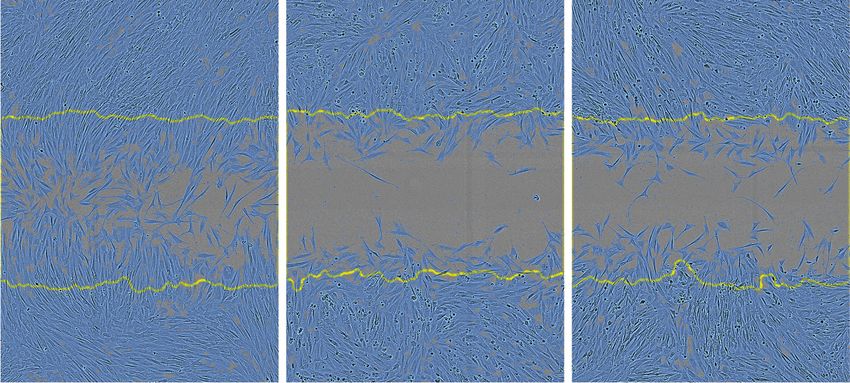
Downloaded from genome.cshlp.org on April 29, 2021 - Published by Cold Spring Harbor Laboratory Press

                                                                                                                  FANTOM6 pilot study

Over 50,000 loci in the human genome transcribe long noncoding            Table S1; Fig. 1A–C). Using RNA-seq profiling of fractionated
RNAa (lncRNAs) (Iyer et al. 2015; Hon et al. 2017), which are de-         RNA, we annotated the lncRNA subcellular localization as the
fined as transcripts at least 200 nucleotides (nt) long with low or       chromatin-bound (35%), nucleus-soluble (27%), or cytoplasmic
no protein-coding potential. Although lncRNA genes outnumber              (38%) (Fig. 1D). We then designed a minimum of five non-over-
protein-coding genes in mammalian genomes, they are compara-              lapping antisense oligonucleotides against each lncRNA (Supple-
tively less conserved (Ulitsky 2016), lowly expressed, and more           mental Methods; Supplemental Table S2; Fig. 1E,F) and
cell-type-specific (Hon et al. 2017). However, the evolutionary           transfected them individually using an automated cell culture
conservation of lncRNA promoters (Carninci et al. 2005) and the           platform to minimize experimental variability (Fig. 1G). The
structural motifs of lncRNAs (Chu et al. 2015; Xue et al. 2016)           overall knockdown efficiencies across 2021 ASOs resulted in me-
suggest that lncRNAs are fundamental biological regulators. To            dian value of 45.4%, and we could successfully knockdown 879
date, only a few hundred human lncRNAs have been extensively              out of 2021 (43.5%) ASOs (>40% knockdown efficiency in at least
characterized (de Hoon et al. 2015; Quek et al. 2015; Volders             two primer pairs or >60% in one primer pair) (Supplemental Ta-
et al. 2015; Ma et al. 2019), revealing their roles in regulating tran-   ble S2). ASOs targeting exons or introns were equally effective,
scription (Engreitz et al. 2016b), translation (Carrieri et al. 2012),    and knockdown efficiencies were independent of the genomic
and chromatin state (Gupta et al. 2010; Guttman et al. 2011;              class, expression level, and subcellular localization of the lncRNA
Guttman and Rinn 2012; Quinn and Chang 2016; Ransohoff                    (Supplemental Fig. S1A–D).
et al. 2018).
      Our recent FANTOM5 computational analysis showed that
19,175 (out of 27,919) human lncRNA loci are functionally impli-          A subset of lncRNAs are associated with cell growth
cated (Hon et al. 2017). Yet, genomic screens are necessary to com-       and morphology changes
prehensively characterize each lncRNA. One common approach of             To evaluate the effect of each lncRNA knockdown on cell growth
gene knockdown followed by a cellular phenotype assay typically           and morphology, we imaged ASO-transfected HDFs in duplicate
characterizes a small percentage of lncRNAs for a single observable       every 3 h for a total of 48 h (Supplemental Table S3) and estimat-
phenotype. For example, a recent large-scale screening using              ed their growth rate based on cell confluence measurements (Fig.
CRISPR interference (CRISPRi) found that ∼3.7% of targeted                2A,B). First, we observed across all ASOs that changes in cell
lncRNA loci are essential for cell growth or viability in a cell-type-    growth and morphological parameters were significantly correlat-
specific manner (Liu et al. 2017). In addition, CRISPR-Cas9 experi-       ed with knockdown efficiency (Supplemental Fig. S1E). Consider-
ments targeting splice sites identified ∼2.1% of lncRNAs that affect      ing both successful knockdown and significant growth inhibition
growth of K562 (Liu et al. 2018), and a CRISPR activation study re-       (Student’s two-sided t-test FDR ≤ 0.05), 246 out of 879 ASOs
vealed ∼0.11% lncRNAs to be important for drug resistance in mel-         (∼28%) showed cellular phenotype (Fig. 2C; Supplemental Table
anoma (Joung et al. 2017). However, many of these studies target          S3).
the genomic DNA, potentially perturbing the chromatin architec-                 To assess globally whether the observed growth inhibition is
ture, or focus on a single cellular assay, possibly missing other rele-   lncRNA-specific, we used all 194 lncRNAs successfully targeted by
vant functions and underlying molecular pathways.                         at least two ASOs (Supplemental Fig. S2A) and found that ASOs tar-
      As a part of the FANTOM6 pilot project, we established an au-       geting the same lncRNA were significantly more likely to have a
tomated high-throughput cell culture platform to suppress 285             concordant growth response than ASOs targeting different
lncRNAs expressed in human primary dermal fibroblasts (HDFs)              lncRNA (empirical P = 0.00037) (Supplemental Methods; Supple-
using antisense LNA-modified GapmeR antisense oligonucleotide             mental Fig. S2B). However, different ASOs targeting the same
(ASO) technology (Roux et al. 2017). We then quantified the effect        lncRNA typically showed different effects on growth, possibly
of each knockdown on cell growth and morphology using real-               due to variable knockdown efficiencies or differences in targeted
time imaging, followed by Cap Analysis Gene Expression (CAGE)             lncRNA isoforms, as well as off-target effects. To reliably identify
(Murata et al. 2014) deep sequencing to reveal molecular pathways         target-specific cellular phenotype, we applied conditional cutoffs
associated with each lncRNA. In contrast to cellular phenotyping,         based on the number of successful ASOs per each lncRNA (Supple-
molecular phenotyping provides a detailed assessment of the re-           mental Methods; Supplemental Fig. S2C) and identified 15/194
sponse to a lncRNA knockdown at the molecular level, allowing bi-         lncRNAs (7.7%) with growth phenotype (adjusted background
ological pathways to be associated to lncRNAs even in the absence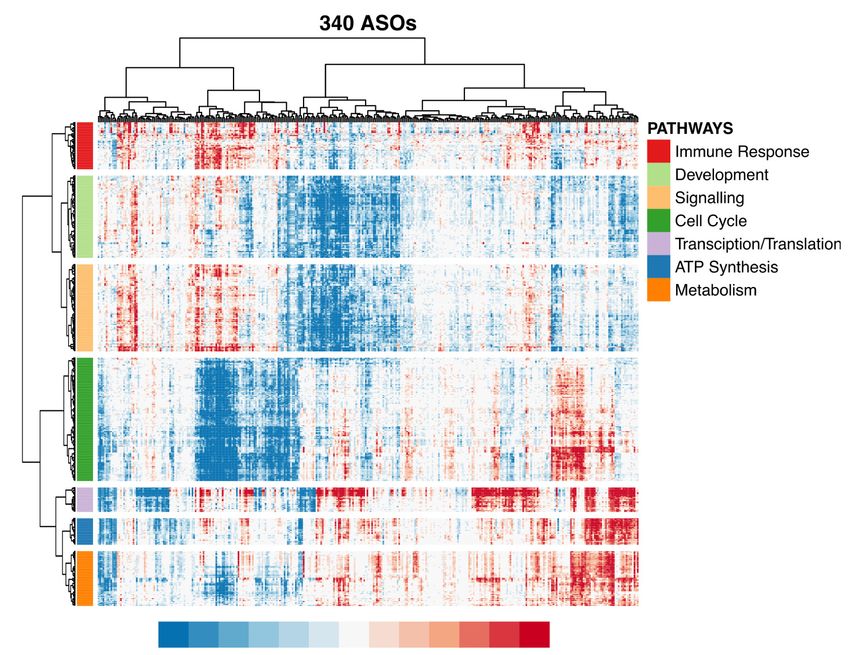
Downloaded from genome.cshlp.org on April 29, 2021 - Published by Cold Spring Harbor Laboratory Press

Ramilowski et al.

         A                                         B                                     C

         D                                                            E

         F                                                           G

Figure 1. Selection of lncRNA targets, their properties, and the study overview. (A) CAGE expression levels at log2TPM (tags per million) and human dermal
fibroblasts (HDFs) specificity of lncRNAs in the FANTOM CAT catalog (Hon et al. 2017) (N = 62,873; gray), lncRNAs expressed in HDFs (N = 6125; blue), and
targeted lncRNAs (N = 285; red). The dashed vertical line indicates most lowly expressed lncRNA target (∼0.2 TPM). (B) Gene conservation levels of lncRNAs
in the FANTOM CAT catalog (gray), lncRNAs expressed in HDFs (blue), and targeted lncRNAs (red). Crossbars indicate the median. No significant difference
is observed when comparing targeted and expressed in HDF lncRNAs (Wilcoxon P = 0.11). (C) Similar to that in B but for genomic classes of lncRNAs. Most of
the targeted lncRNAs and those expressed in HDFs are expressed from divergent promoters. (D) Subcellular localization (based on relative abundances from
RNA-seq fractionation data) for targeted lncRNAs. Chromatin-bound (N = 98; blue); nuclear soluble (N = 76; green); cytoplasmic (N = 108; red). Black con-
tours represent the distribution of all lncRNAs expressed in HDFs. (E) Example of ZNF213-AS1 loci showing transcript model, CAGE, and RNA-seq signal along
with targeting ASOs. (F ) Number of ASOs for target lncRNAs and controls used in the experiment. (G) Schematics of the study.

Molecular phenotyping by CAGE recapitulates cellular                           (Supplemental Fig. S3A), with ∼57% of ASOs showing at least 10 dif-
phenotypes and highlights functions of lncRNAs                                 ferentially expressed genes (FDR ≤ 0.05; abs[log2FC] > 0.5). For 84
                                                                               divergent-antisense lncRNAs (targeted by 186 independent ASOs)
Next, we selected 340 ASOs with high knockdown efficiencies                    (Supplemental Methods), we found their partner gene to be general-
(mostly >50%; median 71.4%) and sequenced 970 CAGE libraries                   ly unchanged (median abs[log2FC] = ∼0.13), with an exception of
to analyze 154 lncRNAs (Fig. 3A; Supplemental Table S4). To assess             two significantly down-regulated and three significantly up-regulat-
functional implications by individual ASOs, we performed differ-               ed genes (FDR ≤ 0.05) (Supplemental Fig. S3B). We have, however,
ential gene expression, Motif Activity Response Analysis (MARA)                noticed a common response in a large number of ASOs (∼30%–
(The FANTOM Consortium et al. 2009), and Gene Set Enrichment                   35% of all responding ASOs), such as down-regulation of cell-
Analysis (GSEA) (Fig. 3B–F; Subramanian et al. 2005), and com-                 cycle-related pathways, up-regulated stress genes and pathways, or
pared them with cellular phenotype.                                            altered cell metabolism and energetics (Supplemental Fig. S3C,D).
     We globally observed significant knockdown-mediated tran-                       When comparing knockdown-mediated molecular and cellu-
scriptomic changes (which generally correlated with KD efficiency)             lar response, we found that transcription factor motifs that

4    Genome Research
        www.genome.org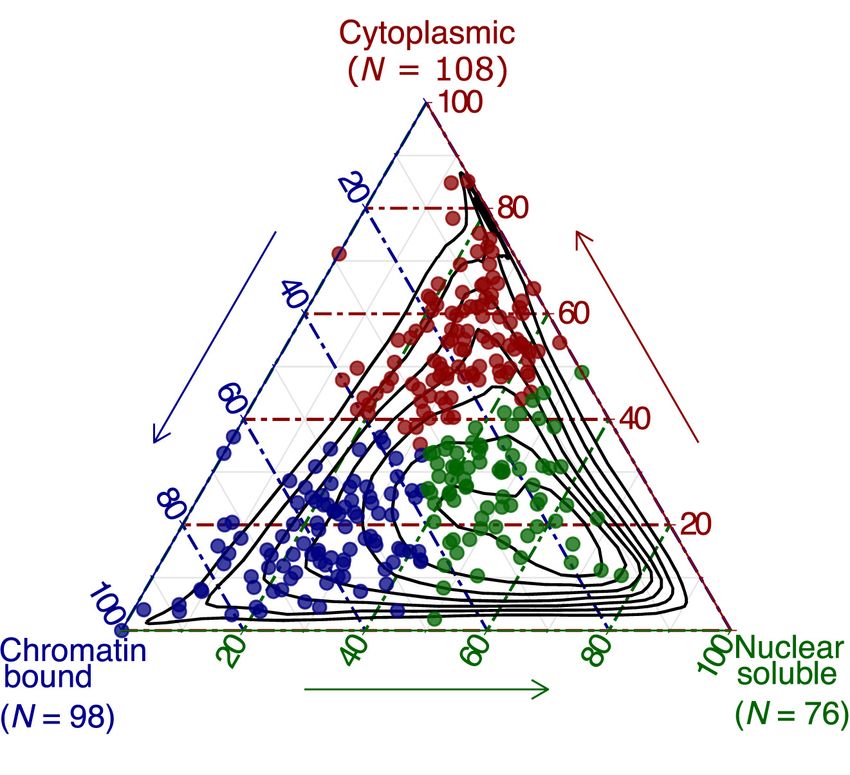
Downloaded from genome.cshlp.org on April 29, 2021 - Published by Cold Spring Harbor Laboratory Press

                                                                                                                           FANTOM6 pilot study

                A                                   B                                      C

                D                                                                          G

                E

                F

Figure 2. Cell growth and morphology assessment. (A) Selected example (PTPRG1-AS1) showing the normalized growth rate estimation using a match-
ing NC_A (negative control). (B) Correlation of the normalized growth rate for technical duplicates across 2456 Incucyte samples. (C) Density distribution
of normalized growth rates (technical replicates averaged) 252 ASOs targeting lncRNAs with successful knockdown (KD) and growth phenotype (blue)
consistent in two replicates (FDR < 0.05 as compared to matching NC_A; 246 ASOs inhibited growth), 627 ASOs targeting lncRNAs with successful KD
(purple), 270 negative control (NC_A) samples (gray), and 90 mock-transfected cells (Lipofectamine only) samples (yellow). (D) MKI67 staining (growth
inhibition validation) for four selected lncRNA targets after siRNA and ASOs suppression. (E) Incucyte cell images of selected distinct cell morphologies
changes upon an lncRNA KD. (F) An overview of the cell morphology imaging processing pipeline using a novel lncRNA target, CATG000089639.1, as
an example. (G) lncRNAs (N = 59) significantly (FDR < 0.05) and consistently (after adjusting for the number of successfully targeting ASOs) affecting
cell growth (N = 15) and cell morphologies (N = 44).

promote cell growth, including TFDP1, E2F1,2,3, and EP300, were                S6). Moreover, correlations of growth with GSEA pathways (Fig.
positively correlated with the measured cell growth rate, whereas              3F; Supplemental Fig. S4B; Supplemental Table S6) or with
transcription factor motifs known to inhibit growth or induce                  FANTOM5 coexpression clusters (Supplemental Fig. S4C) showed
apoptosis (e.g., PPARG, SREBPF, and STAT2,4,6) were negatively                 that cell growth and replication-related pathways were positively
correlated (Fig. 3D; Supplemental Fig. S4A; Supplemental Table                 correlated with the measured growth rate, whereas those related

                                                                                                                            Genome Research             5
                                                                                                                              www.genome.org
Downloaded from genome.cshlp.org on April 29, 2021 - Published by Cold Spring Harbor Laboratory Press
Ramilowski et al.
A B Cell radius and axis length were associat-
1.00 Selected for CAGE 104
(375 ASOs) ed with GSEA categories related to actin
Differentially expressed genes, count
3
10
Transfected (other)
arrangement and cilia, whereas cell com-
0.75 (1,646 ASOs) 102
Cumulative density
pactness was negatively correlated with
101
0.50 0
Up-regulated apoptosis. The extensive molecular phe-
Down-regulated
10 1 notyping analysis also revealed pathways
0.25 102
not explicitly associated with cell growth
103
and cell morphology, such as transcrip-
0.00 104
tion, translation, metabolism, develop-
0 25 50
Knockdown efficiency, %
75 100 1 50 100 150 200 250 300 340
ASOs, ranked
ment, and signaling (Fig. 3E).
Next, to globally assess whether in-
C 340 ASOs D dividual ASO knockdowns lead to
Motifs 10-10 TFDP1 lncRNA-specific effects, we scaled the ex-
FDR-adjusted p-value for Spearman’s correlation
EP300
TGIF1 10-8 E2F1..5
pression change of each gene across the
IRF1,2,7
SMAD1..7,9
10-6 ZBTB14 whole experiment and compared differ-
MYB
10-4 EP300 entially expressed genes (Fig. 3B) of all
TFDP1
EGR1..3
10-2 possible ASO pairs targeting the same
ZBTB14 Pos. correlation
1
Neg. correlation lncRNA target versus different lncRNAs
RXRA_VDR{dimer} 10-2 RXRA; VDR dimer
(Supplemental Methods; Supplemental
MYB FOS; FOS B,L1; JUN B,D
E2F1..5 10-4
STAT2,4,6 Table S5). We found that the concor-
JUN
10-6 SREBF1,2
dance of the same target group was sig-
SREBF1,2
PPARG
TP53
10-8
PPARG
nificantly greater than that of the
STAT2,4,6 10-10
1 20 40 60 80 100 different target group (comparing the
Motifs, ranked
−4 −2 0 2 4 Jaccard indices across 10,000 permuta-
Z-score on relative motif actvity
tions) (Supplemental Fig. S5A), suggest-
E F ing that ASO knockdowns are
nonrandom and lead to more lncRNA
FDR-adjusted p-value for Spearman’s correlation
10-16 GO CHROMATIN
GO DNA PACKAGING specific effects than the nontargeting
GO CHROMATIN REMODELING
10-12 GO DNA CONFORMATION CHANGE ASO pairs. Further, by requiring at least
10-8
GO MITOTIC CYTOKINESIS
REACTOME CELL CYCLE
five common DEGs (FDR ≤ 0.05, abs
10-4
[log2FC] > 0.5, abs[Z-score] > 1.645) and
Pos. correlation
ASO-pairs significantly above the non-
1
HALLMARK APOPTOSIS
Neg. correlation
targeting ASO pairs background (P ≤
-4
10
HALLMARK INTERFERON GAMMA RESPONSE 0.05), we identified 16 ASO pairs, target-
Pathway keywords:
10-8 Cell cycle, growth, replication, mitosis, ing 13 lncRNAs, exhibiting reproducible
GO POS. REGULAT. G0/1/2/S/M phase, DNA packaging,
10-12
OF STAT CASCADE
GO GROWTH
chromatin, nucleosome, centrosome
Aptoptosis, TP53 knockdown-mediated molecular re-
FACTOR ACTIVITY
10-16 HALLMARK
Immunity, defense, leukocyte,
cytokine, interferon, tumor necrosis sponses in human dermal fibroblasts
TP53 ACTIVITY Other
1 1,000 2,000 3,000 4,000 (Supplemental Fig. S5B). Corresponding
Pathways, ranked
-4 −2 0 2 4 GSEA pathways and MARA motifs of
-log10(p) × sign(NES).
these 16 ASO pairs are shown in
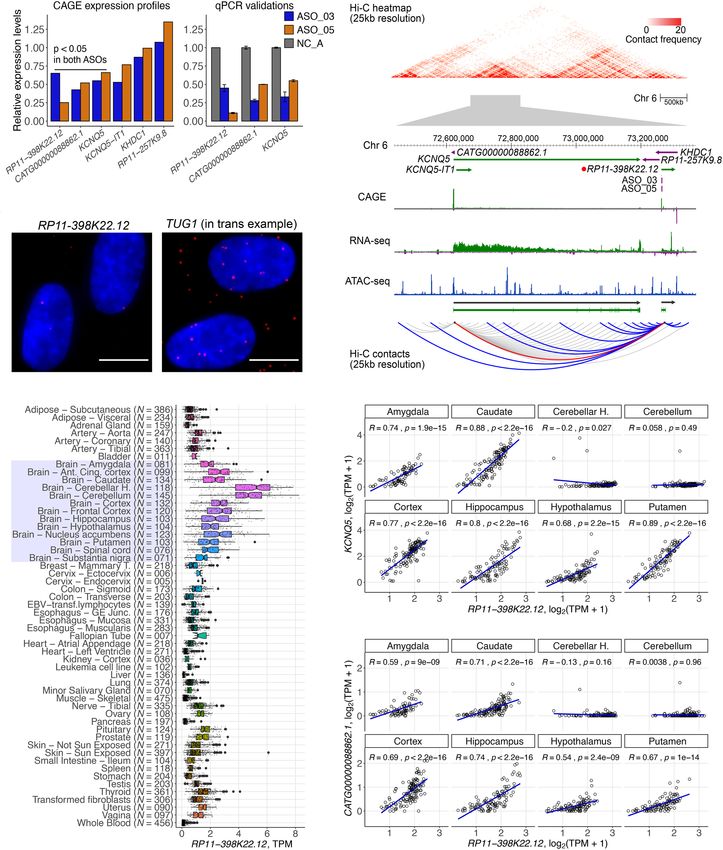
Figure 3. CAGE predicts cellular phenotypes. (A) RT-qPCR knockdown efficiency for 2021 ASO-trans- Supplemental Figure S5C.
fected samples (targeted lncRNAs only). Gray dashed line indicates 50% KD efficiency generally required
for CAGE selection. Purple dashed lines indicate median KD efficiency (71.5%) for 375 ASOs selected for
CAGE sequencing. After quality control, 340 ASOs targeting lncRNAs were included for further analysis. siRNA validation experiments
(B) Distribution of significantly differentially expressed genes (up-regulated: FDR < 0.05, Z-score > 1.645,
log2FC > 0.5; and down-regulated: FDR < 0.05, Z-score < −1.645, log2FC < −0.5) across all 340 ASOs. (C) To evaluate whether the lncRNA-specific
Motif Response Activity Analysis (MARA) across 340 ASOs. Scale indicates Z-score of the relative motif ac- effects can be measured by other knock-
tivity (the range was set to abs[Z-score] =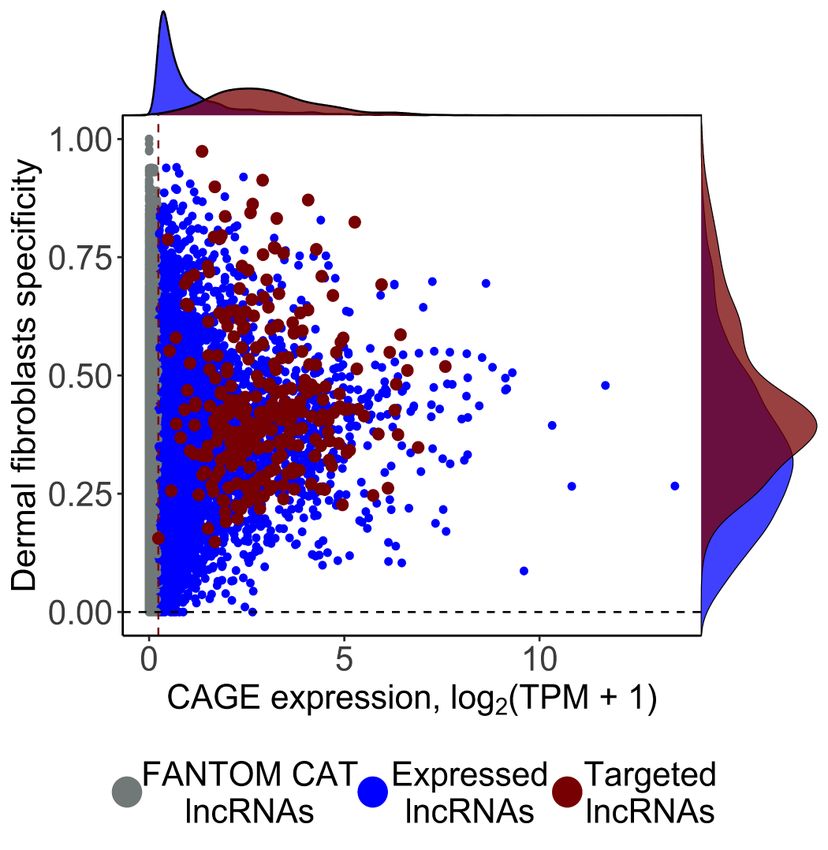
Downloaded from genome.cshlp.org on April 29, 2021 - Published by Cold Spring Harbor Laboratory Press

                                                                                                                         FANTOM6 pilot study

              A                            B                                                    C

               D                            E

Figure 4. ZNF213-AS1 regulates cell growth, migration, and proliferation. (A) Normalized growth rate across four distinct ASOs (in duplicate) targeting
ZNF213-AS1 as compared to six negative control samples (shown in gray). (B) Enrichment of biological pathways associated with growth, proliferation,
wound healing, migration, and adhesion for ASO_02 and ASO_05. (C) Most consistently down- and up-regulated transcription factor binding motifs in-
cluding those for transcription factors known to modulate growth, migration, and proliferation such as for example EGR family, EP300, GTF2I.
(D) Transfected, replated, and mitomycin C (5 µg/mL)-treated HDF cells were scratched and monitored in the Incucyte imaging system. Relative wound
closure rate calculated during the 24 h postscratching shows 40%–45% reduction for the two targeting ASOs (ASO_02 [N = 10] and ASO_05 [N = 13]) as
compared to NC_A transfection controls (N = 33, shown in gray) and the representative images of wound closure assay 16 h postscratching.
(E) Knockdown efficiency measured by RT-qPCR after wound closure assay (72 h posttransfection) showing sustained suppression (65%–90%) of
ZNF213-AS1.

exhibited by using ASOs alone suggests that lncRNAs, in part, are             S7), the molecular phenotype revealed suppression of GSEA path-
essential regulatory elements in cells. Yet, our study generally war-         ways related to cell growth, as well as to cell proliferation, motility,
rants a careful assessment of specific findings from different                and extracellular structure organization (Fig. 4B). We also observed
knockdown technologies, including CRISPR-inhibition, and dem-                 consistent down-regulation of motifs related to the observed cellu-
onstrates a requirement of using multiple replicates in a given tar-          lar phenotype, for example, EGR1, EP300, SMAD1…7,9 (Fig. 4C).
get per each modality.                                                              As cell motility pathways were affected by the knockdown, we
                                                                              tested whether ZNF213-AS1 could influence cell migration. Based
                                                                              on the wound-closure assay after transient cell growth inhibition
ZNF213-AS1 is associated with cell growth and migration                       (mitomycin C and serum starvation) (Supplemental Fig. S2F,G),
Extensive molecular and cellular phenotype data for each ASO                  we observed a substantial reduction of wound closure rate (∼40%
knockdown can be explored using our portal https:// fantom.gsc                over a 24-h period) in the ZNF213-AS1-depleted HDFs (Fig. 4D,
.riken.jp/zenbu/reports/#FAN TOM6. As an example of an lncRNA                 E). The reduced wound healing rate should thus mainly reflect re-
associated with cell growth and morphology (Fig. 2G), we showcase             duced cell motility, further confirming affected motility pathways
ZNF213-AS1 (RP11-473M20.14). This lncRNA is highly conserved                  predicted by the molecular phenotype.
in placental mammals, moderately expressed (∼eight CAGE tags                        As these results indicated a potential role of ZNF213-AS1 in
per million) in HDFs, and enriched in the chromatin-bound frac-               cell growth and migration, we used FANTOM CAT Recount 2 at-
tion. Four distinct ASOs (ASO_01, ASO_02, ASO_05, and ASO_06)                 las (Imada et al. 2020), which incorporates The Cancer Genome
strongly suppressed expression of ZNF213-AS1, whereas expression              Atlas (TCGA) data set (Collado-Torres et al. 2017), and found rel-
of the ZNF213 sense gene was not significantly affected in any of             atively higher expression of ZNF213-AS1 in acute myeloid leuke-
the knockdowns. The four ASOs caused varying degrees of cell                  mia (LAML) and in low-grade gliomas (LGG) as compared to
growth inhibition (Fig. 4A). ASO_01 and ASO_06 showed a reduc-                other cancers (Supplemental Fig. S6A). In LAML, the highest ex-
tion in cell number, as well as an up-regulation of apoptosis and im-         pression levels were associated with mostly undifferentiated
mune and defense pathways in GSEA, suggesting cell death. While               states, whereas in LGG, elevated expression levels were found
cell growth inhibition observed for ASO_02 and ASO_05 was con-                in oligodendrogliomas, astrocytomas, and in IDH1 mutated tu-
firmed by MKI67 marker staining (Fig. 2D; Supplemental Table                  mors, suggesting that ZNF213-AS1 is involved in modulating

                                                                                                                         Genome Research             7
                                                                                                                            www.genome.org
Downloaded from genome.cshlp.org on April 29, 2021 - Published by Cold Spring Harbor Laboratory Press
Ramilowski et al.
differentiation and proliferation of tumors (Supplemental Fig. in the expression response of divergent promoters (Supplemental
S6B–E). Further, univariate Cox proportional hazard analysis as Fig. S3B). Recent studies suggest that transcription of lncRNA loci
well as Kaplan-Meier curves for LGG were significant and consis- that do not overlap with other transcription units may influence
tent with our findings (HR = 0.61, BH FDR = 0.0079). The same RNA polymerase II occupancy on neighboring promoters and
survival analysis on LAML showed a weak association with gene bodies (Engreitz et al. 2016a; Cho et al. 2018). Thus, it is plau-
poor prognostic outcome, but the results were not significant sible that transcription of targeted lncRNA was maintained, de-
(Supplemental Fig. S6F,G). spite suppression of mature or nascent transcripts using ASOs.
This further suggests that the functional responses described in
this study are due to interference of processed transcripts present
RP11-398K22.12 (KHDC3L-2) regulates KCNQ5 in cis
either in the nucleus, the cytoplasm, or both. Although it is argu-
able that ASOs may interfere with general transcription by target-
Next, we investigated in detail RP11-398K22.12 (ENSG00000229
ing the 5′ -end of nascent transcripts and thus releasing RNA
852), where the knockdowns by two independent ASOs
polymerase II, followed by exonuclease-mediated decay and tran-
(ASO_03, ASO_05) successfully reduced the expression of the tar-
scription termination (aka “torpedo model”) (Proudfoot 2016),
get lncRNA (67%–82% knockdown efficiency, respectively) and
most of the ASOs were designed across the entire length of the
further down-regulated its neighboring genes, KCNQ5 and its
transcript. Since we did not broadly observe dysregulation in near-
divergent partner novel lncRNA CATG00000088862.1 (Fig. 5A).
by genes, interference of transcription or splicing activity is less
Although the two genomic loci occupy Chromosome 6 and
likely to occur.
are 650 kb away, Hi-C analysis (Supplemental Methods; Supple-
We observed a reduction in cell growth for ∼7.7% of our tar-
mental Fig. S7; Supplemental Table S8) showed that they are locat-
get lncRNA genes, which is in line with previous experiments us-
ed within the same topologically associated domain (TAD) and
ing CRISPRi-pooled screening, which reported 5.9% (in iPS cells)
spatially colocalized (Fig. 5B). Moreover, chromatin-enrichment
of lncRNAs exhibiting a cell growth phenotype (Liu et al. 2017).
and single molecule RNA-FISH of RP11-398K22.12 (Fig. 5C;
Although these rates are much lower than for protein-coding genes
Supplemental Table S9) suggested its highly localized cis-regulato-
(Sokolova et al. 2017), recurrent observations of cell growth phe-
ry role.
notypes (including cell death) strongly suggest that a substantial
In FANTOM5 (Hon et al. 2017), expression levels of RP11-
fraction of lncRNAs play an essential role in cellular physiology
398K22.12, KCNQ5, and CATG00000088862.1 were enriched in
and viability. Further, when applying image-based analysis, we
brain and nervous system samples, whereas GTEx (The GTEx
found that lncRNAs affect cell morphologies (Fig. 2G), which has
Consortium 2015) showed their highly specific expression in the
not been so far thoroughly explored.
brain, particularly in the cerebellum and the cerebellar hemisphere
Several lncRNAs such as MALAT1, NEAT1, and FIRRE have
(Fig. 5D). GTEx data also showed that expression of RP11-
been reported to orchestrate transcription, RNA processing, and
398K22.12 was highly correlated with the expression of KCNQ5
gene expression (Kopp and Mendell 2018) but are not essential
and CATG00000088862.1 across neuronal tissues (Fig. 5E,F), with
for mouse development or viability. These observations advocate
the exception of cerebellum and the cerebellar hemisphere,
for assays that can comprehensively profile the molecular changes
potentially due to relatively lower levels of KCNQ5 and
inside perturbed cells. Therefore, in contrast to cell-based assays,
CATG00000088862.1, whereas levels of RP11-398K22.12 re-
functional elucidation via molecular phenotyping provides com-
mained relatively higher. Additionally, we found an eQTL SNP
prehensive information that cannot be captured by a single phe-
(rs14526472) overlapping with RP11-398K22.12 and regulating ex-
notypic assay. Herein, the number of overlapping differentially
pression of KCNQ5 in brain caudate (P = 4.2 × 10⁻⁶; normalized ef-
expressed genes between two ASOs of the same lncRNA targets in-
fect size −0.58). All these findings indicate that RP11-398K22.12
dicated that 10.9% of lncRNAs exert a reproducible regulatory
is implicated in the nervous system by maintaining the expression
function in HDF.
of KCNQ5 and CATG000 00088862.1 in a cis-acting manner.
Although the features of selected lncRNAs are generally simi-
lar to those of other lncRNAs expressed in HDFs (Fig. 1B–D), the
Discussion cell-type-specific nature of lncRNAs and the relatively small sam-
pling size (119 lncRNAs with knockdown transcriptome profiles)
This study systematically annotates lncRNAs through molecular used in our study may not fully represent the whole extent of
and cellular phenotyping by selecting 285 lncRNAs from human lncRNA in other cell types. However, lncRNA targets that did not
dermal fibroblasts across a wide spectrum of expression, conserva- exhibit a molecular phenotype may be biologically relevant in oth-
tion levels and subcellular localization enrichments. Using ASO er cell types or cell states (Li and Chang 2014; Liu et al. 2017). At
technology allowed observed phenotypes to be associated to the the same time, our results showed that particular lncRNAs ex-
lncRNA transcripts, whereas, in contrast, CRISPR-based approach- pressed broadly in other tissues (e.g., in the human brain) were
es may synchronically influence the transcription machinery at functional in HDFs (such as RP11-398K22.12). Although the exact
the site of the divergent promoter or affect regulatory elements molecular mechanisms of RP11-398K22.12 are not yet fully under-
of the targeted DNA site. Knockdown efficiencies obtained with stood, its potential role in HDFs suggests that lncRNAs may be
ASOs were observed to be independent of lncRNA expression lev- functionally relevant across multiple tissues in spite of the cell-
els, subcellular localization, and of their genomic annotation, al- type-specific expression of lncRNAs.
lowing us to apply the same knockdown technology to various Further, we used siRNA technology to knockdown lncRNA
classes of lncRNAs. targets as a method for independent validation. When comparing
We investigated the cis-regulation of nearby divergent pro- the transcriptomes perturbed by ASOs and siRNAs, concordance
moters, which has been reported as one of the functional roles was observed only for three out of nine lncRNAs. This discrepancy
of lncRNA (Luo et al. 2016). However, in agreement with previous is likely due to different modes of actions of the two technologies.
studies (Guttman et al. 2011), we did not observe general patterns Whereas ASOs invoke RNase H-mediated cleavage, primarily active
8 Genome Research
www.genome.orgDownloaded from genome.cshlp.org on April 29, 2021 - Published by Cold Spring Harbor Laboratory Press
FANTOM6 pilot study
A B
C
D E
F
Figure 5. RP11-398K22.12 down-regulates KCNQ5 and CATG00000088862.1 in cis. (A) Changes in expression levels of detectable genes in the
same topologically associated domain (TAD) as RP11-398K22.12 based on Hi-C analysis. Both KCNQ5 and CATG00000088862.1 are down-reg-
ulated (P < 0.05) upon the knockdown of RP11-398K22.12 by two independent ASOs in CAGE analysis (left) as further confirmed with RT-qPCR
(right). (B) (Top) Representation of the chromatin conformation in the 4-Mb region proximal to the TAD containing RP11-398K22.12, followed
by the locus gene annotation, CAGE, RNA-seq, and ATAC-seq data for native HDFs. (Bottom) Schematic diagram showing Hi-C predicted con-
tacts of RP11-398K22.12 (blue) and KCNQ5 (gray) (25-kb resolution, frequency ≥ 5) in HDF cells. Red line indicates RP11-398K22.12 and KCNQ5
contact. (C) FISH image for RP11-398K22.12, suggesting proximal regulation. TUG1 FISH image (suggesting trans regulation) is included as a
comparison; (bar = 10 µm). (D) GTEx atlas across 54 tissues (N = 9662 samples) shows relatively high expression levels of RP11-398K22.12 in 13
distinct brain regions samples (highlighted). (E) Expression correlation for RP11-398K22.12 and KCNQ5 in eight out of 13 distinct brain regions,
as highlighted in D. (F) Expression correlation for RP11-398K22.12 and CATG00000088862.1 in eight out of 13 distinct brain regions, as high-
lighted in D.
in the nucleus, the siRNAs use the RNA-inducing silencing com- could be vastly different across compartments (Johnsson et al.
plex (RISC) mainly active in the cytoplasm. LncRNAs are known 2013). Since the majority of functional lncRNAs are reported to
to function in specific subcellular compartments (Chen 2016) be inside the nucleus (Palazzo and Lee 2018; Sun et al. 2018),
and their maturity, secondary structures, isoforms, and functions ASO-mediated knockdowns, which mainly target nuclear RNAs,
Genome Research 9
www.genome.orgDownloaded from genome.cshlp.org on April 29, 2021 - Published by Cold Spring Harbor Laboratory Press
Ramilowski et al.
are generally more suitable for functional screenings of our as an experimental control. For details, please refer to the
lncRNA (62% found in the nuclear compartment). Besides, the dy- Supplemental Methods.
namics of secondary effects mediated by different levels of knock-
down from different technologies are likely to be observed as
discordance when considering the whole transcriptome, where
ASO design
this kind of discordance has been reported previously (Stojic
et al. 2018). In contrast, in the MKI67 assay, where only a single ASOs were designed as RNase H-recruiting locked nucleic acid
feature such as growth phenotype is assayed, siRNA knockdown re- (LNA) phosphorothioate gapmers with a central DNA gap flanked
vealed higher reproducibility with ASO knockdown. This suggest- by 2–4 LNA nucleotides at the 5′ and 3′ ends of the ASOs. For de-
tails, please refer to the Supplemental Methods.
ed that the growth phenotype might be triggered by different
specific pathways in ASO- and siRNA-knockdowns.
Previous studies suggest that lncRNAs regulate gene expres-
sion in trans epigenetically, via direct or indirect interaction with Automated cell culturing, ASO transfection, and cell harvesting
regulators such as DNMT1 (Di Ruscio et al. 2013) or by directly Robotic automation (Hamilton) was established to provide a stable
binding to DNA (triplex) (Mondal et al. 2015) or other RNA-bind- environment and accurate procedural timing control for cell cul-
ing proteins (Tichon et al. 2016). Analysis of cellular localization turing and transfection. In brief, trypsin-EDTA detachment, cell
by fractionation followed by RNA-seq and in situ hybridization number and viability quantification, cell seeding, transfection,
can indicate whether a given lncRNA may act in trans by quantify- and cell harvesting were performed with automation. All transfec-
ing its abundance in the nuclear soluble fraction as compared to tions were divided into 28 runs on a weekly basis. ASO transfection
cytoplasm. Although most lncRNAs in the nuclear soluble fraction was performed with duplication. In each run, there were 16 inde-
may affect pathways associated with chromatin modification, ad- pendent transfections with ASO negative control A (NC_A,
ditional experiments to globally understand their interaction part- Exiqon) and 16 wells transfected with an ASO targeting MALAT-
ners will elucidate the molecular mechanism behind trans-acting 1 (Exiqon).
lncRNAs (Li et al. 2017; Sridhar et al. 2017). The HDF cells were seeded in 12-well plates with 80,000 cells
In summary, our study highlights the functional importance in each well 24 h prior to the transfection. A final concentration of
of lncRNAs regardless of their expression, localization, and conser- 20 nM ASO and 2 µL Lipofectamine RNAiMAX (Thermo Fisher
vation levels. Molecular phenotyping is a powerful and generally Scientific) were mixed in 200 µL Opti-MEM (Thermo Fisher
more sensitive to knockdown-mediated changes platform to reveal Scientific). The mixture was incubated at room temperature for
the functional relevance of lncRNAs that cannot be observed based 5 min and added to the cells, which were maintained in 1 mL com-
plete medium. The cells were harvested 48 h posttransfection by
on the cellular phenotypes alone. With additional molecular pro-
adding 200 µL RLT buffer from the RNeasy 96 kit (Qiagen) after
filing techniques, such as RNA duplex maps in living cells to decode
PBS washing. The harvested lysates were kept at −80°C. RNA was
common structural motifs (Lu et al. 2016), and Oxford Nanopore
extracted from the lysate for real-time quantitative RT-PCR
Technology (ONT) to annotate the full-length variant isoforms of
(Supplemental Methods).
lncRNAs (Hardwick et al. 2019), the structure-to-functional rela-
tionship of lncRNAs may be elucidated further in the future.
ASO transfection for real-time imaging
The HDF cells were transfected manually in 96-well plates to facil-
Methods itate high-throughput real-time imaging. The cells were seeded
24 h before transfection at a density of 5200 cells per well. A final
Gene models and lncRNA target selections concentration of 20 nM ASO and 2 µL Lipofectamine RNAiMAX
The gene models used in this study were primarily based on the (Thermo Fisher Scientific) were mixed in 200 µL Opti-MEM
FANTOM CAGE-associated transcriptome (CAT) at permissive (Thermo Fisher Scientific). After incubating at room temperature
level as defined previously (Hon et al. 2017). From this merged as- for 5 min, 18 µL of the transfection mix was added to 90 µL com-
sembly, there were ∼2000 lncRNAs robustly expressed in HDFs plete medium in each well. The ASOs were divided into 14 runs
(TPM ≥ 1). However, we selected lncRNA knockdown targets in and transfected in duplicate. Each plate accommodated six wells
an unbiased manner to broadly cover various types of lncRNAs of NC_A control, two wells of MALAT1 ASO control, and two wells
(TPM ≥ 0.2). Briefly, we first identified a list of the lncRNA genes of mock-transfection (Lipofectamine alone) control.
expressed in HDFs, with RNA-seq expression at least 0.5 fragments Phase-contrast images of transfected cells were captured every
per kilobase per million and CAGE expression at least 1 tag per mil- 3 h for 2 d with three fields per well by the Incucyte live-cell imag-
lion. Then, we manually inspected each lncRNA locus in the ing system (Essen Bioscience). The confluence in each field was an-
ZENBU genome browser for (1) its independence from neighbor- alyzed by the Incucyte software. The mean confluence of each well
ing genes on the same strand (if any), (2) support from RNA-seq was taken along the timeline until the mean confluence of the
(for exons and splicing junctions) and CAGE data (for TSSs) of NC_A control in the same plate reached 90%. The growth rate in
its transcript models, and (3) support from histone marks at TSSs each well was calculated as the slope of a linear regression. A nor-
for transcription initiation (H3K27ac) and along the gene body malized growth rate of each replicate was calculated as the growth
for elongation (H3K36me3), from the Roadmap Epigenomics rate divided by the mean growth rate of the six NC_A controls from
Consortium (Roadmap Epigenomics Consortium et al. 2015). A the same plate. Negative growth rate was derived when cells shrink
representative transcript model, which best represents the RNA- and/or detach. As these rates of cell depletion could not be normal-
seq signal, was manually chosen from each locus for design of an- ized by the rate of growth, negative values were maintained to in-
tisense oligonucleotides. In total, 285 lncRNA loci were chosen for dicate severe growth inhibition. Student’s t-test was performed
ASO suppression. Additional controls (NEAT1, protein coding between the growth rate of the duplicated samples and the six
genes) (Supplemental Table S1) were added, including MALAT1 NC_A controls, assuming equal variance.
10 Genome Research
www.genome.orgDownloaded from genome.cshlp.org on April 29, 2021 - Published by Cold Spring Harbor Laboratory Press
FANTOM6 pilot study
Cell morphology quantification Competing interest statement
For each transfection, a representative phase-contrast image at a The authors declare no competing interests.
single time point was exported from the Incucyte time-series.
These raw images were first transformed to probability maps of
cells by pixel classification using ilastik (1.3.2) (Berg et al. 2019).
The trained model was then applied to all images where the pre- Acknowledgments
dicted probability maps of cells (grayscale, 16 bits tiff format) We thank Linda Kostrencic, Hiroto Atsui, Emi Ito, Nobuyuki
were subsequently used for morphology quantification in Takeda, Tsutomu Saito, Teruaki Kitakura, Yumi Hara, Machiko
CellProfiler (3.1.5) (Carpenter et al. 2006). For details, please refer Kashiwagi, and Masaaki Furuno at RIKEN Yokohama for assistance
to the Supplemental Methods. in arranging collaboration agreements, ethics applications, com-
putational infrastructure, and the FANTOM6 meetings. We also
thank RIKEN GeNAS for generation and sequencing of the CAGE
MKI67 staining upon lncRNA knockdown
libraries and subsequent data processing. FANTOM6 was made
For the selected four lncRNA targets showing >25% growth inhibi- possible by a Research Grant for RIKEN Center for Life Science
tion, we used two siRNAs and two ASOs with independent se- Technology, Division of Genomic Technologies (CLST DGT) and
quences. The transfected cells were fixed by adding prechilled RIKEN Center for Integrative Medical Sciences (IMS) from MEXT,
70% ethanol and incubated at −20°C. The cells were washed Japan. I.V.K. and I.E.V. were supported by Russian Foundation
with FACS buffer (2% FBS in PBS, 0.05% NaN3) twice. FITC-conju- for Basic Research (RFBR) 18-34-20024, B.B. is supported by the fel-
gated MKI67 (20Raj1, eBioscience) was applied to the cells and lowship 2017FI_B00722 from the Secretaria d’Universitats i
subjected to flow cytometric analysis. Knockdown efficiency by Recerca del Departament d’Empresa i Coneixement (Generalitat
siRNA was determined by real-time quantitative RT-PCR using de Catalunya) and the European Social Fund (ESF), A Favorov
the same three primer pairs as for ASO knockdown efficiency. was supported by National Institutes of Health (NIH) P30
For details, please refer to the Supplemental Methods. CA006973 and RFBR 17-00-00208, D.G. is supported by a “la
Caixa”-Severo Ochoa pre-doctoral fellowship (LCF/BQ/SO15/
52260001), E.L.I. and L.M. were supported by NIH National
Wound closure assay Cancer Institute Grant R01CA200859 and Department of
The HDF cells were transfected with 20 nM ASO as described earlier Defense (DOD) award W81XWH-16-1-0739, M.K.-S. was support-
in 12-well plates. The cells were replated at 24 h posttransfection ed by Versus Arthritis UK 20298, A.L. was supported by the
into a 96-well ImageLock plate (Essen BioScience) at a density of Swedish Cancer Society, The Swedish Research Council, the
20,000 cells per well. At 24 h after seeding, cells form a spatially Swedish Childhood Cancer fund, Radiumhemmets forsknigs-
uniform monolayer with 95%–100% cell confluence. The cells fonder; V.J.M. was supported by the Russian Academy of
were incubated with 5 µg/mL mitomycin C for 2 h to inhibit cell Sciences Project 0112-2019-0001; Y.A.M. was supported by
division. Then, medium was refreshed and a uniform scratch was Russian Science Foundation (RSF) grant 18-14-00240, A.S. was sup-
created in each well by the WoundMaker (Essen BioScience). The ported by Novo Nordisk Foundation, Lundbeck Foundation,
closure of the wound was monitored by Incucyte live-cell imaging Danish Cancer Society, Carlsberg Foundation, Independent
system (Essen Bioscience) every 2 h for 24 h. The RNA was harvest- Research Fund Denmark, A.R.R.F. is currently supported by an
ed after the assay for real-time quantitative RT-PCR. For details, Australian National Health and Medical Research Council
please refer to the Supplemental Methods. Fellowship APP1154524, M.M.H. was supported by Natural
Sciences and Engineering Research Council of Canada (RGPIN-
2015-3948), C.S. was supported by the Interuniversity
Cap analysis of gene expression (CAGE) Consortium for Biotechnology (CIB) from the Italian Ministry of
Four micrograms of purified RNA were used to generate libraries ac- Education, University and Research (MIUR) grant n.974,
cording to the nAnT-iCAGE protocol (Murata et al. 2014). For de- CMPT177780. J. Luginbühl was supported by Japan Society for
tails, please refer to the Supplemental Methods. the Promotion of Science (JSPS) Postdoctoral Fellowship for
Foreign Researchers. C.J.C.P. was supported by RIKEN Special
Post-Doctoral Research (SPDR) fellowship.
Chromosome conformation capture (Hi-C)
Hi-C libraries were prepared essentially as described previously
(Lieberman-Aiden et al. 2009; Fraser et al. 2015a) with minor References
changes to improve the DNA yield of Hi-C products (Fraser et al. Ambasudhan R, Talantova M, Coleman R, Yuan X, Zhu S, Lipton SA, Ding S.
2015b). For details, please refer to the Supplemental Methods. 2011. Direct reprogramming of adult human fibroblasts to functional
neurons under defined conditions. Cell Stem Cell 9: 113–118. doi:10
.1016/j.stem.2011.07.002
Bai J, Yao B, Wang L, Sun L, Chen T, Liu R, Yin G, Xu Q, Yang W. 2019.
Data access lncRNA A1BG-AS1 suppresses proliferation and invasion of hepatocel-
lular carcinoma cells by targeting miR-216a-5p. J Cell Biochem 120:
All raw and processed sequencing data generated in this study have 10310–10322. doi:10.1002/jcb.28315
been submitted to the DNA Data Bank of Japan (DDBJ; https:// Berg S, Kutra D, Kroeger T, Straehle CN, Kausler BX, Haubold C, Schiegg M,
Ales J, Beier T, Rudy M, et al. 2019. ilastik: interactive machine learning
www.ddbj.nig.ac.jp/) under accession numbers DRA008311,
for (bio)image analysis. Nat Methods 16: 1226–1232. doi:10.1038/
DRA008312, DRA008436, and DRA008511 or can be accessed s41592-019-0582-9
through the FANTOM6 project portal https://fantom.gsc.riken Carninci P, Kasukawa T, Katayama S, Gough J, Frith MC, Maeda N, Oyama
.jp/6/datafiles. The analysis results can be downloaded from R, Ravasi T, Lenhard B, Wells C, et al. 2005. The transcriptional land-
scape of the mammalian genome. Science 309: 1559–1563. doi:10
https://fantom.gsc.riken.jp/6/suppl/Ramilowski_et_al_2020/data/ .1126/science.1112014
and interactively explored using our in-house portal https Carpenter AE, Jones TR, Lamprecht MR, Clarke C, Kang I, Friman O, Guertin
://fantom.gsc.riken.jp/zenbu/reports/#FANTOM6. DA, Chang J, Lindquist RA, Moffat J, et al. 2006. CellProfiler: image
Genome Research 11
www.genome.orgDownloaded from genome.cshlp.org on April 29, 2021 - Published by Cold Spring Harbor Laboratory Press
Ramilowski et al.
analysis software for identifying and quantifying cell phenotypes. Joung J, Engreitz JM, Konermann S, Abudayyeh OO, Verdine VK, Aguet F,
Genome Biol 7: R100. doi:10.1186/gb-2006-7-10-r100 Gootenberg JS, Sanjana NE, Wright JB, Fulco CP, et al. 2017. Genome-
Carrieri C, Cimatti L, Biagioli M, Beugnet A, Zucchelli S, Fedele S, Pesce E, scale activation screen identifies a lncRNA locus regulating a gene neigh-
Ferrer I, Collavin L, Santoro C, et al. 2012. Long non-coding antisense bourhood. Nature 548: 343–346. doi:10.1038/nature23451
RNA controls Uchl1 translation through an embedded SINEB2 repeat. Kalluri R. 2016. The biology and function of fibroblasts in cancer. Nat Rev
Nature 491: 454–457. doi:10.1038/nature11508 Cancer 16: 582–598. doi:10.1038/nrc.2016.73
Chen L-L. 2016. Linking long noncoding RNA localization and function. Kendall RT, Feghali-Bostwick CA. 2014. Fibroblasts in fibrosis: novel roles
Trends Biochem Sci 41: 761–772. doi:10.1016/j.tibs.2016.07.003 and mediators. Front Pharmacol 5: 123. doi:10.3389/fphar.2014.00123
Cho SW, Xu J, Sun R, Mumbach MR, Carter AC, Chen YG, Yost KE, Kim J, He Kopp F, Mendell JT. 2018. Functional classification and experimental dis-
J, Nevins SA, et al. 2018. Promoter of lncRNA gene PVT1 is a tumor-sup- section of long noncoding RNAs. Cell 172: 393–407. doi:10.1016/j
pressor DNA boundary element. Cell 173: 1398–1412.e22. doi:10.1016/ .cell.2018.01.011
j.cell.2018.03.068 Li L, Chang HY. 2014. Physiological roles of long noncoding RNAs: insight
Chu C, Zhang QC, da Rocha ST, Flynn RA, Bharadwaj M, Calabrese JM, from knockout mice. Trends Cell Biol 24: 594–602. doi:10.1016/j.tcb
Magnuson T, Heard E, Chang HY. 2015. Systematic discovery of .2014.06.003
Xist RNA binding proteins. Cell 161: 404–416. doi:10.1016/j.cell.2015 Li B, Wang JH-C. 2011. Fibroblasts and myofibroblasts in wound healing:
.03.025 force generation and measurement. J Tissue Viability 20: 108–120.
Collado-Torres L, Nellore A, Kammers K, Ellis SE, Taub MA, Hansen KD, Jaffe doi:10.1016/j.jtv.2009.11.004
AE, Langmead B, Leek JT. 2017. Reproducible RNA-seq analysis using re- Li X, Zhou B, Chen L, Gou L-T, Li H, Fu X-D. 2017. GRID-seq reveals the
count2. Nat Biotechnol 35: 319–321. doi:10.1038/nbt.3838 global RNA–chromatin interactome. Nat Biotechnol 35: 940–950.
De Hoon M, Shin JW, Carninci P. 2015. Paradigm shifts in genomics doi:10.1038/nbt.3968
through the FANTOM projects. Mamm Genome 26: 391–402. doi:10 Lieberman-Aiden E, van Berkum NL, Imakaev M, Ragoczy T, Telling A, Amit
.1007/s00335-015-9593-8 I, Lajoie BR, Sabo PJ, Dorschner MO, Williams L, et al. 2009.
Di Ruscio A, Ebralidze AK, Benoukraf T, Amabile G, Goff LA, Terragni J, Comprehensive mapping of long-range interactions reveals folding
Figueroa ME, De Figueiredo Pontes LL, Alberich-Jorda M, Zhang P, principles of the human genome. Science 326: 289–293. doi:10.1126/sci
et al. 2013. DNMT1-interacting RNAs block gene-specific DNA methyl- ence.1181369
ation. Nature 503: 371–376. doi:10.1038/nature12598 Liu SJ, Horlbeck MA, Cho SW, Birk HS, Malatesta M, He D, Attenello FJ,
Engreitz JM, Haines JE, Perez EM, Munson G, Chen J, Kane M, McDonel PE, Villalta JE, Cho MY, Chen Y, et al. 2017. CRISPRi-based genome-scale
Guttman M, Lander ES. 2016a. Local regulation of gene expression by identification of functional long noncoding RNA loci in human cells.
lncRNA promoters, transcription and splicing. Nature 539: 452–455. Science 355: eaah7111. doi:10.1126/science.aah7111
doi:10.1038/nature20149 Liu Y, Cao Z, Wang Y, Guo Y, Xu P, Yuan P, Liu Z, He Y, Wei W. 2018.
Engreitz JM, Ollikainen N, Guttman M. 2016b. Long non-coding RNAs: spa- Genome-wide screening for functional long noncoding RNAs in human
tial amplifiers that control nuclear structure and gene expression. Nat cells by Cas9 targeting of splice sites. Nat Biotechnol 36: 1203–1210.
Rev Mol Cell Biol 17: 756–770. doi:10.1038/nrm.2016.126 doi:10.1038/nbt.4283
The FANTOM Consortium, Suzuki H, Forrest ARR, Van Nimwegen E, Daub Lu Z, Zhang QC, Lee B, Flynn RA, Smith MA, Robinson JT, Davidovich C,
CO, Balwierz PJ, Irvine KM, Lassmann T, Ravasi T, Hasegawa Y, et al.
Gooding AR, Goodrich KJ, Mattick JS, et al. 2016. RNA duplex map in
2009. The transcriptional network that controls growth arrest and dif-
living cells reveals higher-order transcriptome structure. Cell 165:
ferentiation in a human myeloid leukemia cell line. Nat Genet 41:
1267–1279. doi:10.1016/j.cell.2016.04.028
553–562. doi:10.1038/ng.375
Luo S, Lu JY, Liu L, Yin Y, Chen C, Han X, Wu B, Xu R, Liu W, Yan P, et al.
Fraser J, Ferrai C, Chiariello AM, Schueler M, Rito T, Laudanno G, Barbieri M,
2016. Divergent lncRNAs regulate gene expression and lineage differen-
Moore BL, Kraemer DCA, Aitken S, et al. 2015a. Hierarchical folding and
tiation in pluripotent cells. Cell Stem Cell 18: 637–652. doi:10.1016/j
reorganization of chromosomes are linked to transcriptional changes in
.stem.2016.01.024
cellular differentiation. Mol Syst Biol 11: 852. doi:10.15252/msb
Ma L, Cao J, Liu L, Du Q, Li Z, Zou D, Bajic VB, Zhang Z. 2019. LncBook: a
.20156492
curated knowledgebase of human long non-coding RNAs. Nucleic Acids
Fraser J, Williamson I, Bickmore WA, Dostie J. 2015b. An overview of ge-
Res 47: D128–D134. doi:10.1093/nar/gky960
nome organization and how we got there: from FISH to Hi-C.
Mondal T, Subhash S, Vaid R, Enroth S, Uday S, Reinius B, Mitra S,
Microbiol Mol Biol Rev 79: 347–372. doi:10.1128/MMBR.00006-15
The GTEx Consortium. 2015. Human genomics. The Genotype-Tissue Mohammed A, James AR, Hoberg E, et al. 2015. MEG3 long noncoding
Expression (GTEx) pilot analysis: multitissue gene regulation in hu- RNA regulates the TGF-β pathway genes through formation of RNA-
mans. Science 348: 648–660. doi:10.1126/science.1262110 DNA triplex structures. Nat Commun 6: 7743. doi:10.1038/
Gupta RA, Shah N, Wang KC, Kim J, Horlings HM, Wong DJ, Tsai M-C, ncomms8743
Hung T, Argani P, Rinn JL, et al. 2010. Long non-coding RNA HOTAIR Murata M, Nishiyori-Sueki H, Kojima-Ishiyama M, Carninci P, Hayashizaki
reprograms chromatin state to promote cancer metastasis. Nature 464: Y, Itoh M. 2014. Detecting expressed genes using CAGE. Methods Mol
1071–1076. doi:10.1038/nature08975 Biol 1164: 67–85. doi:10.1007/978-1-4939-0805-9_7
Guttman M, Rinn JL. 2012. Modular regulatory principles of large non-cod- Palazzo AF, Lee ES. 2018. Sequence determinants for nuclear retention and
ing RNAs. Nature 482: 339–346. doi:10.1038/nature10887 cytoplasmic export of mRNAs and lncRNAs. Front Genet 9: 440. doi:10
Guttman M, Donaghey J, Carey BW, Garber M, Grenier JK., Munson G, .3389/fgene.2018.00440
Young G, Lucas AB, Ach R, Bruhn L, et al. 2011. lincRNAs act in the cir- Proudfoot NJ. 2016. Transcriptional termination in mammals: stopping the
cuitry controlling pluripotency and differentiation. Nature 477: 295– RNA polymerase II juggernaut. Science 352: aad9926. doi:10.1126/sci
300. doi:10.1038/nature10398 ence.aad9926
Hardwick SA, Bassett SD, Kaczorowski D, Blackburn J, Barton K, Bartonicek Quek XC, Thomson DW, Maag JLV, Bartonicek N, Signal B, Clark MB, Gloss
N, Carswell SL, Tilgner HU, Loy C, Halliday G, et al. 2019. Targeted, BS, Dinger ME. 2015. lncRNAdb v2.0: expanding the reference database
high-resolution RNA sequencing of non-coding genomic regions associ- for functional long noncoding RNAs. Nucleic Acids Res 43: D168–D173.
ated with neuropsychiatric functions. Front Genet 10: 309. doi:10.3389/ doi:10.1093/nar/gku988
fgene.2019.00309 Quinn JJ, Chang HY. 2016. Unique features of long non-coding RNA bio-
Hon C-C, Ramilowski JA, Harshbarger J, Bertin N, Rackham OJL, Gough J, genesis and function. Nat Rev Genet 17: 47–62. doi:10.1038/nrg.2015.10
Denisenko E, Schmeier S, Poulsen TM, Severin J, et al. 2017. An atlas Ransohoff JD, Wei Y, Khavari PA. 2018. The functions and unique features
of human long non-coding RNAs with accurate 5′ ends. Nature 543: of long intergenic non-coding RNA. Nat Rev Mol Cell Biol 19: 143–157.
199–204. doi:10.1038/nature21374 doi:10.1038/nrm.2017.104
Imada E-L, Sanchez DF, Collado-Torres L, Wilks C, Matam T, Dinalankara Roadmap Epigenomics Consortium, Kundaje A, Meuleman W, Ernst J,
W, Stupnikov A, Lobo-Pereira F, Yip C-W, Yasuzawa K, et al. 2020. Bilenky M, Yen A, Heravi-Moussavi A, Kheradpour P, Zhang Z, Wang
Recounting the FANTOM CAGE-Associated Transcriptome. Genome J, et al. 2015. Integrative analysis of 111 reference human epigenomes.
Res (this issue). doi:10.1101/gr.254656.119 Nature 518: 317–330. doi:10.1038/nature14248
Iyer MK, Niknafs YS, Malik R, Singhal U, Sahu A, Hosono Y, Barrette TR, Roux BT, Lindsay MA, Heward JA. 2017. Knockdown of nuclear-located en-
Prensner JR, Evans JR, Zhao S, et al. 2015. The landscape of long noncod- hancer RNAs and long ncRNAs using locked nucleic acid GapmeRs.
ing RNAs in the human transcriptome. Nat Genet 47: 199–208. doi:10 Methods Mol Biol 1468: 11–18. doi:10.1007/978-1-4939-4035-6_2
.1038/ng.3192 Sokolova M, Turunen M, Mortusewicz O, Kivioja T, Herr P, Vähärautio A,
Johnsson P, Ackley A, Vidarsdottir L, Lui W-O, Corcoran M, Grandér D, Björklund M, Taipale M, Helleday T, Taipale J. 2017. Genome-wide
Morris KV. 2013. A pseudogene long-noncoding-RNA network regulates screen of cell-cycle regulators in normal and tumor cells identifies a dif-
PTEN transcription and translation in human cells. Nat Struct Mol Biol ferential response to nucleosome depletion. Cell Cycle 16: 189–199.
20: 440–446. doi:10.1038/nsmb.2516 doi:10.1080/15384101.2016.1261765
12 Genome Research
www.genome.orgYou can also read