Genome wide simple sequence repeats (SSR) markers discovered from whole genome sequence comparisons of multiple spinach accessions - Nature
←
→
Page content transcription
If your browser does not render page correctly, please read the page content below
www.nature.com/scientificreports
OPEN Genome‑wide simple sequence
repeats (SSR) markers discovered
from whole‑genome sequence
comparisons of multiple spinach
accessions
Gehendra Bhattarai 1, Ainong Shi 1*, Devi R. Kandel2, Nora Solís‑Gracia2,
Jorge Alberto da Silva2,3 & Carlos A. Avila 2,4*
The availability of well-assembled genome sequences and reduced sequencing costs have enabled
the resequencing of many additional accessions in several crops, thus facilitating the rapid discovery
and development of simple sequence repeat (SSR) markers. Although the genome sequence of
inbred spinach line Sp75 is available, previous efforts have resulted in a limited number of useful SSR
markers. Identification of additional polymorphic SSR markers will support genetics and breeding
research in spinach. This study aimed to use the available genomic resources to mine and catalog
a large number of polymorphic SSR markers. A search for SSR loci on six chromosome sequences
of spinach line Sp75 using GMATA identified a total of 42,155 loci with repeat motifs of two to six
nucleotides in the Sp75 reference genome. Whole-genome sequences (30x) of additional 21 accessions
were aligned against the chromosome sequences of the reference genome and in silico genotyped
using the HipSTR program by comparing and counting repeat numbers variation across the SSR
loci among the accessions. The HipSTR program generated SSR genotype data were filtered for
monomorphic and high missing loci, and a final set of the 5986 polymorphic SSR loci were identified.
The polymorphic SSR loci were present at a density of 12.9 SSRs/Mb and were physically mapped. Out
of 36 randomly selected SSR loci for validation, two failed to amplify, while the remaining were all
polymorphic in a set of 48 spinach accessions from 34 countries. Genetic diversity analysis performed
using the SSRs allele score data on the 48 spinach accessions showed three main population groups.
This strategy to mine and develop polymorphic SSR markers by a comparative analysis of the genome
sequences of multiple accessions and computational genotyping of the candidate SSR loci eliminates
the need for laborious experimental screening. Our approach increased the efficiency of discovering a
large set of novel polymorphic SSR markers, as demonstrated in this report.
Cultivated spinach (Spinacia oleracea L.) is an important cool-season leafy vegetable crop. Spinach is dioecious,
wind-pollinated, and a highly heterozygous species. From the nutrition perspective, spinach is an excellent source
of health-promoting compounds and n utrients1. Spinach is a nutrient-dense food that contains high amounts
of vitamins, proteins, minerals, flavonoids, and antioxidants but low in calories2,3. The demand for fresh market
spinach has doubled in the last decade4, probably because of the health benefit and year-round availability of
cleaned packaged spinach. The United States annually produces 0.43 million tonnes of spinach with a product
ollars4, and organic production comprises nearly 50% of the total production in the United
value of 425 million d
States.
Simple sequence repeats (SSR), also known as microsatellites, are DNA segments with a tandem repeat motif
of 1–6 nucleotides. Genome-wide coverage, robust and high reproducibility, co-dominant inheritance, high
polymorphism with multiple alleles per locus, transferability between species, and low requirements of expertise
1
Department of Horticulture, University of Arkansas, Fayetteville, AR 72701, USA. 2Texas A&M AgriLife Research
and Extension Center, Weslaco, TX 78596, USA. 3Department of Crop and Soil Sciences, Texas A&M University,
College Station, TX 77843, USA. 4Department of Horticultural Sciences, Texas A&M University, College Station,
TX 77843, USA. *email: ashi@uark.edu; carlos.avila@ag.tamu.edu
Scientific Reports | (2021) 11:9999 | https://doi.org/10.1038/s41598-021-89473-0 1
Vol.:(0123456789)
www.nature.com/scientificreports/
and instrumentation are some of the attractive features of SSR markers. Hence, SSR markers are relatively low
cost for genotyping plants and can be used by small labs. SSR markers have been applied in fingerprinting,
genetic diversity studies, population structure analysis, association mapping, and linkage m apping5–8. All such
applications support to increase fundamental genetics research and plant breeding activities. SSR markers are
being developed in many c rops9–12 and plant pathogens13–15 in recent years.
In spinach, a limited number of useful SSRs have been reported. In a small panel of 33 hybrid cultivars using
13 SSR markers, genetic diversity studies found clustering of cultivars into three genetic groups based on origin
from different breeding stations16. Another study used a set of six SSR markers to investigate genetic diversity
in 50 spinach accessions and showed the spinach accessions had high genetic diversity and reported that the
accessions from West Asia (Afghanistan, Iran, Iraq, and Syria) had the highest genetic diversity17. Furthermore, a
search on the bacterial artificial chromosome (BAC) end sequences identified 100 SSR markers showing multiple
PCR bands, but the markers were not used to fingerprint or assess d iversity18. Another study reported a set of
85 polymorphic SSR markers mined from genome sequences of a spinach cultivar, and the loci were genotyped
in a set of 48 worldwide spinach accessions and found clustering of spinach accessions based on geographical
origin19. Recently, 34 new polymorphic SSR markers were developed from the spinach reference genome of Xu
et al.27 and were used to assess the genetic diversity of Chinese spinach germplasm c ollection20. A fewer number
of SSR markers have been reported in spinach; thus, the availability of a large number of useful SSR markers will
facilitate spinach genetics and breeding.
The origin of spinach is believed to be in the former Persia; however, domestication and migration have not
been fully e lucidated21. The Spinacia genus contains two wild species: S. turkestanica and S. tetrandra. Both the
wild Spinacia species are native to Central Asia in the Caspian sea area over the two major geographical regions.
The S. turkestanica is native to Central and South Asia in Turkmenistan, Uzbekistan, Kazakhstan, Tajikistan,
Afghanistan, and Pakistan, while the S. tetrandra is native to Transcaucasia and Kurdistan region in Armenia,
Georgia, Iran, Iraq, and T urkey22–24. Spinach is believed to have migrated to China via Nepal during the seventh
century, and later to Europe and very recently to the United States25. Recent studies were conducted to explore
the genetic diversity of spinach germplasm, including the wild Spinacia species, and explore crop ancestry and
domestication region that support migration of spinach to China via N epal26. Both wild species are interfertile
with the cultivated S. oleracea suggesting close genetic relation and recent domestication h istory26. The genetic
evidence suggests that S. turkestanica is the progenitor of cultivated spinach . There is a great opportunity to
26,27
explore the genetic diversity of Spinacia accessions to use them in spinach improvement and by using molecular
markers to perform fingerprinting, genetic characterization, marker-trait association, and to incorporate the new
findings into molecular breeding programs for cultivar development.
The development of new SSR markers used to be an expensive and time-consuming effort until recently.
With the rapid development of sequencing technologies and reduced sequencing cost, genome assemblies are
now available for many crops facilitating the rapid and efficient development of SSR markers12,28. The rese-
quencing of multiple accessions is common for many commercially important crops with the advancements
in sequencing technology. The reference genome assemblies and resequencing reads can be efficiently used to
identify and profile a large number of genome-wide polymorphic SSR markers. Several recent bioinformatics
tools such as L obSTR29, RepeatSeq30, STRViper31, and H ipSTR32 have adopted an improved method to identify
and genotype SSR alleles using the reference assembly and a set of whole-genome sequence data from multiple
samples/individuals.
The genome sequence of inbred spinach line Sp75 is available27; however, a limited number of SSR markers
have been reported in spinach. In addition, whole-genome resequencing (30x) of 21 spinach accessions were
recently generated by our group. This study aimed to explore the chromosome sequences of the Sp75 genome to
identify SSR-containing regions and their genomic distribution, identify a larger set of genome-wide polymorphic
SSR markers via in silico genotyping using the genome sequences of multiple spinach accessions, and validate a
subset of markers following PCR amplification and fragment sizing. The present study is the first comprehensive
report of mining and cataloging several thousand polymorphic SSR markers with a known physical position in
the spinach genome. The potential of in silico identified polymorphism was further validated following a standard
molecular assay, and the usefulness of the markers was confirmed by conducting genetic diversity assessment of
the worldwide germplasm accessions. Identifying a large set of SSR markers using this approach provides a cost
and resource-efficient alternative to the traditional SSR discovery approaches, which involves random testing of
primer pairs designed from the genome and transcriptome sequences.
Materials and methods
Plant material. A set of 48 diverse spinach accessions comprising USDA and differential accessions were
used for molecular validation and diversity analysis in this study (Supplementary Table S1). Seeds were obtained
from the USDA-GRIN spinach germplasm collection at the USDA-ARS North Central Regional Plant Introduc-
tion Station, Ames, Iowa. The USDA accessions were originally collected from 34 countries representing world-
wide diversity, including 36 S. oleracea and three S. turkestanica accessions. Plants were grown in the greenhouse
condition for 2–3 weeks and leaves were collected for DNA extraction.
SSR mining. The reference genome sequence of spinach inbred line Sp75 is publicly a vailable27 in the Spin-
achBase database (www.spinachbase.org/). The genome was assembled to 996 Mb with six chromosomes and
77,293 scaffolds. The overall procedure used to mine SSRs and identify genome-wide polymorphic SSR loci is
outlined in Fig. 1. Briefly, the six spinach chromosome sequences were extracted from the genome assembly
and the extracted sequences were searched for SSRs using the GMATA p rogram33. The SSR loci were searched
for dinucleotide to hexanucleotide repeat motifs with a minimum repeat number of 6, 5, 4, 4, 4 for di, tri, tetra,
Scientific Reports | (2021) 11:9999 | https://doi.org/10.1038/s41598-021-89473-0 2
Vol:.(1234567890)
www.nature.com/scientificreports/
Figure 1. Outline of the approach used to discover SSR loci from the genome sequence, the stepwise procedure
employed to identify a large set of polymorphic loci, and genetic characterization and diversity analysis.
penta, and hexanucleotides repeats, respectively. Primer pairs were designed using the default parameters in
GMATA with the product size ranging from 100 to 400 bp, the annealing temperature of 60 °C (59–61 °C),
minimum GC of 40%, and primer length of 20 bp (18–25 bp) using the Primer3 algorithm. Next, the SSR loci
for which primers could not be designed were removed and 250 bp flanking sequences on either side of the SSR
motifs were extracted for the loci for which primers were designed. Next, the SSR motifs containing only A and
T were removed as they are known to be difficult to s core12, and the SSR loci lying less than 100 nucleotides
apart were removed. Finally, the remaining filtered set of SSR loci were pursued to look for polymorphism as
described below.
In silico polymorphism screening. The genome of 21 spinach accessions were resequenced to a depth
of 30× using the Illumina NovaSeq machine at Novogene. The genome sequences of the 21 accessions (Cal-
iflay, Campania, Clermont, Dolphin, F380, Lazio, Lion, Meerkat, PI4, PI6, PV1202, PV1206, Pigeon, Resistoflay,
S08_350, S906304, T14_717, Viroflay, Whale, X10_539, and X97_313) were aligned against the chromosome
sequences of the Sp75 assembly to investigate variation in the number of SSR repeat units among the genome
sequences of multiple spinach accessions. Initially, the paired-end reads of each of the 21 spinach accessions
were mapped to the chromosome sequences of the reference genome using BWA mem v.0.7.1734, and SAMtools
v.1.935 was used to convert the SAM to BAM format, to discard the unmapped reads, and to sort and index the
final alignment file. The mapping and in silico genotyping analysis was performed using the High Performance
Computing Center (AHPCC) at the University of Arkansas.
Next, for the filtered set of SSR loci obtained from the GMATA run, a bed file was prepared for each of the
selected SSR loci that contain chromosome name, start and end position of SSR loci, motif length, the number
of repeat units in the reference sequence, and the SSR locus name. The aligned bam files of the 21 accessions,
the bed file containing the SSR regions in the reference genome, and the reference chromosome sequence used
to mine SSRs were used to allelotype in the HipSTR p rogram32. The HipSTR program was run using the exter-
nal stutter models and SSR calling with de novo allele generation mode. The HipSTR generated VCF files with
SSR calls were filtered for low quality calls using HipSTR option: -min-call-qual 0.9 -max-call-flank-indel 0.15
-max-call-stutter 0.15. Furthermore, the genotype calls were filtered for monomorphic and high missing rates
among the accessions and non-reference alleles on less than two accessions. Stepwise removal of monomorphic,
high missing, and less interesting loci, a large set in silico genotyped polymorphic loci were retained (Fig. 1).
The physical map was drawn in R using the start position of the polymorphic SSR markers, and the markers
were colored uniquely for each motif lengths (di- through hexa-). In addition, the genome coordinate of the
Scientific Reports | (2021) 11:9999 | https://doi.org/10.1038/s41598-021-89473-0 3
Vol.:(0123456789)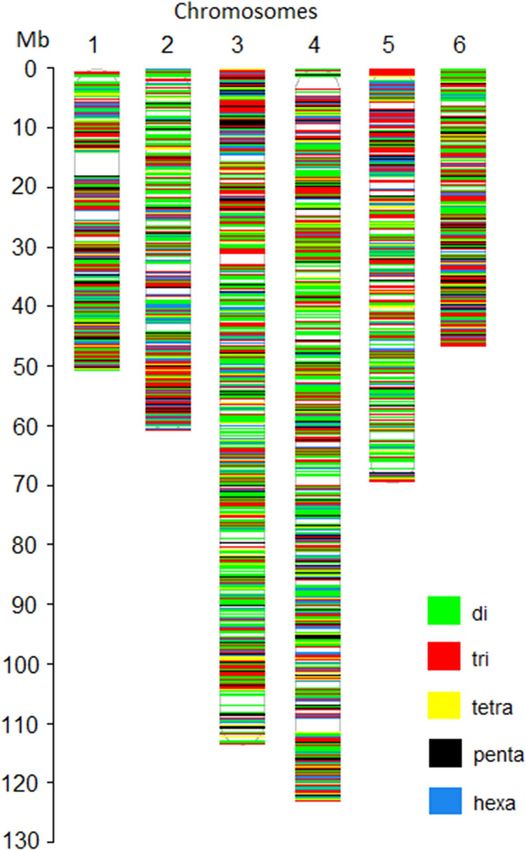
www.nature.com/scientificreports/
polymorphic SSRs was compared with the general feature format (GFF) file to identify SSRs distribution within
the genic or intergenic regions, and gene function annotations were retrieved from the SpinachBase database.
SSR markers polymorphism validation. From the set of in silico identified polymorphic SSR loci, 36
loci distributed randomly across all six chromosomes, and all motifs types (di, tri, tetra, penta, and hexanu-
cleotide repeat motifs) were selected for molecular validation. Primer pairs previously designed in GMATA
programs were used for PCR. However, for 19 SSR loci, primer pairs were redesigned using Primer 3 36 to change
the expected product size to fit PCR multiplexing and Capillary electrophoresis fragment sizing. All primer
pairs were designed with lengths of 20–23 bp, the annealing temperature of 60 °C, and the product size range
of 100–400 bp. Also, the 36 primer pairs were designed to fit in six multiplexed sets, with each set consisting of
six SSR loci. Primer pairs were then used to genotype 48 USDA spinach accessions and commercial cultivars
(Supplementary Table S1). The 48 diverse spinach panels used in the molecular validation also contain nine
differential cultivars (Viroflay, Resistoflay, Califlay, Clermont, Lion, Lazio, Whale, Pigeon, and Meerkat) with
resequencing data that were initially used to identify polymorphic SSRs following HipSTR analysis. The DNA
was extracted using the CTAB buffer (OPS Diagnostics, Lebanon, New Jersey, USA) from three to five young
plants per accession.
The PCR reactions were performed as the previous method37 using the M13 tailing PCR procedure38. The
forward primers were tailed by adding an M13 sequence labeled with IRDye to the 5′ end. The PCR reaction
was run with the following conditions: 94 °C for 5 min, then 29 cycles at 94 °C for 30 s, 60 °C for 45 s, 72 °C
for 45 s, followed by 7 cycles of 94 °C for 30 s, 55 °C for 45 s, 72 °C for 45 s, and a final extension at 72 °C for
10 min. After amplification, 1 µl of each PCR product was mixed with 30 µl of 2X formamide loading buffer
(LI-COR, Inc., Lincoln, Nebraska, USA). The resultant mixture was denatured for 5 min at 94 °C and then
visualized on 6% denatured polyacrylamide gel using a 4300 DNA analyzer (LI-COR, Inc., Lincoln, Nebraska,
USA). Markers were scored as 1 or 0 for the presence and absence of alleles. The binary scores matrix was used
for further genetic analysis.
Genetic diversity, population structure and phylogeny analysis. Amplified loci showing two or
more scorable bands among the spinach accessions were used for genetic characterization. Expected heterozy-
gosity (He) or gene diversity was computed in GenAlEx 6.539, while the number of alleles and polymorphism
information content (PIC) for the SSRs were calculated using PowerMarker v3.25 s oftware40.
Population structure was inferred using Bayesian clustering implemented in STRUCTURE v.2.3.441. Structure
analysis was run for K (number of subpopulations) values ranging from 1 to 10 using the admixture ancestry
and correlated allele frequency model. Ten independent runs for each K were performed with the burn-in length
of 200,000 and MCMC repetitions of 200,000 to estimate the number of the subpopulation. The optimal K was
determined using the delta K estimation method42 using STRUCTURE H arvester43. Spinach accessions were
assigned to the subpopulations based on the cluster assignment probability (Q). The cluster assignment prob-
ability (Q) value of 0.50 was used to assign spinach accessions to each subpopulation. The bar plot was drawn
using the Q matrices for the optimal K in R version 3.6.3 (R Core Team, Vienna, Austria).
The population structure was further confirmed using principal component analysis (PCA) in TASSEL
5.2.6544. The PCA plot was drawn in R using the PCA matrices and adding the accessions ID, Q group assign-
ment from STRUCTURE analysis, and species information. Further, phylogenetic trees were drawn using
the maximum likelihood method based on the Tamura-Nei model45 in MEGA 746 by applying Neighbor-Join
and BioNJ algorithms to a matrix of pairwise distances estimated using the Maximum Composite Likelihood
(MCL) approach. To ease visualization, STRUCTURE generated Q matrices were imported as the group name
in MEGA7, and the branch shape, nodes, and branch line of the phylogenetic tree were drawn with the same
color as in the STRUCTURE bar plots and PCA plots.
Results
SSR frequency and distribution. The reference spinach genome was assembled to 996 Mb27 and the
chromosome sequence comprised 463.4 Mb, representing about 47% of the genome assembly. The chromosome
sequence was searched for dinucleotide to hexanucleotide repeat motifs with a minimum repeat number of 6,
5, 4, 4, 4 for di, tri, tetra, penta, and hexanucleotides repeats, respectively. A total of 42,155 SSR loci (excluding
mono-nucleotides) were identified in six spinach chromosome sequences (Tables 1, 2). The SSR loci identified
with the given parameters in this study were distributed at a higher density (total SSRs/Mb) on chromosome 6
and chromosome 1 compared to the rest of the chromosomes (Table 1). The frequency of SSRs were 102.6, 89.9,
90.5, 87.3, 81.3, 104.6 loci/Mb across chromosome 1 through 6, respectively (Table 1). The dinucleotide repeat
was most abundant, comprising 41.03%, followed by tri, tetra, penta, and hexa repeat SSR comprising 31.07,
14.05, 8.67, 5.15%, respectively (Table 2, Fig. 2).
Polymorphic SSRs identification through in silico genome sequence comparison. The SSR loci
identified from the GMATA program were investigated in a stepwise manner to identify genome-wide poly-
morphic loci (Fig. 1, Table 2). Primer pairs were successfully designed for 35,567 of the total SSR loci and were
pursued further in the study. Of these, 14,566 SSRs contained only A and T and were removed. Similarly, 1604
SSR loci were near located (less than 100 bp) and removed. The remaining 19,397 SSR loci were pursued to
investigate polymorphism using the HipSTR program (Table 2).
Next, a bed format file containing the coordinate of all 19,397 selected SSR loci was prepared. The whole-
genome sequences of 21 spinach accessions were mapped to the chromosome sequences of the reference
genome, and aligned bam files were generated for each spinach accession. Using the HipSTR program, an in
Scientific Reports | (2021) 11:9999 | https://doi.org/10.1038/s41598-021-89473-0 4
Vol:.(1234567890)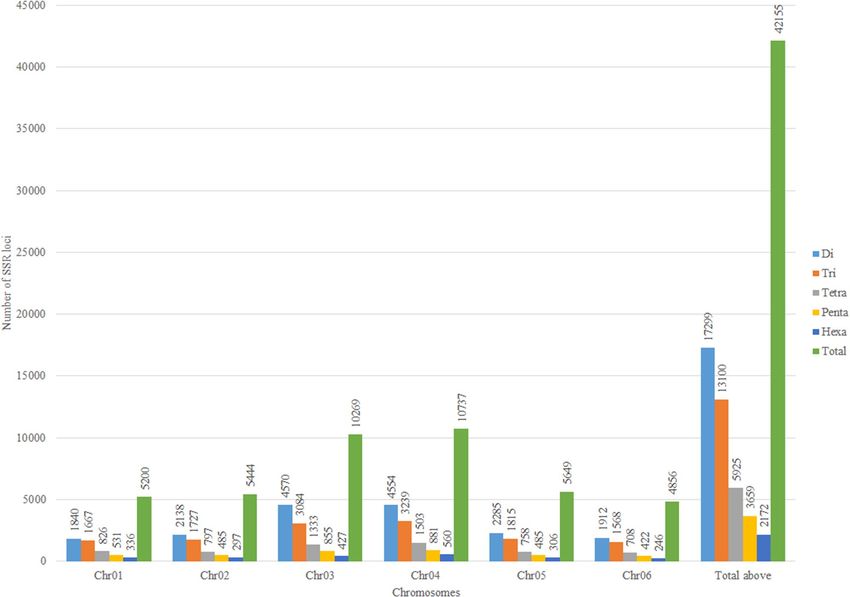
www.nature.com/scientificreports/
No. of polymorphic SSRs/
Chromosome Chromosome size (bp) No. of SSRs No. of SSRs/Mb No. of polymorphic SSRs Mb
Chr01 50,662,332 5200 102.6 862 17.0
Chr02 60,576,128 5444 89.9 820 13.5
Chr03 113,461,288 10,269 90.5 1277 11.3
Chr04 122,945,393 10,737 87.3 1529 12.4
Chr05 69,506,562 5649 81.3 777 11.2
Chr06 46,407,490 4856 104.6 721 15.5
Total 463,559,193 42,155 – 5986 –
Average – – 90.9 – 12.9
Table 1. Chromosome-wise distribution and density of the simple sequence repeat (SSR) loci in the spinach
genome.
Mono- and missing No. of loci with
Motifs Total Primer designed Distance ≤ 100 bp Only A&T HipSTR pursued HipSTR calls at all genotype alternate allele < 2 Polymorphic loci
Di 17,299 15,459 675 6640 8144 6729 4021 701 2007
Tri 13,100 11,072 391 4847 5834 4963 2328 660 1975
Tetra 5925 4022 40 2349 1633 1427 803 188 436
Penta 3659 2935 445 477 2013 1613 813 198 602
Hexa 2172 2079 53 253 1773 1447 336 145 966
Total 42,155 35,567 1604 14,566 19,397 16,179 8301 1892 5986
Table 2. Distribution of simple sequence repeat (SSR) marker in Sp75 genome. Stepwise screening of genome-
wide SSR loci to develop polymorphic SSRs is noted. Selected SSR loci were computationally genotyped using
the genome sequences of additional accessions. The SSR loci varying in repeating units among the 21 spinach
accessions were identified as a polymorphic marker.
silico genotyping was performed using the aligned bam files of 21 spinach accessions, bed files containing coor-
dinates of 19,397 SSR loci, and reference chromosome sequences. The HipSTR program generated genotype calls
for 16,197 SSR loci (Table 2). Of these, 8301 loci were either monomorphic or had missing calls in all accessions
and were not pursued. Furthermore, 1892 SSR loci were discarded as these contain non-reference alleles on less
than two accessions. The remaining 5986 SSRs showed non-reference alleles in more than two accessions among
the genome sequences of 21 spinach accessions that were retained as the set of polymorphic SSR loci. The Hip-
STR alignment of the genome sequences, in silico genotyping, and allele calling approach used in this study is
shown in Fig. 3 for tri-repeat SSR loci (ATG)6 located on chromosome 3 at 9,824,683 bp of the reference spinach
genome. The physical map showing the distribution of the 5986 polymorphic SSR loci in the spinach genome was
drawn using unique colors for each SSR motif length (Fig. 4). Detailed information of these in silico identified
5986 polymorphic SSR loci is provided in the Supplementary Table S2, which includes a physical position on the
reference genome, reference SSR motifs, repeat numbers, and primer pairs for PCR amplification. In addition,
250 bp flanking sequences on both sides of the SSR loci and the number of alleles identified following in silico
genotyping in the set of 21 spinach accessions is provided (Supplementary Table S2). Of the polymorphic loci
identified in this study, the di- and tri-repeat loci were more abundant, while the other (tetra, penta, and hexa)
were relatively lower in number (Table 2). Chromosomes 3 and 4 were the longest and harbored more SSRs, and
as expected, they contain a higher number of polymorphic SSRs. The polymorphic SSRs identified here were
evenly distributed throughout the six chromosomes, although some regions had higher densities and gaps (Fig. 4,
Table 2). A search of the physical location of all polymorphic SSRs for an overlap with the genes on the reference
genome GFF files found 36.54% of the total polymorphic SSRs were located on genic regions, and the gene name
and their predicted functions for these genic SSRs were reported (Supplementary Table S3).
Molecular validation and characterization. Thirty-six SSR loci were randomly selected from the set
of in silico identified polymorphic SSR loci and genotyped using molecular assay on a panel of 48 spinach
accessions to confirm and validate the polymorphism potential of the in silico identified SSR loci (Table 3). The
36 SSRs were distributed evenly across all six spinach chromosomes, having 1 di, 23 tri, 4 tetra, 2 penta, and 6
hexanucleotide repeats. Primers were redesigned for some loci to fit multiplexing during molecular validation.
Of the 36 SSR loci, 34 loci gave clear polymorphic band profiles among the spinach panel in this study, while
two primer pairs did not amplify (Table 3). The amplification success rate of the primer pairs used to amplify in
these accessions set was 94.4%. Importantly, all 34 polymorphic loci selected following computational genotyp-
ing achieved 100% polymorphism upon molecular validation assay in a panel of 48 Spinacia accessions. A total
of 101 alleles were scored at these 34 SSR loci ranging from 2 to 5 alleles per locus and included an average of
2.9 alleles per locus (Table 3). Expected heterozygosity or gene diversity (He) ranged from 0.24 to 0.49 with an
Scientific Reports | (2021) 11:9999 | https://doi.org/10.1038/s41598-021-89473-0 5
Vol.:(0123456789)www.nature.com/scientificreports/
Figure 2. Chromosome-wise distribution of di, tri, tetra, penta, and hexanucleotides repeat SSR loci in the
spinach genome.
average of 0.40 per locus. The polymorphic information content (PIC) of SSR markers ranged from 0.09 to 0.35
and averaged 0.25 (Table 3).
Phylogenetic and population structure analysis. The STRUCTURE software v.2.3.441 was used to
infer the population structure of the 48 spinach accessions for K = 1–10. The Structure Harvester program was
used to determine the most likely number of subpopulations that generated the highest delta K value for K = 3
and the second highest was for K = 4 (Supplementary Fig. S1), suggesting the spinach accessions used in this
study underlies genetic differentiation of three main populations. We considered reporting the three population
groups to assign the spinach accessions genotyped with the SSR markers in this study. A membership probability
cutoff (Q value) of 0.50 was used to divide the spinach panel into three (Q1, Q2, and Q3) main populations, while
the remaining accessions showing membership proportions Q < 0.5 were grouped as an admixed group (Qm).
The classification of spinach accessions into the population groups are provided in Supplementary Table S1. A
red, green, and blue color were labeled for the three subpopulations membership proportion Q1, Q2, and Q3 in
the STRUCTURE-plot (Fig. 5). The Q1 group comprised 17 accessions (35.4%), mostly the commercial spinach
cultivars and landraces from Europe and the USA. Fifteen accessions (31.3%) were clustered in the Q2 group that
comprised S. oleracea accessions from Central and Western Asia (Iran, Iraq, Turkey, and Syria). Accessions from
China, Afghanistan, Pakistan, and Greece merge in the Q2 population, although these accessions also contain a
significant ancestry proportion from the Q3 population. The Q3 group comprises 11 accessions (22.9%), includ-
ing S. oleracea landraces from South and Eastern Asian countries (Nepal, South Korea, Hong Kong, Taiwan, and
India). The S. turkestanica accessions from Turkmenistan and Uzbekistan and S. oleracea accession from the
former Soviet Union also lie in the Q3 group along with the South and East Asian accessions. In addition, a few S.
oleracea commercial cultivars (Meerkat, Lazio, and Pigeon) were also grouped in the Q3 population but shared
33–42% ancestry proportion to Q1 subpopulations. The remaining five accessions (10.4%) fell in the admixed
Qm group. Of the admixed population, S. turkestanica accession from Germany and the S. oleracea accessions
from Japan and Georgia fell in the admixed group but comprised more than 45% ancestry proportions to the Q3
subpopulation and were merged with the other Q3 accessions. On the other hand, the accessions from Ethiopia
and Belgium showed a high ancestry proportion (48 and 44%) to the Q1 group.
The genetic divergence among the accessions was further explored by performing PCA analysis in TASSEL
5.2.6544. The spinach accessions differentiated into three main clusters in the PCA plot (Fig. 6). Spinach acces-
sions assignment in the PCA corresponded well to the STRUCTURE assigned Q groups with some mismatches
Scientific Reports | (2021) 11:9999 | https://doi.org/10.1038/s41598-021-89473-0 6
Vol:.(1234567890)www.nature.com/scientificreports/
Figure 3. Genome sequences alignments of tri-repeat SSR loci chr03_3_9824683 comprised of ’ATG’ motif
repeating for six times (ATG)6 and located on chromosome 3 at 9,824,683 bp in the reference genome. Genome
sequences of multiple accessions were aligned to the reference genome and variation in the number of repeat
units for the SSR repeat motif ’ATG’ among the accessions were recorded. The reference sequence containing
SSR loci is displayed on the top row while the allele sizes of each accession are displayed on the second row and
the aligned reads of each accession are presented on succeeding rows.
and overlapping. The accessions were grouped into three major populations and were colored using the same
color code as in the STRUCTURE plot, while cyan color was used for the admixed group (Qm). The first two
principal components, PC1, and PC2 explained 10.07% and 8.24% of the overall molecular variance, and the
two PC separated the accessions into three population groups, despite some overlaps. Cluster 1 contains the Q1
accessions, cluster 2 contains Q2 accessions, cluster 3 contains Q3 accessions, and the admixed accessions are
colored with cyan color are in the center of the three clusters.
The genetic diversity in the spinach panel was analyzed using the maximum likelihood method based on the
Tamura–Nei model45 in MEGA 746. The phylogenetic analysis of 48 spinach accessions with the newly developed
genome-wide 34 SSR markers showed three separate spinach accession clusters with some overlaps (Fig. 7).
Scientific Reports | (2021) 11:9999 | https://doi.org/10.1038/s41598-021-89473-0 7
Vol.:(0123456789)www.nature.com/scientificreports/
Figure 4. Physical map location and distribution of in silico identified SSR markers from the genome sequence
of spinach cultivar Sp75.
The same set of red, green, blue, and cyan colors was used to indicate Q1, Q2, Q3, and Qm groups as used for
accessions in the MEGA and PCA analysis. The accessions from South and East Asia (Q3 group) form a separate
cluster, close to the West Asian accessions, and were distant from the European and United States accessions and
the differential cultivars. The S. turkestanica accessions from Turkmenistan and Uzbekistan grouped with the
accession from West Asian countries Greece, Syria, Turkey, Afghanistan, and Iran in the Q2 cluster, alough these
two accessions were grouped closer with the Q3 accessions in STRUCTURE and PCA plots. In contrast, the S.
turkestanica accession from Germany grouped with accession from Georgia and differential cultivar Viroflay in
the Q1 cluster, and this accessions was in the admixed group in all three analysis.
Overall, the diversity analysis indicates three well-differentiated populations in the worldwide spinach panel,
and the accessions were consistent in the neighbor-joining tree, STRUCTURE, and PCA results despite some
overlaps and mismatches (Figs. 5, 6, 7). Compared to the STRUCTURE result, the accessions were more clearly
visualized and differentiated in the NJ tree and PCA plots. Genetic grouping of spinach accessions based on SSR
markers corresponded well with their geographical origin, domestication history, and pedigree. And the genetic
clustering of accessions was similar to previous genetic diversity s tudies26,47.
Scientific Reports | (2021) 11:9999 | https://doi.org/10.1038/s41598-021-89473-0 8
Vol:.(1234567890)www.nature.com/scientificreports/
SN Marker namea Repeat motif Forward primerb Reverse primer Product size Tm (°C) Na He PIC
a CTACAATGGAAC TAGTTCAGGCTA
1 chr01_3_3996646 (ACA)11 114 59 4 0.42 0.31
CACCCTAGC TCAGCTCCAA
TCCTCTCTCCAT CCCCAACTCTTC
2 chr05_3_22933154 (ACA)23 173 60 5 0.41 0.30
TTGCAACC TTGTCAGC
CGAGCTGTGAAG GAATTTGTGTTT
3 chr03_4_53804930a (TTGT)7 213 59 2 0.49 0.25
GTATTTCTTG TGCGCTTC
TTCCGGTGTTCT TTCCTTTCATTG
4 chr04_5_76909578 (CAGGC)4 272 59 – – –
GAAACTACA TTGCTTGG
ACAGCACAAGCC GTGGTACTGGCG
5 chr06_6_22506385 (AGGCAA)6 307 60 3 0.33 0.28
ACAAAATG GTAGTGCT
AACAAATTCGCA AAGATGTTGGCC
6 chr04_3_112691959 (ACA)13 399 60 3 0.38 0.27
CCACATCA GACGATAG
GAAAACTTCGCG CATTTCCGAGTG
7 chr03_3_99679126a (TTG)10 122 59 3 0.45 0.32
TTACAATGAG ATCTTGAGC
GAGCTTAACAAC GGAATTTTGGGT
8 chr06_2_37161425 (GA)8 185 60 2 0.48 0.24
CGAGCTTGA TGACGTGT
AGCCTATACACA CTTCTAGGTCCG
9 chr06_3_40415854a (TCA)10 221 60 3 0.26 0.22
CTCCTCTCGG GTTTCCATC
ATCCCAGCAGTA AACAGCTTCCTT
10 chr02_3_30545229 (AGA)10 292 59 3 0.39 0.27
AACCAACC GCTTGCAT
AGAAACAAAGGC CAGATATCGGAA
11 chr04_3_54423372 (ACC)5 340 59 2 0.44 0.18
GAGGTACG TCGCAAGA
GGCTCACCATTT ATTGGAAGCATG
12 chr02_3_41041559 (TCA)13 389 60 3 0.47 0.27
TGGTCATT CAAGGAGT
TTAGCAAACACC GAACACCAAATG
13 chr02_5_18463938a (AGGGA)4 126 60 2 0.24 0.12
AAAAATTGGA TTGCATGG
AAACCACATACA TACACCACACAG
14 chr02_6_52639756 (AGAGAA)4 187 60 3 0.47 0.30
GGGCCTCA CGTCCACT
TTAAGTCAGAAA TCTTCCATCATT
15 chr05_3_55104642a (GAG)6 225 60 2 0.46 0.21
CCTTCCCCTG TACGCCAAG
ACCCAATAAAAC CCAAGCTGTCAC
16 chr03_6_29450333 (CAAATT)4 276 60 2 0.45 0.24
AGCGATGC AAAACACG
AGCTAAACTCCG AGAAGGGAG
17 chr02_3_60571150 (AAC)11 313 60 3 0.44 0.23
TGGCACAT TGGAGGGAGAG
ATGTTGGCCTGA CGTGAGCAACTG
18 chr05_3_32205256 (ATC)9 388 61 2 0.34 0.22
TCCATTGT ATGGGAAT
CCATGAGGAACA CCATCTCACAGA
19 chr03_3_9824683a (ATG)6 108 60 2 0.36 0.13
ACACTAGCAA CAATCTCACAG
AGGTGGAGA
GGTTCATGTAGC
20 chr01_3_47220474 (TTG)7 ACAAGGAAA 189 59 3 0.36 0.27
CGACCCTA
GAA
TGATACCAATAC GGTGTTAAAGGA
21 chr06_3_17100717a (TCT)7 241 59 2 0.41 0.18
CTGCACACAA CCCGTTTTC
AAGCTTCCATCT AAAGTCGCTTGC
22 chr04_3_42840013 (GCA)9 293 60 – – –
TTGGCTCA AGTCGTTT
CTTGCCTCCAAT TGTGAGAGTCGG
23 chr03_3_75066435 (AGA)17 339 59 2 0.41 0.30
TTGCATTT AGAATCCTT
CCTACCACTTTC GTGTAAACAGAA
24 chr03_3_20380054a (TTC)11 391 59 3 0.42 0.32
ATCTCATCCA CCACCCATGA
ATGAAGGCAAGA CTCAACCACGAC
25 chr05_3_1063291a (TCA)17 135 60 4 0.36 0.23
TTTCGGTACT ATGAACCTTA
CCTCATCATTGT ACTGCCGAGAAC
26 chr04_3_31208653a (CAG)10 173 60 4 0.46 0.32
CCTCATCAAG TGCATAAACT
CAAAATGGAAAC CACAGAACAACC
27 chr03_3_295631a (GAA)9 216 60 3 0.36 0.27
CCCAACAA CAAACTCAAA
GGTTTCATCAAT CCAGGTTCAAAA
28 chr05_4_64332729a (TGTA)9 257 60 5 0.41 0.35
CTTCCTGCAT TGCTCCATA
CCACAAACTGCC AACCATGGCTCA
29 chr06_3_44057430 (CCA)6 304 60 2 0.39 0.14
CTAAATGG TGTTGATG
AAAG
GGC AGA
GA TCATGCTGAAGT
30 chr01_4_18090562a (TATC)6 350 60 2 0.35 0.09
GAAGAAAGATG GACCGAAC
AACCAAAAGGCA TTTTGAACAACC
31 chr01_6_26485152a (CAACAG)4 135 59 4 0.42 0.29
ACAAAAATG CCGATAGC
TGGTGGCTGGTC CTAACAGAAGCA
32 chr05_6_42561823a (CTGCTA)5 175 60 3 0.40 0.26
ATAAGTATTG GCAGCAGAAG
GTTGAAGACGCT CCCCTTCGCAAT
33 chr01_6_42933346a (GGTGTG)5 238 60 4 0.40 0.31
GTAGTTCGG ACTCCTTAAT
CCAATGCAAGGG TCTCAGCCATCT
34 chr01_4_37404206a (ATGT)8 290 60 3 0.35 0.24
TAACACAAT GTTGATCTGTA
Continued
Scientific Reports | (2021) 11:9999 | https://doi.org/10.1038/s41598-021-89473-0 9
Vol.:(0123456789)www.nature.com/scientificreports/
SN Marker namea Repeat motif Forward primerb Reverse primer Product size Tm (°C) Na He PIC
ATCTCGTGCCAA TTGATCAGAGGA
35 chr04_3_5365603 (TTC)9 245 59 4 0.40 0.35
CCATAACC CAAAGAAAGC
ACCCCATTTCTT TTAAGATCAACC
36 chr06_3_4451765a (AGG)7 380 60 4 0.34 0.29
CCCTCTTTT AACGCCTTCT
Mean 2.97 0.40 0.25
Table 3. Repeat motifs, primer sequences, annealing temperatures, and characteristics of 36 simple sequence
repeat (SSR) markers in the 48 diverse spinach accessions. Na number of alleles, He expected heterozygosity
calculated in GenAlEx 6.5, PIC polymorphism information content calculated in PowerMarker v3.25. a Primers
were redeisgend for these SSR markers. b The M13 (CACGACGTTGTAAAACGAC) tail sequences at the 5′ end
of each primers were added, and M13 tailed forward primers used used.
Figure 5. Population structure analysis classified 48 spinach accessions into three population groups based
on delta K analysis. The distribution of spinach accessions to the three population clusters Q1, Q2, and Q3 was
colored red, green, and blue. The accession name and country of origin are denoted on the x-axis, while the
y-axis represents the membership proportion of accession to different population groups.
Discussion
The advancement of sequencing technologies and the availability of genome sequences for many commercial and
specialty crops have eased the discovery of SSR markers in the previous decade. Previously SSR markers were dis-
covered from the sequencing of genomic libraries enriched for SSRs and were not efficient in terms of cost, time,
and technical resources8,48,49. The availability of genomic and transcriptomic sequences has increased the rate
and efficiency of developing SSR markers, and SSRs have been developed in the model, non-model, and orphan
crops50–52. However, many of the recent SSR development studies, particularly using the whole-genome and
transcriptome sequences, tested a small number (generally between 20 and 100) of randomly selected SSR loci to
report a few useful polymorphic markers. The challenge remained in screening and identifying polymorphic loci
with variable repeat length across the panel. Here, we present a new approach to discovering polymorphic SSR
markers by aligning and comparing the genome sequences of multiple accessions against the reference genome
to count and genotype SSR loci variation in repeat length. A subset of computationally identified polymorphic
SSR loci using the HipSTR program32 was validated in a set of 48 diverse spinach germplasm accessions to
confirm polymorphism in PCR based molecular assay. The availability of reference genome of spinach and the
genome sequences of several accessions with an average depth of 30× have enabled us to discover thousands of
polymorphic loci rapidly. This study efficiently discovered a large set of genome-wide SSR markers with known
physical map locations across the six spinach chromosome.
The SSR distribution in the Sp75 genome was previously reported20 and is not described in detail here. This
study aimed to generate a large set of polymorphic SSR loci to extend their use in future genetic studies in spin-
ach. Initially, primer pairs were only designed for 35,567 loci, while primers were not designed for 6588 SSR loci
due to lack of flanking sequences and missing sequences in the template sequences to design primers (Table 2).
The mononucleotides are error-prone in scoring and were not pursued in this study, while the dinucleotide
repeats are high in s tuttering53,54. In contrast, the tri and higher nucleotide containing motif are easy to score
as are less prone to amplification errors and stuttering, although the higher repeat SSRs were present in a low
frequency in spinach. Hence, the SSRs with higher repeat numbers (tri, tetra, penta, and hexa) are recommended
for future genetic studies.
Scientific Reports | (2021) 11:9999 | https://doi.org/10.1038/s41598-021-89473-0 10
Vol:.(1234567890)www.nature.com/scientificreports/
Figure 6. The principal component analysis (PCA) plot for 48 spinach accessions using 34 SSR marker data.
The same color code was used for accessions belonging to Q1, Q2, and Q3, and cyan color for the admixed
(Qm) population. The S. oleracea and S. turkestanica species are designated with circle and star shapes.
Forty-eight spinach accessions from two Spinacia species, S. oleracea and S. turkestanica, were used to confirm
the polymorphism potential of the computationally identified polymorphic SSR markers using the molecular
genotyping assay. The two primer pairs do not amplify in the spinach panel and most likely because of the
addition of the M16 tail that interfered with amplification by producing secondary structures and changes in
annealing temperatures. Genotype results from the molecular assay for the remaining SSR loci completely cor-
responded to the computation generated genotype profile as all 34 markers showed two or more bands across
the panel. Identification of 100% of polymorphic loci from a random test of 34 computationally screened SSR
loci is a promising approach to identify polymorphic SSR loci for the organism with available genome sequences.
The result indicates most of the in silico derived SSRs reported in this study are truly polymorphic. Primer
sequences were designed for all 5986 SSR loci, and flanking sequences for all loci have been provided (Supple-
mentary Table S2). The flanking sequences can be used to redesign primers with different product sizes to fit in
the multiplex runs. The two primer pairs do not amplify in this study but could be amplified with different sets
of primers but were not tested here. The majority of the polymorphic SSRs reported here were positioned in the
intergenic regions, with 36.54% distributed in the gene regions (Supplementary Table S3) even though a lower
proportion of SSRs are known to reside in the gene region, as reported in other organisms55,56. Comparable to
our report, 29–30% of the SSR markers developed from the genome sequences in carrot and hazelnut belong
to the transcribed regions12,57. Also, the tri and hexa repeat loci have been more prevalent in the transcribed
regions, and those two motifs comprise 49% of total SSRs in this study, apparently leading to high genic SSRs.
The high percentage of genic markers plus the gene and gene functions reported here may help in breeding and
physiological studies. A large set of SSR markers identified in this study will support genetic, genomic studies in
spinach, mainly in fingerprinting, genetic diversity analysis, marker-trait linkage and association analysis, and
molecular breeding. This approach of discovering polymorphic SSR markers is resource-efficient both in terms
of time and cost. On top of that, the method reported in this study is transferable to other species with available
genome sequences and resequences data.
The relatively lower number of alleles (range of 2–5 with an average of 2.9 alleles/locus) reported in this study
is due to a careful and strict allele scoring employed here. The average PIC value of the markers in this study was
0.25, which is slightly lower than the previous report in spinach (average PIC 0.43)20 and is explained by the low
Scientific Reports | (2021) 11:9999 | https://doi.org/10.1038/s41598-021-89473-0 11
Vol.:(0123456789)www.nature.com/scientificreports/
Figure 7. The maximum likelihood Neighbor-joining tree of 48 spinach accessions drawn in MEGA. The
accessions color codes are consistent with the PCA and STRUCTURE-plot.
number of alleles reported in this study. The use of fluorescently labeled primers in the multiplex set and fragment
analysis in capillary electrophoresis can increase allele calling at high precision with clearer results and eliminate
the difficulties with scoring bands in the agarose and polyacrylamide gel electrophoresis method. Hence, we
expect and recommend using semi-throughput capillary electrophoresis methods for fragment sizing to generate
clearer allele sizes and record a higher number of alleles. The number of alleles genotyped by the HipSTR program
Scientific Reports | (2021) 11:9999 | https://doi.org/10.1038/s41598-021-89473-0 12
Vol:.(1234567890)www.nature.com/scientificreports/
among the genome sequences of 21 accessions and the reference genome is provided (Supplementary Table S2),
giving us an idea of the expected number of alleles while designing future experiments to use these markers.
Fingerprint data generated from PCR genotyping was used to assess the genetic diversity and population
structure of the spinach accessions. The population structure and phylogeny assignment performed with allele
scores of 34 SSR markers in this study distinguished the worldwide spinach germplasm accessions and the popu-
lation group assignments were consistent with previous r eports26,47. The accessions were subdivided into three
main populations based on STRUCTURE analysis, and the phylogenetic analysis in MEGA and PCA analysis in
TASSEL supports the three genetic clusters. The clusters generated by structure analysis, neighbor-joining analy-
sis, and PCA were similar. The accessions assigned to the population group largely correspond to the geographical
origin for most accessions, with a few mismatches and overlaps. Few differential cultivars (Meerkat, Lazio, and
Pigeon) were assigned to the Q3 group along with the Southern and East Asian accessions in Structure analysis.
However, the differentials were merged with the Q1 group in PCA and phylogenetic analysis. Germplasm from
Pakistan and Afghanistan were grouped with the Q2 population (Central and Western Asia) further away from
India and Nepal (Q3 population). But a recent diversity analysis study26 generated similar results where the
South Asian accessions formed multiple clusters, and some were close to accessions from Western Asia. The
phylogenetic trees clustered the two S. turkestanica accession from Turkmenistan and Uzbekistan together with
the S. oleracea accessions from South and West Asian countries Afghanistan, Pakistan, Greece, and Turkey. The
S. tetrandra and S. turkestanica are the wild relatives of cultivated spinach S. oleracea. Previous studies reported
S. turkestanica was genetically close to cultivated S. oleracea26,27. Successful amplification of accessions belonging
to two Spinacia species (S. turkestanica and S. oleracea) by the same primers and the accessions from two species
lying together in the phylogenetic analysis in this study further supports the hypothesis that S. turkestanica is
the recent ancestor of S. oleracea.
Efforts to identify genes for major traits are prioritized in spinach. Regardless of the reduced cost of whole-
genome sequencing and reduced representation sequencing (GBS and RADseq), genotyping small sets of SSR
markers are economical and easy to manage58 and are helpful to make the framework genetic studies. Downy mil-
dew is the most important disease that devastated all major spinach production areas, specifically the California
valleys, the major spinach production area in the United States. Previous genetic mapping efforts have attempted
to map the trait locus but have been limited with the availability of a dense set of molecular markers resulting in a
lower resolution of the trait locus. The availability of physically mapped markers can help expedite fine-mapping
research and studying the genetic control of the trait at a finer resolution. Abundant SSRs identified in this study
may be used in the beginning to map the targeted trait locus via association or QTL mapping, followed by SNP
markers to narrow the locus interval. For fine mapping and in-depth analysis, targeted sequencing methods as
amplicon sequencing59,60 and hybridization-target enrichment61,62 can be employed to generate sequence data of
targeted regions at high coverage to gain insights on the genetic basis of trait control. Markers including SSRs in
the proximal end of spinach chromosome 3 are promising as the known downy mildew resistance locus (known
as RPF) maps in the region. The RPF loci have been mapped to the 0.3–1.3 Mb region of chromosome 363–66.
These new SSR markers may also help develop near isogenic lines (NIL) to track the resistance gene introgressed
region of the recurrent susceptible lines. Furthermore, the genome of some races of spinach downy mildew
pathogen (Peronospora effusa race 1, 12, 13, 14) has been sequenced67–69. These sequences could be searched to
identify the set of SSRs varying among the races, identify a genome-wide fingerprint and diagnostic sets of SSR
loci, and identify SSRs involved on and/or associated with virulence-pathogenic loci. Such SSR panels could be
used routinely in functional diversity analysis and marker profile highly variant and continually emerging new
pathogen races. The same approach could be extended for other diseases in spinach and examine and understand
host–pathogen interactions in other crops. Furthermore, a new genome sequence assembly (https://phytozome-
next.jgi.doe.gov/info/Soleracea_Spov3) is available in spinach, and additional 480 USDA accessions, breeding
lines, and commercial cultivars are resequenced at 10× genome c overage70. These new sequences generated for
spinach will facilitate the identification of more SSR loci and map them across longer chromosome lengths.
Conclusions
This study utilized the available reference spinach genome sequences to mine SSR loci along with the genome
sequences of additional accessions to develop a large set of polymorphic SSR markers following computational
screening for the variation in the number of repeat units among the accessions. Substantiate polymorphism
observed following molecular validation of randomly selected SSR loci demonstrated our strategy to identify new
polymorphic SSR markers. The development of a large set of polymorphic SSR markers in this study will sup-
port genetic research in spinach, especially for the labs with limited resources. A dense set of relatively easy and
inexpensive to use SSR markers reported in this study may facilitate fingerprinting, genetic diversity, phylogeny
assignment, population structure analysis, and mapping and molecular breeding effort in spinach. Notably, the
polymorphic SSR markers can be employed to investigate genetic diversity and population structure among the
wild and cultivated spinach accessions and to identify duplicates and generate a core set of diverse accessions.
Indeed, these markers can be equally valuable for breeding applications to investigate and map the major and
minor traits. Most importantly, our approach of identifying polymorphic SSRs will expedite the development
of useful markers with the known physical location and avoids laborious preliminary molecular screening for
polymorphism.
Data availability
Data generated in this study are available in the main table, figures, and additional files.
Scientific Reports | (2021) 11:9999 | https://doi.org/10.1038/s41598-021-89473-0 13
Vol.:(0123456789)www.nature.com/scientificreports/
Received: 13 December 2020; Accepted: 13 April 2021
References
1. Morelock, T. E. & Correll, J. C. Spinach. In Vegetables I 189–218 (Springer, 2007). https://doi.org/10.1007/978-0-387-30443-4_6.
2. Cao, G., Sofic, E. & Prior, R. L. Antioxidant capacity of tea and common vegetables. J. Agric. Food Chem. 44, 3426–3431 (1996).
3. Howard, L. R., Pandjaitan, N., Morelock, T. & Gil, M. I. Antioxidant capacity and phenolic content of spinach as affected by genetics
and growing season. J. Agric. Food Chem. 50, 5891–5896 (2002).
4. USDA-NASS. Vegetables 2018 summary. United States Department of Agriculture National Agricultural Statistics Service, Wahington,
DC. https://www.nass.usda.gov/(2019).
5. Zhao, J. et al. Genetic variation and association mapping of seed-related traits in cultivated peanut (Arachis hypogaea L.) using
single-locus simple sequence repeat markers. Front. Plant Sci. 8, 20 (2017).
6. Gyawali, S. et al. Microsatellite markers used for genome-wide association mapping of partial resistance to Sclerotinia sclerotiorum
in a world collection of Brassica napus. Mol. Breed. 36, 20 (2016).
7. Sugita, T. et al. Development of simple sequence repeat markers and construction of a high-density linkage map of Capsicum
annuum. Mol. Breed. 31, 909–920 (2013).
8. Zalapa, J. E. et al. Using next-generation sequencing approaches to isolate simple sequence repeat (SSR) loci in the plant sciences.
Am. J. Bot. 99, 193–208 (2012).
9. Biswas, M. K. et al. Transcriptome wide SSR discovery cross-taxa transferability and development of marker database for studying
genetic diversity population structure of Lilium species. Sci. Rep. 10, 20 (2020).
10. Cheng, J. et al. A comprehensive characterization of simple sequence repeats in pepper genomes provides valuable resources for
marker development in Capsicum. Sci. Rep. 6, 20 (2016).
11. Kalyana Babu, B. et al. Development and validation of whole genome-wide and genic microsatellite markers in oil palm (Elaeis
guineensis Jacq.): First microsatellite database (OpSatdb). Sci. Rep. 9, 20 (2019).
12. Bhattarai, G. & Mehlenbacher, S. A. In silico development and characterization of tri-nucleotide simple sequence repeat markers
in hazelnut (Corylus avellana L.). PLoS One 12, 0178061 (2017).
13. Engelbrecht, J., Duong, T. A. & Berg, N. V. D. New microsatellite markers for population studies of Phytophthora cinnamomi, an
important global pathogen. Sci. Rep. 7, 10 (2017).
14. Parada-Rojas, C. H. & Quesada-Ocampo, L. M. Analysis of microsatellites from transcriptome sequences of Phytophthora capsici
and applications for population studies. Sci. Rep. 8, 20 (2018).
15. Cai, G., Fleury, T. J. & Zhang, N. Comparative genomics approach to build a genome-wide database of high-quality, informative
microsatellite markers: Application on Phytophthora sojae, a soybean pathogen. Sci. Rep. 9, 20 (2019).
16. Khattak, J. Z. K., Christiansen, J. L., Torp, A. M. & Andersen, S. B. Genic microsatellite markers for discrimination of spinach
cultivars. Plant Breed. 126, 454–456 (2007).
17. Kuwahara, K., Suzuki, R., Ito, Y., Mikami, T. & Onodera, Y. An analysis of genetic differentiation and geographical variation of
spinach germplasm using SSR markers. Plant Genet. Resour. Character. Util. 12, 185–190 (2014).
18. Feng, C., Bluhm, B. H. & Correll, J. C. Construction of a spinach bacterial artificial chromosome (BAC) library as a resource for
gene identification and marker development. Plant Mol. Biol. Rep. 33, 1996–2005 (2015).
19. Göl, Ş, Göktay, M., Allmer, J., Doğanlar, S. & Frary, A. Newly developed SSR markers reveal genetic diversity and geographical
clustering in spinach (Spinacia oleracea). Mol. Genet. Genom. 292, 847–855 (2017).
20. Li, S. F., Wang, B. X., Guo, Y. J., Deng, C. L. & Gao, W. J. Genome-wide characterization of microsatellites and genetic diversity
assessment of spinach in the chinese germplasm collection. Breed. Sci. 68, 455–464 (2018).
21. Rubatzky, V. E., Yamaguchi, M., Rubatzky, V. E. & Yamaguchi, M. Spinach, table beets, and other vegetable chenopods. World Veg.
https://doi.org/10.1007/978-1-4615-6015-9_21 (1997).
22. Ribera, A., Bai, Y., Wolters, A. M. A., van Treuren, R. & Kik, C. A review on the genetic resources, domestication and breeding
history of spinach (Spinacia oleracea L.). Euphytica 216, 20 (2020).
23. Andersen, S. B. & Torp, A. M. Spinacia. Wild Crop Relat. Genom. Breed. Resour. https://doi.org/10.1007/978-3-642-20450-0_13
(2011).
24. van Treuren, R. et al. Acquisition and regeneration of Spinacia turkestanica Iljin and S. tetrandra Steven ex M. Bieb. to improve a
spinach gene bank collection. Genet. Resour. Crop Evol. 67, 549–559 (2020).
25. Sneep, J. The domestication of spinach and the breeding history of its varieties. Euphytica Suppl. 2, 1–27 (1983).
26. Ribera, A., van Treuren, R., Kik, C., Bai, Y. & Wolters, A. M. A. On the origin and dispersal of cultivated spinach (Spinacia oleracea
L.). Genet. Resour. Crop Evol. https://doi.org/10.1007/s10722-020-01042-y (2020).
27. Xu, C. et al. Draft genome of spinach and transcriptome diversity of 120 Spinacia accessions. Nat. Commun. 8, 20 (2017).
28. Riangwong, K. et al. Mining and validation of novel genotyping-by-sequencing (GBS)-based simple sequence repeats (SSRs) and
their application for the estimation of the genetic diversity and population structure of coconuts (Cocos nucifera L.) in Thailand.
Hortic. Res. 7, 20 (2020).
29. Gymrek, M., Golan, D., Rosset, S. & Erlich, Y. lobSTR: A short tandem repeat profiler for personal genomes. Genome Res. 22,
1154–1162 (2012).
30. Highnam, G. et al. Accurate human microsatellite genotypes from high-throughput resequencing data using informed error
profiles. Nucleic Acids Res. 41, 20 (2013).
31. Cao, M. D. et al. Inferring short tandem repeat variation from paired-end short reads. Nucleic Acids Res. 42, 20 (2014).
32. Willems, T. et al. Genome-wide profiling of heritable and de novo STR variations. Nat. Methods 14, 590–592 (2017).
33. Wang, X. & Wang, L. GMATA: An integrated software package for genome-scale SSR mining, marker development and viewing.
Front. Plant Sci. 7, 20 (2016).
34. Li, H. Aligning sequence reads, clone sequences and assembly contigs with BWA-MEM. arXiv Prepr. arXiv (2013).
35. Li, H. et al. The sequence alignment/map format and SAMtools. Bioinformatics 25, 2078–2079 (2009).
36. Untergasser, A. et al. Primer3-new capabilities and interfaces. Nucleic Acids Res. 40, 20 (2012).
37. da Silva, J. A. G. et al. Agronomic and molecular characterization of wild germplasm Saccharum spontaneum for sugarcane and
energycane breeding purposes. Sci. Agric. 75, 329–338 (2018).
38. Schuelke, M. An economic method for the fluorescent labeling of PCR fragments. Nat. Biotechnol. 18, 233–234 (2000).
39. Peakall, R. & Smouse, P. E. GenALEx 6.5: Genetic analysis in Excel. Population genetic software for teaching and research-an
update. Bioinformatics 28, 2537–2539 (2012).
40. Liu, K. & Muse, S. V. PowerMarker: An integrated analysis environment for genetic marker analysis. Bioinformatics 21, 2128–2129
(2005).
41. Pritchard, J. K., Stephens, M. & Donnelly, P. Inference of population structure using multilocus genotype data. Genetics 155,
945–959 (2000).
42. Evanno, G., Regnaut, S. & Goudet, J. Detecting the number of clusters of individuals using the software STRUCTURE: A simula-
tion study. Mol. Ecol. 14, 2611–2620 (2005).
Scientific Reports | (2021) 11:9999 | https://doi.org/10.1038/s41598-021-89473-0 14
Vol:.(1234567890)You can also read