H1 2021 results and Group strategic update - for the six months ended 30 June 2021 26 August 2021 - The Vault
←
→
Page content transcription
If your browser does not render page correctly, please read the page content below
H1 2021 results and Group strategic update
for the six months ended 30 June 2021
26 August 2021

H1 2021 results &
Group strategic
update

26 August 2021
Disclaimer
The information in this announcement may contain forward-looking statements within the meaning of the “safe harbour” provisions of the United States Private Securities Litigation
Reform Act of 1995. These forward-looking statements, including, among others, those relating to Sibanye Stillwater Limited’s (“Sibanye-Stillwater” or the “Group”) financial
positions, business strategies, plans and objectives of management for future operations, are necessarily estimates reflecting the best judgment of the senior management and
directors of Sibanye-Stillwater.
All statements other than statements of historical facts included in this announcement may be forward-looking statements. Forward-looking statements also often use words such
as “will”, “forecast”, “potential”, “estimate”, “expect” and words of similar meaning. By their nature, forward-looking statements involve risk and uncertainty because they relate to
future events and circumstances and should be considered in light of various important factors, including those set forth in this disclaimer. Readers are cautioned not to place
undue reliance on such statements.
The important factors that could cause Sibanye-Stillwater’s actual results, performance or achievements to differ materially from those in the forward-looking statements include,
among others, our future business prospects; financial positions; debt position and our ability to reduce debt leverage; business, political and social conditions in the United States,
South Africa, Zimbabwe and elsewhere; plans and objectives of management for future operations; our ability to obtain the benefits of any streaming arrangements or pipeline
financing; our ability to service our bond instruments; changes in assumptions underlying Sibanye-Stillwater’s estimation of their current mineral reserves and resources; the ability to
achieve anticipated efficiencies and other cost savings in connection with past, ongoing and future acquisitions, as well as at existing operations; our ability to achieve steady
state production at the Blitz project; the success of Sibanye-Stillwater’s business strategy; exploration and development activities; the ability of Sibanye-Stillwater to comply with
requirements that they operate in a sustainable manner; changes in the market price of gold, PGMs and/or uranium; the occurrence of hazards associated with underground and
surface gold, PGMs and uranium mining; the occurrence of labour disruptions and industrial action; the availability, terms and deployment of capital or credit; changes in relevant
government regulations, particularly environmental, tax, health and safety regulations and new legislation affecting water, mining, mineral rights and business ownership, including
any interpretations thereof which may be subject to dispute; the outcome and consequence of any potential or pending litigation or regulatory proceedings or other
environmental, health and safety issues; power disruptions, constraints and cost increases; supply chain shortages and increases in the price of production inputs; fluctuations in
exchange rates, currency devaluations, inflation and other macro-economic monetary policies; the occurrence of temporary stoppages of mines for safety incidents and
unplanned maintenance; the ability to hire and retain senior management or sufficient technically skilled employees, as well as their ability to achieve sufficient representation of
historically disadvantaged South Africans in management positions; failure of information technology and communications systems; the adequacy of insurance coverage;
any social unrest, sickness or natural or man-made disaster at informal settlements in the vicinity of some of Sibanye-Stillwater’s operations; and the impact of HIV, tuberculosis
and the spread of other contagious diseases, such as coronavirus (“COVID-19”). Further details of potential risks and uncertainties affecting Sibanye-Stillwater are described in
Sibanye-Stillwater’s filings with the Johannesburg Stock Exchange and the United States Securities and Exchange Commission, including the Integrated Annual Report and the
Annual Report on Form 20-F.
These forward-looking statements speak only as of the date of the content. Sibanye-Stillwater expressly disclaims any obligation or undertaking to update or revise any forward-
looking statement (except to the extent legally required).

                                                                                                                                                                                       2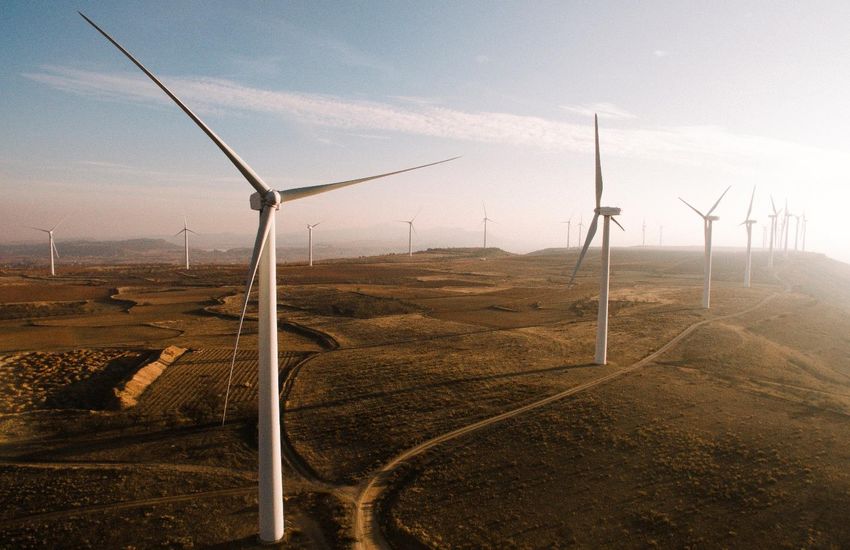
Key highlights |H1 2021

       Safe & healthy workforce                   • Implemented strategies to address safe production regression with tangible improvements evident
                                                  • Covid-19 vaccination roll-out progressing well

       Embedding ESG excellence                   • Developed a comprehensive Sustainability strategy that addresses our ESG focus areas
                                                  • Progressing net carbon zero 2040 strategy with renewable energy projects

                                                  • SA PGM delivering consistent, exceptional results, positive momentum from US PGM and SA gold
       Operational excellence                       post safety related stoppages

                                                  • Record adj. EBITDA of R40.5bn (US$2.8bn)
       Exceptional financial results              • Record adj. free cash flow of R17.3bn (US$1.19bn)

                                                  •   2022 bonds redeemed in August 2021
        Disciplined capital allocation            •   Interim dividend declared of 292 SA cents/77.21 US cents per ADR resulting in a 9.7% dividend yield
                                                  •    5% share buyback in progress – 1.92% (or >R3.4bn/56.6m shares) to date bought back*
                                                  •    Robust balance sheet with Net cash of R10.2bn (US$712m)

       Precious metals markets                    • Strong long-term PGM fundamentals with short term volatility
                                                  • Gold market stable outlook

       Battery metals growth &                    • First steps in battery metals strategy with Keliber Lithium hydroxide project and Sandouville Nickel facility
                                                    providing key access to European BEV sector
       strategy evolves                           • Green metals strategy developed which is advancing together with battery metals

Strategic delivery
*As at 23 August 2021
# At 24 August 2021 SSW closing price of R59.66                                                                                                                 3
Diversification and growth underpins record earnings & cash flow

                                     Earnings¹ %                                                                                                                           Production %

                                 3,000                                                                                             3                                                                  13%
                                           2.6          2.5                                                                                                                 22%
                                                                       2.4
                                 2,500

                                                                                                                                         Net debt: adjusted EBITDA ratio
 Adjusted EBITDA (US$ million)

                                                                                                                                   2
                                 2,000                                              1.3
                                                                                                                                                                                                                  17%
                                 1,500
                                                                                                                                   1                                                     H1 2021
                                 1,000                                                           0.55

                                  500
                                                                                                                                   0
                                                                                                               (0.06)
                                    0                                                                                    (0.14x)
                                                                                                                        net cash
                                 (500)                                                                                             (1)                                             48%
                                           H1           H2*            H1*           H2           H1            H2      H1
                                                 2018                        2019                       2020            2021

                                 SA gold     SA PGM           US PGM         Net debt (cash): adjusted EBITDA (rhs)                                                        US PGM (2E)             PGM recycling (3E)
                                                                                                                                                                           SA PGM (6E)             SA gold (oz)

From single commodity to multi-commodity with 94% of current earnings being generated from recent acquisitions
Source: Company results information
* H2 2018 and H1 2019 at the SA gold operations have been impacted by the five month gold strike from Nov 2018 to April 2019 with subsequent gradual build up to new normalised levels
1. The Group reports adjusted earnings before interest, taxes, depreciation and amortisation (EBITDA) based on the formula included in the facility agreements for compliance with the debt covenant
   formula. For a reconciliation of profit/loss before royalties and tax to adjusted EBITDA, see note 10.2 of the condensed consolidated interim financial statements in the H1 2021 results booklet                    4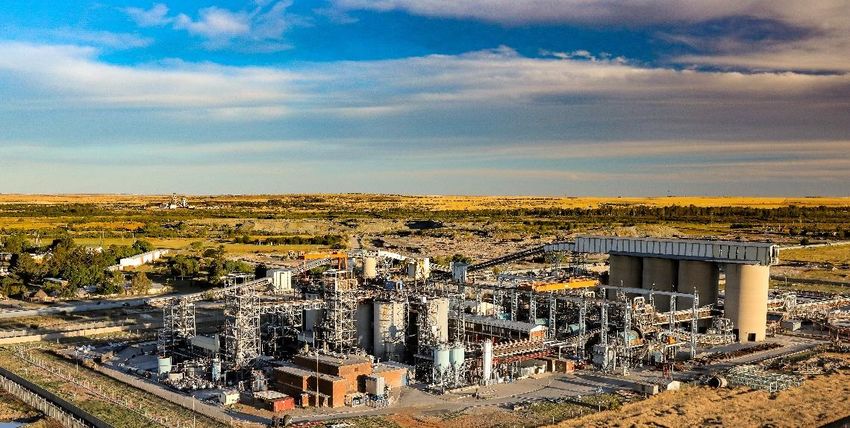
Operational and financial results
Large, diversified production base underpins record earnings
Safe production - addressing behavioural issues and real risk reduction

• Culture transformation through Values based decision making is a key strategic thrust, in addition to real risk reduction

• “Rules of life” awareness campaign rolled out to underpin and strengthen the existing Zero harm safety framework

• Improving trends coming through for Q3 2021 to date

Working towards our goal of zero harm

                                                                                                                              6
SA PGM operations – stellar performance

                     SA PGM operations – Underground and surface production and AISC                                                        • 42% higher 4E PGM production at 894,165 4Eoz

             1,200                                                                                                    60,000                • AISC well controlled – 10% reduction year on year at
                                                                                                                                              R16,921/4E oz (US$1,163/4E oz)
                                                                                                                      50,000                • 61% higher 4E PGM basket price at R53,629/4E oz
              900                                                                                                                           • R14bn/US$983m adj. FCF for H1 2021
                                                                                                                      40,000
                                                                                                                                            • 66% adjusted EBITDA margin for H1 2021
4E PGM koz

                                                                                                                               R/4E oz
              600                                                                                                     30,000                • Marikana operations successfully integrated with
                                                                                                                                              13% cost reductions realized despite lower volumes
                                                                                                                      20,000
                                                                                                                                              from shaft closures and 2 years of inflation
              300                                                                                                                           • Value benefits from processing capacity with third
                                                                                                                      10,000                  party processing increased to 34,827 4Eoz

                0                                                                                                     0
                      H1 2018     H2 2018      H1 2019       H2 2019       H1 2020        H2 2020       H1 2021

                         Surface production (4E)                       Underground (UG) production (4E)
                         R/4E oz average basket price (rhs)            All-in sustaining cost (rhs)

      Consistent operational performance leveraging higher 4E PGM rand basket price
      Source: Company results information
      1. The Group reports adjusted earnings before interest, taxes, depreciation and amortisation (EBITDA) based on the formula included in the facility agreements for compliance with the debt covenant
         formula. For a reconciliation of profit/loss before royalties and tax to adjusted EBITDA, see note 10.2 of the condensed consolidated interim financial statements in the H2 2020 results booklet.
         Adjusted EBITDA margin is calculated by dividing adjusted EBITDA by revenue                                                                                                                          7
US PGM operations – stable year-on-year

                              US PGM operations – Mined production (excl recycling) and AISC                                                   • Flat production of 298,301 2E oz year-on-year due to
                                                                                                                                                 safety incident in June 2021 and resultant 21 day
                        350                                                                                             2,500
                                                                                                                                                 stoppage (~20k 2E oz lost) at Stillwater mine
                        300                                                                                                                      - update to annual guidance as a result
                                                                                                                        2,000
                                                                                                                                               • 12% increase in AISC in H1 2021, due to 24% increase
2E PGM koz production

                        250
                                                                                                                                                 in 2E basket price (increase taxes & royalties) and
                                                                                                                        1,500                    lower than planned volumes

                                                                                                                                US$/2E oz
                        200
                                                                                                                                               • US$10.2m / R148m adj. FCF for H1 2021
                        150
                                                                                                                        1,000                  • 65% adjusted EBITDA1 margin underground
                        100                                                                                                                      operations
                                                                                                                        500
                         50

                         0                                                                                              0
                               H1 2018     H2 2018     H1 2019     H2 2019    H1 2020       H2 2020         H1 2021

                                  Mined production (2E)                      Production lost due to incident
                                  US$/2E oz average basket price (rhs)       All-in sustaining cost (rhs)

         High grade, low cost operations with downstream smelting, refining and largest recycling business in stable jurisdiction

         Source: Company results information
         1. The Group reports adjusted earnings before interest, taxes, depreciation and amortisation (EBITDA) based on the formula included in the facility agreements for compliance with the debt covenant
            formula. For a reconciliation of profit/loss before royalties and tax to adjusted EBITDA, see note 10.2 of the condensed consolidated interim financial statements in the H1 2021 results booklet.
            Adjusted EBITDA margin is calculated by dividing adjusted EBITDA by revenue                                                                                                                          8
PGM recycling – an under-recognised contribution of value

                            PGM recycling, adj. EBITDA and net interest received                                                                • 3E PGM Recycling output (403koz)

                      500                                                                                                60                     • US$50m adjusted EBITDA from recycling operations
                                                                                                                                                  and US$12m in net interest income from short-term
                      450
                                                                                                                                                  advances to recycle customers
                                                                                                                         50
                      400
                                                                                                                                                • Adj. EBITDA margin of 4%
3E PGM koz recycled

                      350
                                                                                                                         40                     • 4.2x per annum working capital turnover rate implies
                      300
                                                                                                                                                  annual return of c.20% (US$ terms)

                                                                                                                              US$m
                      250                                                                                                30
                      200
                                                                                                                         20
                      150
                      100
                                                                                                                         10
                      50
                       0                                                                                                 0
                            H1 2018    H2 2018     H1 2019       H2 2019       H1 2020       H2 2020       H1 2021

                                  Recycling production (3E)                      Adjusted EBITDA (US$m)
                                  Net interest received (US$m)

           A high volume and stable “green” business

           Source: Company results information
           1. The Group reports adjusted earnings before interest, taxes, depreciation and amortisation (EBITDA) based on the formula included in the facility agreements for compliance with the debt covenant
              formula. For a reconciliation of profit/loss before royalties and tax to adjusted EBITDA, see note 10.2 of the condensed consolidated interim financial statements in the H1 2021 results booklet
              Adjusted EBITDA margin is calculated by dividing adjusted EBITDA by revenue                                                                                                                         9
SA gold operations – solid performance
SA gold² – Underground and surface production with AISC & gold price
• 29% higher production (519koz) post COVID-19
impact in H1 2020
800 1,250,000
• DRDGOLD production 15% higher (88koz) at an AISC
R662,757/kg (US$1,417)
1,000,000
600 • AISC of R791,171/kg2 (US$1,691/oz) – stable year on
year
750,000
AISC R/kg
• 3% lower average rand gold price at R838,088/kg
Gold koz
400 (11% higher in dollars at US$1,792/oz)
500,000 • 40% increase in adjusted EBITDA¹ at R2.4bn2
• 18% adjusted EBITDA margin¹ for H1 2021
200
250,000
0 0
H1 2018 H2 2018 H1 2019 H2 2019 H1 2020 H2 2020 H1 2021
Surface production Underground(UG) production
R/kg average gold price (rhs) All-in sustaining cost (rhs)
Continuously striving to responsibly reduce costs and deliver safe production
Source: Company results information
1. The Group reports adjusted earnings before interest, taxes, depreciation and amortisation (EBITDA) based on the formula included in the facility agreements for compliance with the debt covenant formula.
For a reconciliation of profit/loss before royalties and tax to adjusted EBITDA, see note 10.2 of the condensed consolidated interim financial statements in the H2 2020 results booklet
Adjusted EBITDA margin is calculated by dividing adjusted EBITDA by revenue
2. Includes production and AISC of DRDGOLD 102021 Guidance5
• US PGM and cost guidance has been updated due to the impact of the accident
• SA PGM capital guidance has been reduced due to real savings , delayed project and capital development
• SA gold – updates to cost and capital made due to above inflation cost increases and inclusion of Burnstone project
2021 Production All-in sustaining costs Total capital
US PGM operations US$285m - US$295m
620 – 650 koz US$910 - US$940/oz4
(2E mined) (incl US$160m - US$165m project capital)
US Recycling (3E) 790 - 810 koz n/a n/a
R3,850m (US$257m)¹
SA PGM operations² R18,500 - 19,500/4Eoz
1.75 -1.85 moz² (incl. R350 million (US$23m) of K4 and
(4E PGMs) (US$1,230 -1,295/4Eoz)¹
Klipfontein project capital)
SA gold operations 27,500 - 29,500kg R815,000 - R840,000/kg R4,300m (US$286m)
(excluding DRDGOLD) (884koz - 948koz) (US$1,690 - 1,742/oz) (incl. R800m (US$53m) project capex)1
A substantial precious metals Group
Source: Company forecasts
1. Estimates are converted at an exchange rate of R15.00/US$
2. SA PGM operations’ production guidance include 50% of the attributable Mimosa production, although AISC and capital exclude Mimosa due it being equity accounted.
SA PGM exclude production and costs from the K4 and Klipfontein projects
3. Guidance does not take into account the impact of unplanned events (including unplanned COVID-19 related disruptions)
4. US PGM AISC are impacted by tax and royalties paid based on PGM prices, current guidance was based on spot 2E PGM prices of US$1,680/oz
5. As at 26 August 2021 11Financial results & optimising capital allocation
Income statement for the six months ended 30 June 2021

                                                    H1 2021    H1 2020    H1 2021    H1 2020
Figures are in millions unless otherwise stated
                                                       (Rm)       (Rm)    (US$m)     (US$m)      63% increase in revenue, attributable to all segments
Revenue                                              89,953     55,019      6,182      3,301
Cost of sales, before amortisation & depreciation   (48,153)   (37,725)    (3,309)    (2,263)    Cost of sales up 28% including recycling costs and US
Net other cash costs¹                                (1,251)     (780)        (86)       (48)                           royalties
Adjusted EBITDA²                                     40,549     16,514      2,787        990
Amortisation and depreciation                        (3,798)    (3,444)     (261)      (207)                   Earnings per share increased 140%
Net finance expense                                   (637)     (1,207)       (44)       (73)
(Loss)/gain on financial instruments                  (842)      1,554        (58)        93
                                                                                                      Increase in tax & royalties - higher profitability
Loss on foreign exchange differences                  (378)      (971)        (26)       (58)
Share of equity-accounted investees after tax         1,404        484         96         29
Impairments                                                -        (1)          -          -
                                                                                                 Interim dividend of ~R8,544 million or R2.92/share
Restructuring costs                                     (38)     (257)         (3)       (15)
                                                                                                       declared (35% of normalised³ earnings)
Net other costs                                       (232)      (462)        (15)       (26)
Profit before royalties and tax                      36,028     12,210      2,476        733
                                                                                                1 Includes lease payments (added back in net other costs) to conform with the
Royalties                                            (1,642)     (426)      (113)        (26)     adjusted EBITDA reconciliation disclosed in note 10.2
                                                                                                2 The Group reports adjusted earnings before interest, taxes, depreciation and
Carbon tax                                               (3)        (2)          -          -     amortisation (EBITDA) based on the formula included in the facility agreements for
                                                                                                  compliance with the debt covenant formula. For a reconciliation of profit before
Mining and income tax                                (9,064)    (2,051)     (623)      (123)      royalties and tax to adjusted EBITDA, see note 10.2 of the condensed consolidated
Profit for the period                                25,319      9,731      1,740        584      interim financial statements
                                                                                                3 Normalised earnings is a pro forma performance measure and is not a measure of
Normalised earnings³                                 24,411      8,845      1,678        531      performance under IFRS, may not be comparable to similarly titled measures of
                                                                                                  other companies, and should not be considered in isolation or as alternatives to
Earnings per share (cents)                              843        351         58         21      profit before tax, profit for the year, cash from operating activities or any other
                                                                                                  measure of financial performance presented in accordance with IFRS (see note 8
HEPS (cents)                                            843        350         58         21      of the condensed consolidated interim financial statements)

                                                                                                                                                                                   13
Strong dividend flow sustained following resumption in H1 2020
• 35% dividend declaration on H1 2021 normalised earnings at top end of dividend policy
Dividend analysis Interim H1 2021 Interim H1 2020 Final H2 2020 Total 2020 full year
Rm R24,411 R8,845 R21,762 R30,607
Normalised earnings
US$m1 US$1,678 US$531 US$1,338 US$1,869
Rm ~R8,544 R1,338 R9,375 R10,713
Dividends declared / paid
US$m2 ~US$565 US$79 US$649 US$728
SA cent per ordinary share 292 50 321 371
Dividends per share3
US cent converted2 19.30 2.95 22.21 25.16
US cents per ADR
77.21 11.80 88.84 100.64
(4:1)
Industry leading dividend maintained, supported by solid financial outlook
1 Converted at average exchange rate for the period of R14.55/US$ (H1 2021), R16.67/US$ (H1 2020) and R16.26/US$ (H2 2020)
2 Illustrated dividends in US cents are converted at closing rates obtained from IRESS of R15.1267/US$ on 23 Aug 2021 (H1 2021), R16.9689/US$ on 24 Aug 2020 (H1 2020) and R14.4551/US$ on 15 Feb
2021 (H2 2020)
3 The June 2021 interim dividend has been declared at 292 SA cents per share and will be paid on 21 September 2021 14Significant cash generation benefitting all stakeholders
Cashflow (Rm)
70,000
39,729 (4,469)
60,000
(5,586)
512 (478) (8,491)
50,000
(1,818)
(9,660)
40,000
(742) (2,316)
30,000 (751) (5) 5,925 (68) 26,097
20,240
20,000
10,000
0
Opening Cash Working Capex Interest Interest Taxes Royalties Dividend Share buy- Deferred Net loans Other Net cash Exchange Closing
cash generated capital received paid paid back payment repaid increase rate effect cash
• Strong H1 2021 cash flow generated by operations of R39.7bn (US$2.7bn)
• Supporting allocations of
- strong dividend payments of R9.7bn (US$0.7bn)
- capital expenditure of R5.6bn(US$0.4bn)
- working capital of R4.5bn (US$0.3bn) of which recycling inventory increased by R2.9bn (US$0.2bn)
- Increased profitability resulting in higher taxes and royalties paid of R8.5bn (US$0.6bn) and R1.8bn (US$0.1bn), respectively
• Deferred payment of R2.3bn (US$0.2bn) relates to the acquisition of the Rustenburg operations and Pandora of R2.2bn (US$0.2bn) and R70m (US$4.8m), respectively
15Disciplined allocation of capital in line with stated framework
Performance H1 2021*
• Reinvesting in operational sustainability. SA project capital –
estimated at R6.3bn (2021 total ~R845m)
• Liquidity buffer of R5bn; Debt buffer R15bn/US$1bn and
improved credit metrics
• Returning cash to shareholders - repeatable and
predictable. 25-35% of Normalised earnings
• Refinance US$500m (reduce gross debt, issuing longer
tenure bonds at improved costing)
• Value enhancement through cash settled share
incentives, alongside opportunistic share buybacks
• Surplus to be allocated prudently for further value
creation
Creating superior value for all stakeholders whilst ensuring sustainability
*For more detail on the performance of each of these areas, please refer to the appendix slide 16Our role in a greener future
Sustainability themes to deliver on our ESG commitments

 Develop a climate change resilient business
                                                    • Risk mitigation through
 • Building a Green metals business                                                                            • Biodiversity in mitigation & enhance rehabilitation
                                                       - Water demand and intensity design enhancements
 • Road to Carbon neutral                                                                                      • Global future ready leaders
                                                       - Tailings management & planning

 Entrenching long term economic sustainability: Integrated post mining economy

 • Leveraging assets for impact                           • Begin with the end in mind (post closure design)   • Economic sustainability

 Embedding human rights and ethics: Inside and out
 • Health and Safety: - collective accountability    • Social economic trust and renewal                       • Ethical culture and practices
 • Social sustainability through co-creation         • Third generation human rights

 Data driven and considered decision making
 • Granularity in data                                     • Disclosure deliberate and detailed                  • Assurance, verification and validation
 • Global reach, local application

Embedding ESG excellence as the way we do business – building a climate resilient business

                                                                                                                                                                       18
100MW generation license threshold increase Schedule 2 of the Electricity Regulation Act was amended by the DMRE, lifting the own-use generation licensing threshold to 100MW, thereby enabling derisking of renewable energy projects as well as acceleration execution by 3-6 months1 Progressive changes from government to fast-track the transition to renewable energy sources 1. Estimated saving on the 18-24 month development phase prior to construction of a renewable energy project 19
Progress on our path to carbon neutral

                                                                        Several renewable energy projects are approved for execution for our
                                                                           SA operations, which contribute 97% of our Scope 2 emissions2

     Renewable energy forms our strongest                                               50MW SA Gold Solar project
      decarbonisation lever as 88% of our                                               • Site secured and permitted. Final Eskom process underway.
     operational GHG emissions stem from                                                • RFQ tender underway to appoint a project developer on a
                  electricity1                                                            20-year PPA basis
                                                                                        Target commercial operational date (COD): Late 2023                                 Through our ‘Infrastructure
                                                                                                                                                                           for Impact’ programme, we
                                 879                                                                                                                                            will seek to maximise
                                 12%                                                                                                                                         broad-based economic
                                                                                        250MW SA Wind energy
                                                                                        • RFI conducted in Q2 2021, identifying ‘shovel-ready’ projects                            empowerment,
                       2020 CO2e
                       emissions:                                                         and confirming commercial viability                                                local skills and capability
                      Scope 1 & 2                                                       • RFQ tender underway to appoint project developers on a 15-                                development,
                                                                                          year PPA basis                                                                    and social and economic
                      (000t CO2e)                                                       Target COD: Late 2024
                                                                                                                                                                               impact through these
                                                                                                                                                                                      investments
                         6,244
                         88%
                                                                                        175MW SA PGM Solar projects
                                                                                        • Feasibility completed in Q2 2021, confirming solar business
                 Scope 1           Scope 2
                                                                                          case and three suitable sites adjacent to our operations
                                                                                        • Site permitting now underway
                                                                                        Target COD: Early 2025

The renewable energy projects will enable a 24% Scope 2 emission reduction in 2025 and 100% by 2038 for our SA operations 3
 1. Our Scope 2 emissions stem from 3rd party electricity supply only   2. Projects detailed in our SA Gold and SA PGM investor day presentations   3. Requires storage and market balancing mechanisms
                                                                                                                                                                                                          20
Building a Green metals business
• PGMs – current and future role – cleaning the air and
application in fuel cells
• Recycling – leverage existing business through growth,
inventory management and unlocking logistic challenges
• Tailings re-treatment - Producing the greenest metals while
cleaning up the environment
• Battery metals - Keliber and Sandouville are the first steps
into the battery metals space providing access to European
end users
• Uranium – value creation out of existing reserves – nuclear
energy to play its part in the future energy mix
Positioning Sibanye-Stillwater as provider of strategic metals for tomorrow’s green technologies
21PGMs – critical to a cleaner, greener environment
44
ruthenium
Ru
Demand secure over an extended horizon
Conventional
applications
101.1
• Removing noxious gasses from internal combustion engines
• Stringent and increasing environmental legislation drives higher PGM loadings
77
• Ongoing Industrial and jewellery demand
iridium
Ir
192.2
Medium and long-term growth
45
The Hydrogen economy will underpin future demand
Rh rhodium
102.9
• Platinum – effective catalyst for PEM electrolysers and fuel cells
• Iridium – key to the production of Green hydrogen through PEM electrolysers and renewable energy
• Ruthenium utilised in PEM fuel cells with platinum
areas
46
palladium
Pd
106.4
78
platinum
Pt
195.1
PGMs have unique chemical and physical properties making substitution extremely difficult
For more information about the uses of each of the PGMs, please refer to www.sibanyestillwater.com/about-us/about-pgms/ 22PGM market update
• Supply disruptions from Q1 2021 eased in Q2 2021
• Recycling expected to increase ~15% year on year as high rhodium and palladium prices continue
to incentivise metal returns to market despite supply chain disruptions and financing challenges
• Demand recovery impacted by Delta variant and chip shortage
• Automotive manufacturing rebound expected to satisfy pent up demand during 2022
• Despite the above overall 3E PGM market remains in deficit in 2021
PGM markets primarily impacted during the period by supply disruptions and global chip shortage
23Recycling PGMs – enabling multiple utilisation of these unique metals
• Our US recycling business is one of the largest recyclers of
PGMs from spent auto catalysts
• The most environmentally friendly PGM’s emitting
- 6x less tons of CO2
- 63x less water
- 90x less waste than our underground mines
• Dedicated business unit created and reflected in the H1 2021
segmented accounts
• To be led by Justin Froneman and existing Stillwater recycling
team complimented with technical capacity from RSA
• Growth strategy developed and being implemented
• Process enhancements and margin accretion are key focus
areas
A low emission business commanding a premium from our customers
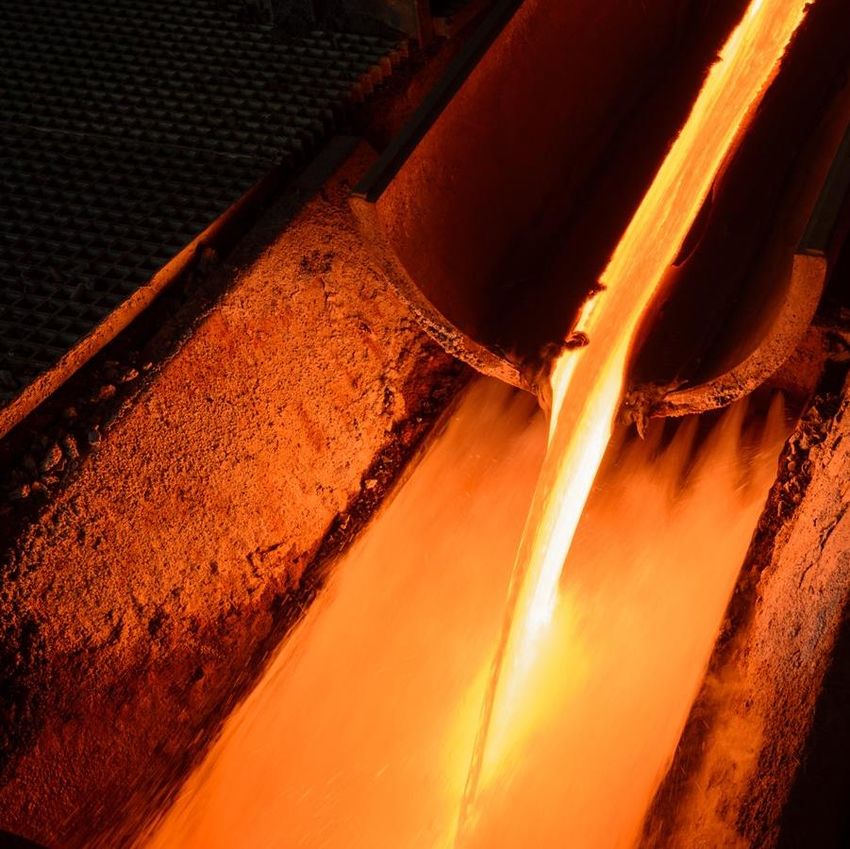
24Production of Green metals from tailings retreatment • Producing the greenest gold through our 50.66% investment in DRDGOLD • While also removing the environmental legacy of SA gold mining - hundreds of hectares cleared for social and industrial development - vegetating tailings depositions reducing dust to the environment - social investment in youth education and urban farming Opportunity to grow and produce other metals in an environmentally friendly manner For more information refer to www.drdgold.com 25
Battery metals
Penetration of BEV’s into light duty automotive sector following
an accelerated trajectory                                                  Indexed BEV production forecast
                                                                           2019 = 100
  •   Chinese and European markets at the forefront                        700
  •   increasing regionalisation of mobility battery metal supply chains                                                                  Recent forecasts
      expected                                                             600                                                            envisage more
                                                                                                                                          aggressive BEV
Lithium – the key metal for mobile battery applications                                                                                   introduction into the
                                                                           500
                                                                                                                                          powertrain mix
  •   demand set to dwarf current production volumes
  •   deficits looming in 2-3 years without substantial new supply         400                                                            Projections as at
                                                                                                                                                  Q2 2021
Cathode chemistry moving to high nickel compositions with                  300
                                                                                                                                                  Q1 2021
battery grade nickel processing instrumental
                                                                                                                                                  Q4 2020
                                                                           200
Security of responsible cobalt supply of increasing concern                                                                                       Q3 2020

                                                                           100                                                                    Q2 2020
Mobility battery metal recycling increasing but only material from
~2025                                                                                                                                             Q1 2020
                                                                            0
                                                                             2019       2020       2021       2022   2023   2024   2025

                                                                                 Source: SFA (Oxford), LMCA

A first wave of decarbonization

                                                                                                                                                            26
Initial battery metals steps
• Both Keliber and Sandouville are ideally located (in Finland and France) to access European BEV markets
• Building on and leveraging off existing marketing relationships with OEMs
• Strategic partnership with Johnson Matthey to drive more efficient uses of PGMs and metals used in battery technology
Keliber Sandouville
• Sibanye-Stillwater 30% stake in Keliber LiOH project at EUR30m • Nickel processing facilities in France
- paid EUR15m to date - Exclusive put option to acquire 100%
- increase to +50% after definitive feasibility of Sandouville from Eramet
• Ideal geography › Works council’s consultation outstanding,
closing ~ end 2021
- Finland top 5 in Fraser institute
- Aligned with Finnish Government through FMG managing Finnish • Prime location in the industrial heart
state mining shareholdings of Europe at Le Havre, France’s 2nd largest
industrial port
- Low environmental footprint
• significant logistical infrastructure
• Advanced project
- 9.3Mt reserves and 13 years life • Polyvalent facility which is already zoned for heavy industrial purposes
- First production in 2024 with 15,000t annual run rate - Scaleable for nickel, cobalt and lithium battery grade products
• Planned as the 1st fully integrated lithium producer in Europe with - Current Sandouville facilities include a hydrometallurgical nickel refinery
direct access to market from Port of Kokkola into the heart of › capacity of 12,000 tonnes p.a of high-purity nickel metal
Europe
› 4,000 tonnes per annum of high-purity nickel salts & solutions
• Uncommitted offtake provides more optionality
› around 600 tonnes per annum of cobalt chloride
27Putting the puzzle pieces together
Green energy metals
3 28 1 27 29 25
Li
Lithium
Ni
Nickel
H
Hydrogen
Co Cu Mn
Cobalt Copper Manganese
Graphite
92
Recycling U
Uranium
Tailings
retreatment
PGMs
46 78 45 77 44
Pd
Palladium
Pt
Platinum
Rh
Rhodium
Ir
Iridium
Ru
Ruthenium
Future green energy
Positioning Sibanye-Stillwater as provider of strategic metals for tomorrow’s green technologies
28New horizons for Uranium - a significant element in our green metals portfolio
Nuclear emerging as a zero-carbon baseload generation option essential for global
decarbonisation
• Commitment growing, especially in Asia Pacific region
• 125 GW pipeline of new nuclear capacity
Uranium market to move into deficit over 5 to 10 years
• Long term price forecasts exceeding US$60/lb.
100mlbs shallow and surface uranium resources at Beatrix West and Cooke tailings with
established uranium processing infrastructure
Long time associate and advisor Dennis Tucker will be leading this initiative
Uranium – unloved for a decade now recognised as a green metal
29Ongoing strategic value creation
• Pivoting into green metals through the combination of PGM’s, recycling, tailings re-treatment, battery metals and uranium
• First mover advantage having started our analysis of this sector through the acquisition of SFA Oxford more than 2 years ago
• Keliber and Sandouville are initial entries into the European battery metals space
3 28 27 25
2021 - Sandouville (Ni) Li
Lithium
Ni Co Mn
Nickel Cobalt Manganese
Graphite
2021 - Keliber (LiOH)
92 1 29
Green energy
4 Recycling U H Cu Tailings
retreatment
metals Uranium Hydrogen Copper
Growth
PGM 46 78 45
2017 Recycling Pd Pt Rh
Stillwater Palladium Platinum Rhodium
US PGMs 3 2019
Lonmin
46 78 45 77 44
SA PGMs 2
2016
Aquarius
2016
Rustenburg
Pd
Palladium
Pt
Platinum
Rh
Rhodium
Ir
Iridium
Ru
Ruthenium
Tailings
retreatment
SA
gold 2013 2018 2020
2013 DRDGOLD
Cooke DRDGOLD 92 79
1
Wits Gold
U
Uranium
Au Gold
Tailings
retreatment
Time
Green metals strategy complementary to existing commodity exposure
30Continued focus and delivery on our strategic intent
Building an
operating portfolio
Strengthen our position of green metals
as a leading international and related
mining Group by: technologies
31Conclusion
Segmental life of mine net asset value composition

                                                                     Sibanye-Stillwater NAV Analysis – at consensus prices4

                                                                                                                                                             R59 per share
    US PGM operations         SA PGM operations         SA gold operations       SA projects (10%*)      Net Cash (30Jun2021) Total Sibanye-Stillwater   Market Cap
         (5%*)                     (7.5%*)                   (7.5%*)                                                                    NAV

Significant upside based on consensus commodity prices

1. SA projects include: K4, Klipfontein and Burnstone. Exclude any value for DRDGOLD or any of our external projects (Altar, Marathon, etc.)
2. NPV calculated utilising the life of mine plans as at 31 December 2020
3. US PGM operations converted from US$ to ZAR at consensus ZAR price for 2021
4. Consensus pricing as at end July 2021 * Percentages represent the discount rates applied                                                                                  33
Join our
2021 Investor days
99September
September2021
2021
22
22September
September2021
2021
More information on times and links will be available in due course at www.sibanyestillwater.com 34Superior value creation – current and for the future
• 2013-2019: Cumulative Normalised earnings - R9.9bn (US$806m)
• H1 2021: R24.4bn (US$1.68bn)3 – 85% of 2020 full year earnings and
Improved multiples more than preceding years
profitability
Advancing
complementary
green metals Exposure to • 2013-2017: Cumulative R4.1bn (US$327m) dividends from SA gold
Dividends5
strategy future green
• H1 2021: R8.5bn (US$565m) – implied 9.7% annualised div yield4
Value
R163bn (US$10.8bn)
creation
increase in market
Growth in
capitalisation in Market cap • Listed: 13.5moz gold reserves in SA, limited life
asset value
eight years¹ appreciation
and life of • Transformed into substantial, diversified mining and
since 2013
mine processing company with long life assets
- SA gold +10 years
5% Buyback - SA PGM + 30 years life
of shares2
- US PGM + 35 years life
Performing in line with our vision
1. Based on market capitalisation at 23 August 2021 (R173bn) less market cap listing date (R10bn), converted to US$ at the closing exchange rate of R15.1267/US$ obtained from Iress on 23 August 2021
2. Buyback process from 2 Jun 2021 – 6 April 2022, more than 1.92% bought back by 23 August 2021
3. Normalised earnings 4. Using R59.66 SSW share price as at 24 August 2021 5. Dividend policy of paying 25%- 35% of normalised earnings
35Making real changes to transform and create value for all stakeholders
Restructuring of the Marikana empowerment structure Social relief via BEE structures & employee profit share schemes
• Previous structure non-beneficial with substantial debt burden • R145m paid to Rustenburg BEE structures & R64m to
• New sustainable B-BBEE financing structure with immediate access to employees via profit share scheme (ESOP) since acquisition
distributable cash flow and the ongoing transfer of tangible value • R91m paid to Marikana empowerment structures & R521m paid to
• Securing the licence to operate for these operations Marikana employees trust (ESOP) for 2020 year
• R294m paid to SA gold employees via Thusano trust since 2013
Investing in projects results in job security and opportunities
• K4, Klipfontein & Burnstone to creating > 7,000 jobs
Contributing to the fiscus and social imperatives
Target: 30% female
• Sibanye-Stillwater royalties and taxes* of R10.3bn for H1 2021 alone
workforce by 2025
• Delivering on Social and labour plans for each mining licence
• Employee voluntary contribution scheme
• Sponsorships to universities, bursaries and learnerships
Our mining
Our improves
mining improveslives
lives
* As per Cash flow statement 36Questions?
Contacts
James Wellsted/
Henrika Ninham/
Chris Law
ir@sibanyestillwater.com
Tel:
+27(0)83 453 4014/
+27(0)72 448 5910/
+44 (0)7923126200
Website: www.sibanyestillwater.com
Tickers: JSE: SSW and NYSE: SBSW
37H1 2021 results and Group strategic overview for the six months ended 30 June 2021
Appendices
Disciplined allocation of capital in line with stated framework

                                     Performance H1 2021
                                                           • Aim: Reinvesting in operational sustainability. SA project capital – R6.3bn
                                                           ✓ K4 , Klipfontein and Burnstone – administration and project set-up started in H1 2021. R18m spend to date
                                                             (2021 total ~R845m)

                                                           • Aim: Liquidity buffer of R5bn; Debt buffer R15bn/US$1bn and improved credit metrics
                                                           ✓ H1 2021: R26bn cash position, includes R15bn debt buffer and R11bn liquidity buffer

                                                           • Aim: Returning cash to shareholders - repeatable and predictable. 25-35% of Normalised earnings
                                                           ✓ H1 2021 interim declared ~R8.5bn (US$565m)/ 35% of Normalised
                                                           ✓ 2020 paid R10.7bn(US$650m) /35% normalised

                                                           • Aim: Refinance US$500m (reduce gross debt, issuing longer tenure bonds at improved costing)
                                                           ✓ Redeemed US$354m of 2022 bonds in August 2021
                                                           ✓ Planning a refinancing of the US$340m of 2025 bonds, with uplift to a $500m bond value in Q4 2021
                                                           • Aim: Value enhancement through cash settled share incentives, alongside opportunistic share
                                                             buybacks
                                                           ✓ Launched buyback in June 2021; by 23 August had bought back 1.92% of issued share capital

                                                           •   Aim: Surplus to be allocated prudently for further value creation
                                                           ✓   Acquired non-controlling interest of Platinum Mile in Jun 2021 (8.3% resulting in 100%)
                                                           ✓   Invested in clean metal strategy – 30% stake in Keliber (paid €15m (17.93%)of initial €30m)
                                                           ✓   Sandouville transaction (100% stake) in progress (no cash outflow yet)

Creating superior value for all stakeholders whilst ensuring sustainable operations

                                                                                                                                                                 40
You can also read