Health care innovation reaches warp speed
←
→
Page content transcription
If your browser does not render page correctly, please read the page content below
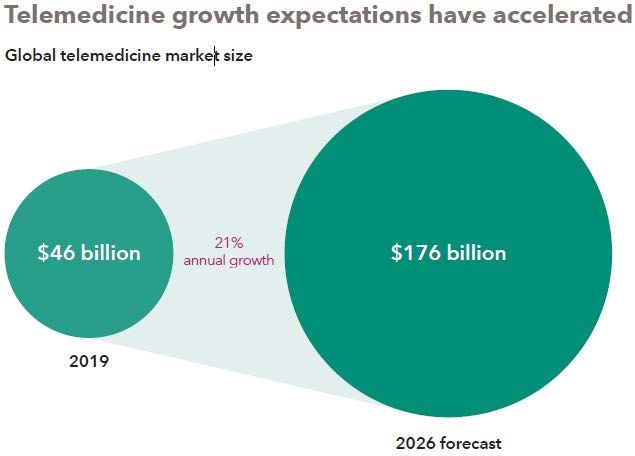
Health care innovation reaches warp speed

Revenue of remote patient monitoring devices                                                        Global telemedicine market size

Sources: Industry & government data, Kagan estimates, Standard & Poor’s. Data compiled June 2020.   Sources: Capital Group, Global Market Insights, Statista. As of 4/30/20. Forecast includes impact of COVID-19.
Values based on USD.                                                                                Values based on USD.

© 2020
  2021 Capital Group. All rights reserved.                                                                                                                                                                           4
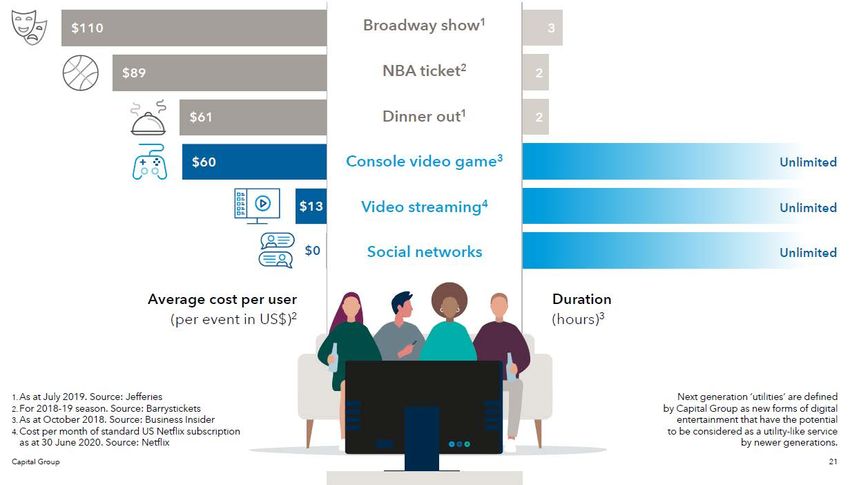
Gaming and streaming content provide strong value for consumers

                                      Average cost per user (per event in USD)1                            Duration (hours)2

                                                                                                   3

                                                                                               1

                                                                                               3

                                                                                                       2

1 For 2018–2019 season. Source: Barrystickets.
2 As of October 2018. Source: Business Insider.
3 As of July 2019. Source: Jefferies.
4 Cost per month of standard U.S. Netflix subscription as of June 30, 2020. Source: Netflix.

© 2020
  2021 Capital Group. All rights reserved.                                                                                     11
It’s not just about technology companies. It’s about being tech-enabled.
Cumulative returns in 2020
SHAPE UP VIRTUALLY BUY CARS REMOTELY “JUST DO IT” DIGITALLY
500% 250% 60%
Peloton Interactive Carvana Nike
Planet Fitness CarMax Skechers
400% 200% 40%
150%
300% 20%
100%
200% 0%
50%
100% –20%
0%
0% –50% –40%
–100% –100% –60%
Jan Mar May Jul Sep Nov Jan Mar May Jul Sep Nov Jan Mar May Jul Sep Nov
Source: Refinitiv Datastream. As of 12/31/20. Returns are total returns in USD.
© 2020
2021 Capital Group. All rights reserved. 20European utilities are among the leaders in renewable energy capacity
Renewables as a % of total energy capacity
Source: Capital Group. Estimates are for fiscal year 2020 as of 11/18/20.
© 2020
2021 Capital Group. All rights reserved. 6Electric vehicles expected to hit the fast lane
Electric vehicle fleet worldwide (millions units)
300
All-electric vehicles
250 Plug-in hybrids
200
150
28% annualized growth
100
50
0
2018 2019 2020 2021 2022 2023 2024 2025 2026 2027 2028 2029 2030
Source: IEA, Electric vehicle stock in the EV30@30 scenario, 2018–2030, IEA, Paris. Data for 2020–2030 are forecasts, provided by IEA.
© 2020
2021 Capital Group. All rights reserved. 8Distribution of COVID vaccinations has accelerated
Daily U.S. vaccine doses administered (seven-day moving average)
1,800,000
1,600,000
1,400,000
1,200,000
1,000,000
800,000
600,000
400,000
200,000
-0
12/26/2020 1/3/2021 1/11/2021 1/19/2021 1/27/2021 2/4/2021 2/12/2021
Sources: Capital Group, Our World in Data, Oxford University, Refinitiv Datastream. As of 2/12/21.
© 2020
2021 Capital Group. All rights reserved. 3Pent-up demand for travel and entertainment
Domestic airline passengers (change from previous year)
20%
China –6.3%
0%
–20%
–40%
U.S. –60.9%
–60%
–80%
–100%
1/19 3/19 5/19 7/19 9/19 11/19 1/20 3/20 5/20 7/20 9/20 11/20
Sources: Capital Group, Bloomberg, Bureau of Transportation Statistics. China data is through 11/30/20. U.S. data is through 12/31/20.
© 2020
2021 Capital Group. All rights reserved. 10Important information Investors should carefully consider investment objectives, risks, charges and expenses. This and other important information is contained in the fund prospectuses and summary prospectuses, which can be obtained from a financial professional and should be read carefully before investing. Investing outside the United States involves risks, such as currency fluctuations, periods of illiquidity and price volatility, as more fully described in the prospectus. These risks may be heightened in connection with investments in developing countries. Small-company stocks entail additional risks, and they can fluctuate in price more than larger company stocks. The market indexes are unmanaged and, therefore, have no expenses. Investors cannot invest directly in an index. Bloomberg® is a trademark of Bloomberg Finance L.P. (collectively with its affiliates, “Bloomberg”). This report, and any product, index or fund referred to herein, is not sponsored, endorsed or promoted in any way by J.P. Morgan or any of its affiliates who provide no warranties whatsoever, express or implied, and shall have no liability to any prospective investor, in connection with this report. J.P. Morgan disclaimer: https://www.jpmm.com/research/disclosures. The Russell 1000® Value Index measures the results of the large-cap value segment of the U.S. equity universe. The Russell 1000® Growth Index measures the results of the large-cap growth segment of the U.S. equity universe. © 2020 2021 Capital Group. All rights reserved. 21
London Stock Exchange Group plc and its group undertakings (collectively, the “LSE Group”). © LSE Group 2021. FTSE Russell is a
trading name of certain of the LSE Group companies. FTSE indexes are trademarks of the relevant LSE Group companies and are used
by any other LSE Group company under license. All rights in the FTSE Russell indexes or data vest in the relevant LSE Group company
which owns the index or the data. Neither LSE Group nor its licensors accept any liability for any errors or omissions in the indexes or
data and no party may rely on any indexes or data contained in this communication. No further distribution of data from the LSE Group
is permitted without the relevant LSE Group company’s express written consent. The LSE Group does not promote, sponsor or endorse
the content of this communication.

MSCI EAFE is designed to measure results of 21 developed markets countries around the world, excluding the U.S. and Canada.

MSCI has not approved, reviewed or produced this report, makes no express or implied warranties or representations and is not liable
whatsoever for any data in the report. You may not redistribute the MSCI data or use it as a basis for other indices or investment
products.

Standard & Poor‘s 500 Composite Index is a market capitalization-weighted index based on the results of approximately 500 widely
held common stocks.

Standard & Poor’s 500 Composite Index (“Index”) is a product of S&P Dow Jones Indices LLC and/or its affiliates and has been licensed
for use by Capital Group. Copyright © 2021 S&P Dow Jones Indices LLC, a division of S&P Global, and/or its affiliates. All rights
reserved. Redistribution or reproduction in whole or in part is prohibited without written permission of S&P Dow Jones Indices LLC.

Statements attributed to an individual represent the opinions of that individual as of the date published and do not necessarily reflect
the opinions of Capital Group or its affiliates. This information is intended to highlight issues and should not be considered advice, an
endorsement or a recommendation.

© 2020
  2021 Capital Group. All rights reserved.                                                                                                  22
This content, developed by Capital Group, home of American Funds, should not be used as a primary basis for investment decisions
and is not intended to serve as impartial investment or fiduciary advice.

All Capital Group trademarks mentioned are owned by The Capital Group Companies, Inc., an affiliated company or fund. All other
company and product names mentioned are the property of their respective companies.

American Funds Distributors, Inc., member FINRA.

For Canada: American Funds are intended only for persons eligible to purchase U.S.-registered mutual funds. The Capital Ideas website
is not intended for use outside the U.S. In Canada, please visit capitalgroup.com/ca for Capital Group insights.

This document and its contents are confidential and designed for the exclusive use of registered dealers and their representatives.
Canadian securities legislation, including National Instrument 81-102, prohibits its distribution to investors, potential investors or the
general public. It is not intended to be a sales communication, as defined in the Instrument, and has not been designed to comply
with its requirements relating to sales communications. Unless otherwise indicated, the investment professionals featured do not
manage Capital Group's Canadian mutual funds.

Forward-looking statements are not guarantees of future performance, and actual events and results could differ materially from those
expressed or implied in any forward-looking statements made herein. We encourage you to consider these and other factors carefully
before making any investment decisions, and we urge you to avoid placing undue reliance on forward-looking statements.

Capital Group funds and Capital International Asset Management (Canada), Inc. are part of Capital Group, a global investment
management firm originating in Los Angeles, California in 1931.

© 2020
  2021 Capital Group. All rights reserved.                                                                                                   23
You can also read