Hornbill Natural History and Conservation - Hornbill Specialist Group | January 2020 - IUCN Hornbill ...
←
→
Page content transcription
If your browser does not render page correctly, please read the page content below

IUCN HSG

    Hornbill Natural History and Conservation
                      Volume 1, Number 1

               Hornbill Specialist Group | January 2020

I
IUCN HSG

                          The IUCN SSC HSG is hosted by:

     Cover Photograph: Displaying pair of Von der Decken’s Hornbills. © Margaret F. Kinnaird

II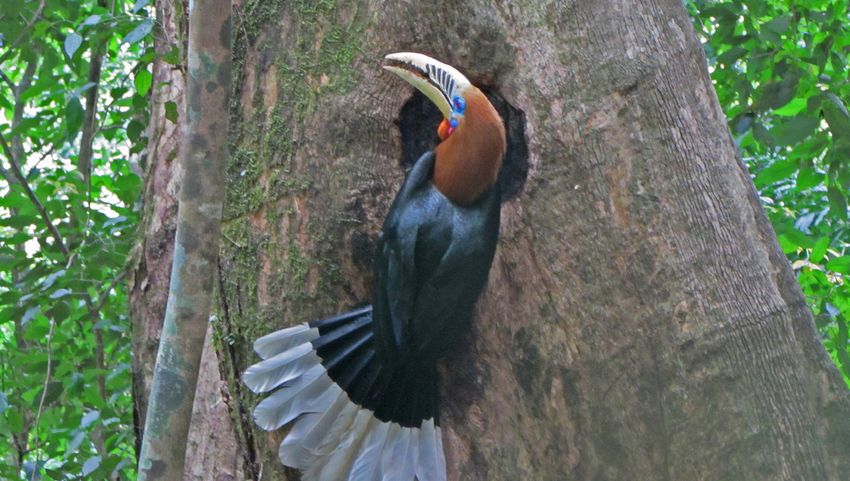
IUCN HSG

Contents
 Foreword                                                                     1

 Research articles

 Hornbill density estimates and fruit availability in a lowland tropical
 rainforest site of Leuser Landscape, Indonesia: preliminary data
 towards long-term monitoring                                                 2
 Ardiantiono, Karyadi, Muhammad Isa, Abdul Khaliq Hasibuan, Isma Kusara,
 Arwin, Ibrahim, Supriadi, and William Marthy

 Genetic monogamy in Von der Decken’s and Northern Red-billed
 hornbills                                                                    12
 Margaret F. Kinnaird and Timothy G. O’Brien

 Long-term monitoring of nesting behavior and nesting habitat of four
 sympatric hornbill species in a Sumatran lowland tropical rainforest of
 Bukit Barisan Selatan National Park                                          17
 Marsya C. Sibarani, Laji Utoyo, Ricky Danang Pratama, Meidita Aulia Danus,
 Rahman Sudrajat, Fahrudin Surahmat, and William Marthy

 Notes from the field

 Sighting records of hornbills in western Brunei Darussalam
                                                                              30
 Bosco Pui Lok Chan
 Trumpeter hornbill (Bycanistes bucinator) bill colouration
                                                                              35
 Hugh Chittenden
 Unusually low nest of Rufous-necked hornbill in Bhutan
                                                                              39
 Kinley, Dimple Thapa and Dorji Wangmo
 Flocking of hornbills observed in Tongbiguan Nature Reserve, Yunnan, China
                                                                              42
 Xi Zheng, Li-Xiang Zhang, Zheng-Hua Yang, and Bosco Pui Lok Chan

 Hornbill news

 Update from the Helmeted Hornbill Working Group
                                                                              45
 Anuj Jain and Jessica Lee
 IUCN HSG Update and Activities
                                                                              48
 Aparajita Datta and Lucy Kemp

III
IUCN HSG

Foreword
We are delighted and super pleased to an-            We are very grateful for the time and effort put
nounce the publication of the first issue of         in by our Editorial Board in bringing out the
‘Hornbill Natural History and Conservation’.         first issue of this IUCN SSC Hornbill Specialist
This is part of the work of the IUCN SSC Horn-       Group’s newsletter – Hornbill Natural History
bill Specialist Group. We hope to bring out two      and Conservation. We hope that more HSG
issues of this online peer-reviewed publication      members and anyone working on hornbills will
annually which is free for access.                   participate and contribute to this publication in
                                                     future.

We hope this publication will highlight aca-
demic work, natural history notes, conservation      Wishing you all a great year ahead and one that
stories and essays on hornbills of the world.        is full of hornbills.
While all research articles and notes will be
peer-reviewed, this newsletter is also meant to
share information/data/reports that often may        Aparajita Datta & Lucy Kemp
not reach formal peer-reviewed journals.             Co-Chairs, IUCN SSC Hornbill Specialist Group

In this first issue, a call for articles was an-
nounced in August 2019. The Editorial Board
consists of Dr. Tim O’Brien, Dr. Divya Mudap-
pa, Dr. T. R. Shankar Raman, and Dr. Jarryd Al-
exander who reviewed the submitted articles.
They also edited the articles for clarity and Ms
Janhavi Rajan formatted it for online publica-
tion.

The first issue has a good mix of papers from
Asia and Africa. We have three main articles
and four notes from the field with contributions
from 26 authors. The 3 articles cover ecological
work on several hornbill species in Sumatra and
a study that addresses the question of genet-
ic monogamy in two species of African horn-
bills. The notes cover interesting natural history
observations from Brunei, China, Bhutan and
South Africa. There are also updates and news
of HSG activities and from the Helmeted Horn-
bill Working Group.

1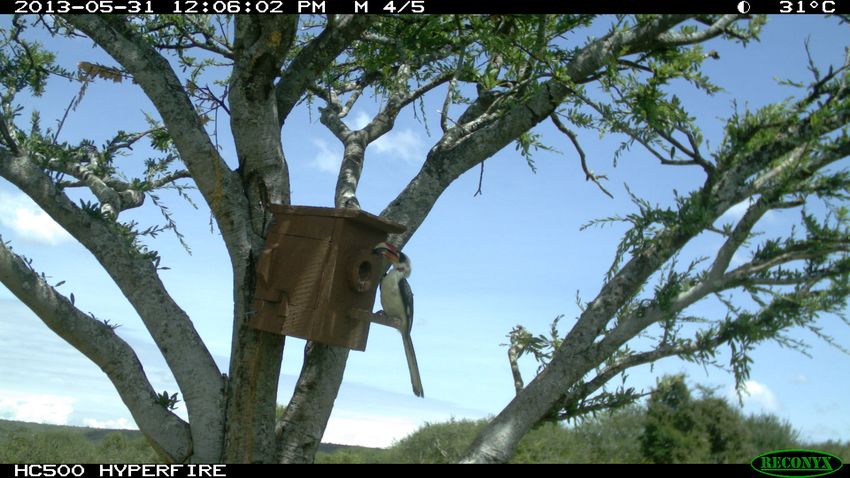
IUCN HSG

Research articles

    Hornbill density estimates and fruit availability in a lowland tropical
     rainforest site of Leuser Landscape, Indonesia: preliminary data
                       towards long-term monitoring

    Ardiantiono1*, Karyadi2, Muhammad Isa3, Abdul Khaliq Hasibuan1, Isma Kusara1,
                    Arwin3, Ibrahim3, Supriadi2, and William Marthy1

1
 Wildlife Conservation Society-Indonesia Programme, Bogor, West Java, Indonesia 16151
2
 Gunung Leuser National Park, Medan, North Sumatra, Indonesia 20219
3
 Forum Konservasi Leuser, Banda Aceh, Aceh, Indonesia 23119
*Corresponding author: aardiantiono@wcs.org

Abstract
Reliable density estimates of threatened species           Keywords: hornbill, population monitoring,
provide important information on their conserva-           food availability, detection probability, Leuser
tion status and effectiveness of conservation ef-          landscape
forts. Here, we provided the first density estimates
that utilize detection probability of four hornbill
species in Ketambe Research Station area, Leus-            Introduction
er Landscape. Moreover, we made a preliminary
investigation of the relationship between hornbill         Effective conservation strategies are necessary
detections and fruit availability. We conducted line       to halt and reverse the declining trends of bio-
transect and phenology surveys during July-Sep-            diversity as a result of detrimental human activi-
tember 2019. Our findings highlighted the im-
                                                           ties (Butchart et al. 2010; Hoffmann et al. 2010).
portance of Ketambe as a stronghold for hornbill
populations, indicated by relatively higher density        Population data such as density provides im-
estimates of four species (Wreathed Hornbill Rhyt-         portant information on the current conserva-
iceros undulatus, Rhinoceros Hornbill Buceros rhi-         tion status of focus species or taxa (Marthy et
noceros, Bushy-crested Hornbill Anorrhinus galer-          al. 2016). Furthermore, this density baseline
itus, and White-crowned Hornbill Berenicornis co-
matus) than elsewhere. We noted the lack of Hel-           serves as starting point for wildlife monitoring
meted hornbill detections which might be due to            to assess the rates of population change and
illegal poaching. Further, we identified the positive      to evaluate the effectiveness of conservation
influence of ripe fruit supplies on hornbill presence.     measures (Ariefiandy et al. 2013; Marthy et al.
Our study presented the baseline density data for
                                                           2016).
future hornbill population monitoring studies.

We also recommended conducting studies of                  Hornbills represent an ideal surrogate for popula-
hornbill diet and foraging behaviour and their re-         tion monitoring because of their ecological roles
sponses to human disturbances.
                                                           and conservation values. Hornbills are among the

2                                                                                         Vol. 1(1): 2–11, 2020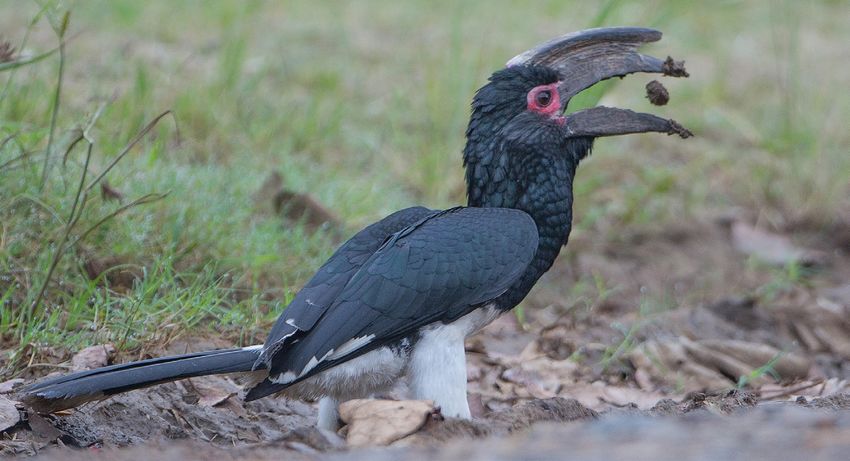
IUCN HSG                                                                       Hornbill Nat. Hist. & Conserv.

most charismatic bird species in tropical rainforest      Considering their threatened statuses, moni-
(Kinnaird and O’Brien 2007). They act as indicators       toring the population of these hornbills to un-
of forest condition and anthropogenic disturbance         derstand their breeding success is crucial be-
as hornbills require large and relatively-undisturbed     cause it is the essence of their existence in the
forests with large and tall trees for feeding and nest-   wild. However, hornbill population data from
ing (Hadiprakarsa and Kinnaird 2004). Moreover,           Sumatra is limited as only few studies have
these species contribute in maintaining forests due       been published (e.g. Anggraini et al. 2000;
to their ability to disperse fruit seeds over vast dis-   Kinnaird and O’Brien 2007; Nur et al. 2013;
tances (Kitamura 2011).                                   Marthy et al. 2016; Kamal et al. 2018). Among
                                                          these studies, only studies from Anggraini et al.
                                                          (2000), Kinnaird and O’Brien (2007), and Mar-
Conservation of hornbills is especially relevant to the   thy et al. (2016) had incorporated estimates of
Island of Sumatra, which harbors nine out of the 13       detectability to provide unbiased density esti-
hornbill species in Indonesia (Kinnaird and O’Brien       mates with comparable results over time and
2007) where the threats to hornbills are pervasive.       space (Karanth and Nichols 1998; Buckland et
The Sumatran lowland tropical rainforest, the prima-      al. 2001).
ry hornbill habitat is rapidly disappearing with 21.3%
of the area being lost between 2000 – 2012 (Margo-
no et al. 2014). This problem is exacerbated by the       In addition to hornbill population monitoring,
trading of hornbills for use as pets and ornaments        assessment on the hornbill food sources is also
(Beastall et al. 2016). These pressures were reflected    important as a potential factor influencing the
in the hornbill IUCN Red List, where by the end of        hornbill density. Anggarini et al. (2000) and Kin-
2018, seven of the 13 hornbill species in Indonesia       naird and O’Brien (2007) suggested that horn-
received an upgraded threatened status from either        bill densities in Sumatra and Sulawesi were sig-
Least-Concern (LC) or Near-Threatened (NT) to Vul-        nificantly influenced by the type, amount, and
nerable (VU), Endangered (EN), or Critically Endan-       ripeness of fruits available in their habitat. Horn-
gered (CR) (IUCN 2019).                                   bill densities can also highly fluctuate overtime
                                                          in relation to fruit production, as reported by
                                                          Kinnaird et al. (1996) who found Red-knobbed
For three species, the changes were highly sig-           hornbill Rhyticeros cassidix monthly densities
nificant: Wrinkled Hornbill Rhabdotorrhinus cor-          ranged from 9.30 – 82.7 individuals/km2 during
rugatus and White-crowned Hornbill Berenicor-             their two-year study at Tangkoko, Sulawesi.
nis comatus went from NT to EN, and Wreathed              This density-fruit relationship thus emphasizes
Hornbill Rhyticeros undulatus went from LC to VU.         the importance of fruit availability—the princi-
Furthermore, four other species were up-listed by         pal hornbill diet—in assessing the hornbill pop-
one threatened status in 2018: Rhinoceros Hornbill        ulation status.
Buceros rhinoceros, Great Hornbill Buceros bicor-
nis, and Black Hornbill Anthracoceros malayanus
from NT to VU and Bushy-crested Hornbill Anor-            Recalling the importance of providing reliable
rhinus galeritus from LC to NT. It should not be for-     baseline data for long-term monitoring, this
gotten that the Helmeted Hornbill Rhinoplax vigil         study aimed to: 1) estimate the baseline densi-
in 2015 made the most worrying jump from NT to            ty of hornbill species accounting for detectabil-
CR, recognizing that it is on the edge of extinction.     ity and 2) investigate the relationship between

3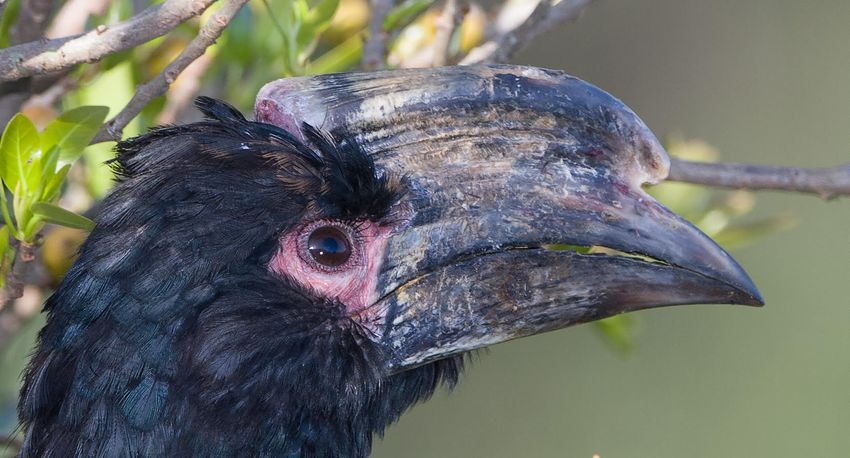
IUCN HSG

hornbill detections and fruit availability in a monitor-
ing site of the Leuser Landscape. We chose Leuser
Landscape as it represents the largest extant Suma-
tran tropical forest (2.6 million ha) and is a global
biodiversity hotspot with significant conservation fo-
cus, but is also increasingly threatened by infrastruc-
ture development, encroachment and other human
activities (Sloan et al. 2018).

Method
Study Area
We conducted our study in Ketambe Research Sta-
tion site (3°41′N, 97°39′E) within Gunung Leuser Na-
tional Park (GLNP), part of Leuser Landscape, Suma-
                                                           Fig. 1. Study area showing transects located in the
tra (Hardus et al. 2012; Figure 1). Ketambe Research
                                                           core ecological monitoring area of Ketambe.
Station was established in 1971 and is widely known
for its orangutan long-term studies. The site area
(450 ha) is dominated by primary forest across ele-        Hornbill population survey
vation of 350 – 1 000 m a.s.l. (Wich et al. 1999). Ap-
                                                           We conducted variable-width line transect surveys
proximately one fifth (83.1 ha) of the eastern part of
                                                           for 2.5 months from July-September 2019 during
Ketambe Research Station area is secondary forest
                                                           dry (July-August) and wet (September) seasons
as the result of selective logging in the early 2000’s
                                                           (Thomas et al. 2010). The survey was conducted ev-
(Hardus et al. 2012). The site is located next to the
                                                           ery two weeks, resulting in total of five replications.
boundary of GLNP, separated from nearby villages
                                                           We started the survey from 07:30 – 10:30 (three
by the Alas River in the east.
                                                           hours). We surveyed one transect per day and used
                                                           alternating transects separated by 400 m on the
We used five straight-line transects of 0.78 km (tran-     next day to minimize the chance of double counting
sect 1) and 1.50 km (transect 2-5) separated by 200        (e.g. order of survey = transect 1, 3, 5, 2, 4). We also
m. Transect 1 was shorter as it was located in the         started from the opposite side of each transect for
furthest north of the site area and limited by the site    every other replication.
river boundary (Fig. 1). These transects were locat-
ed to cover around 50% (220 ha) of the site area
                                                           During the surveys, we collected data of 1) hornbill
representing a mix of primary and secondary forests
                                                           species, 2) detection type (visual or aural), 3) dis-
with an elevation between 400 – 600 m a.s.l. This
                                                           tance between observer and hornbill, 4) angle be-
area was chosen as it is the core area for ecological
                                                           tween observer position on transect and hornbill,
monitoring at the research station and has higher
                                                           and 5) number of individuals. Visual and aural signs
fruit production than the southern area (van Schaik
                                                           were collected to increase the detection as visual
and Mirmanto 1985; Wich et al. 2006). We did not
                                                           encounter are often difficult in the primary forest
allocate transects in the southern area (600 – 1 000
                                                           with thick canopy cover and the data were com-
m a.s.l.) as it has rugged terrain and steep slopes,
                                                           bined for density estimates (Kinnaird et al. 1996;
making straight line transect sampling difficult.

4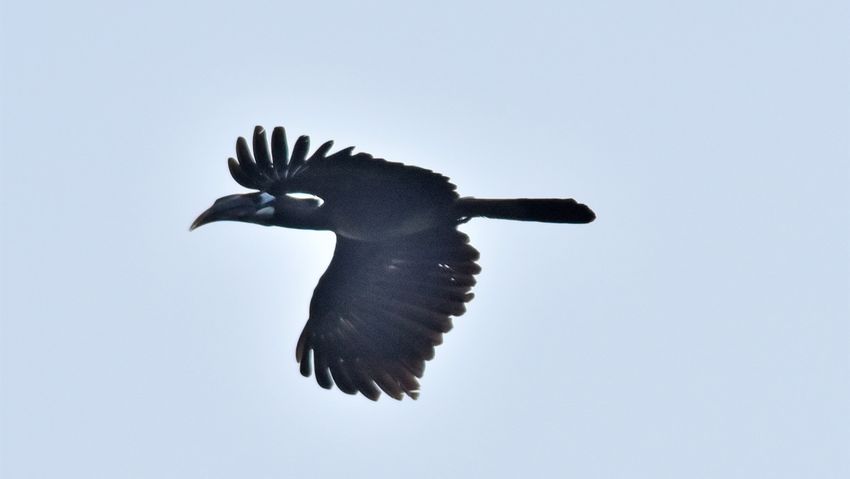
IUCN HSG                                                                  Hornbill Nat. Hist. & Conserv.

Gale and Thongaree 2006; Marthy et al. 2016).         cated the perpendicular distance data if natu-
Flying hornbills were recorded but not used for       ral breaks occurred to maintain the detection
density analysis.                                     curve monotonicity. We then grouped the dis-
                                                      tance data based on the suggestion from au-
                                                      tomatically grouped detection curves provided
Fruit availability survey                             by the aforementioned model outputs to im-
We conducted the phenological surveys on              prove the estimate precision.
the same day after the hornbill survey using
the same transects (11:00 – 17:00), following
                                                      To infer the density estimate of rare species with
the methods of Anggraini et al. (2000). We ob-
                                                      low detection (N < 10), we used a multi-spe-
served trees that produced fruits confirmed or
                                                      cies framework proposed by Alldredge et al.
potentially consumed by hornbills (e.g. fleshy
                                                      (2007). This framework was applied by “bor-
fruits, drupaceous, and small-medium sized;
                                                      rowing” the detection data of other species
Hadiprakarsa and Kinnaird 2004). All poten-
                                                      within the same genus or family with similar
tial fruiting trees within 50 m of both sides of
                                                      characteristics such as body size, diet, and call-
transects were mapped and identified to spe-
                                                      ing (Alldredge et al. 2007; Marthy et al. 2016).
cies or genus level. We visually estimated 1)
                                                      For example, in this study we combined the de-
the percentage of canopy covered by fruits (%
                                                      tections of rare White-crowned hornbill (N = 4)
fruit in canopy) and 2) the percentage of ripe
                                                      with Bushy-crested Hornbill (N=13). Both have
fruits primarily based on changes of color due
                                                      similar body size, fruit-animal diet, and live
to ripeness (% ripe fruit). We also calculated the
                                                      in groups (Kinnaird and O’Brien 2007). In the
percentage of canopy covered by ripe fruits
                                                      analysis, we calculated a combined detection
(% ripe in canopy = proportion of ripe fruit x
                                                      probability for both species and post-stratified
proportion of fruit in canopy x 100). The identi-
                                                      the density estimate by species (Marthy et al.
fied tree species were then compared with the
                                                      2016).
hornbill fruit diet list in Bukit Barisan Selatan
National Park, Southern Sumatra (WCS-IP un-
published data) and supplemented with field
                                                      To examine the model goodness of fit, we used
observation to create a list of hornbill fruit diet
                                                      the Chi-square test. We selected the best fit
in Ketambe.
                                                      model with the lowest Akaike’s Information Cri-
                                                      terion (AIC) from the set of models (Buckland
                                                      et al. 2001). If two or more models have similar
Data analysis
                                                      AIC values (∆AIC < 2), we examined the detec-
We calculated the hornbill density estimates          tion curves, model fitness, and the percentage
using Distance 7.3 (Thomas et al. 2010). A tran-      of coefficient of variation (% CV) of the density
sect was assigned as the sampling unit and all        estimates. We selected the preferred model if
hornbill detections per transect were compiled        the curve has continuous diagram with proba-
from five survey replications. The total survey       bility of detection near transect g(0) ~ 1, higher
effort was 33.9 km (total transects length of 6.78    chi-square p-value, and lower % CV (Buckland
km x 5 replications). We evaluated the uniform,       2006). Densities were presented as the number
half-normal, and hazard rate functions with key       of birds per km2 ± % CV.
adjustments as suggested by Buckland et al.
                                                      To assess the relationship between hornbill
(2001) for each hornbill species. We right-trun-
                                                      detections and fruit availability, we used the

5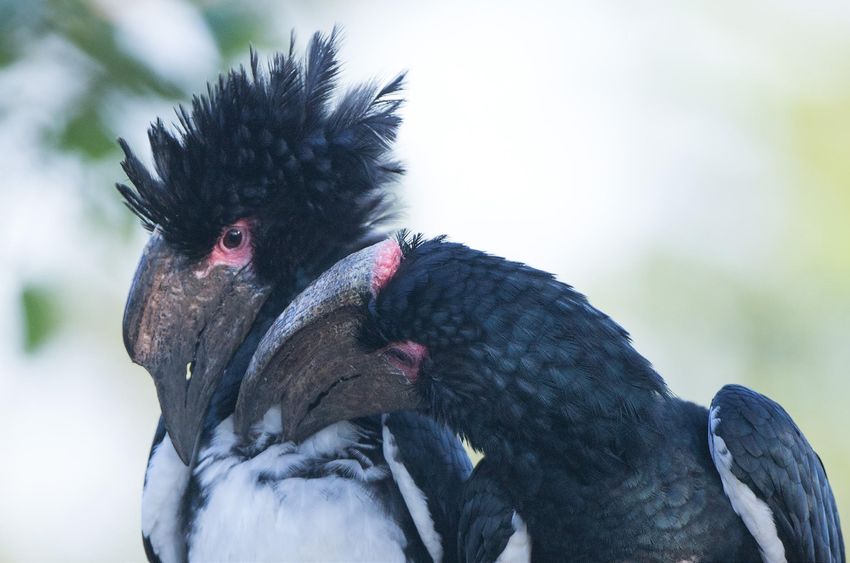
IUCN HSG

Table 1. Density estimates of four hornbill species in the lowland part of Ketambe Research Station site
during July-September 2019 surveys.

                                                                                    Density (ind/km2)
                                             Average    Probability
                                 No. of
    Species                                   group         of
                               detections                                             Lower     Upper
                                               size     detection        Estimate                         CV
                                                                                      95% CI    95% CI

    Wreathed hornbill              86          2.00         0.31          39.26        25.68     60.01   19.10

    Rhinoceros hornbill            37          1.38         0.69           3.05        1.30      7.11    34.10

    Bushy-crested hornbill         13          7.26         0.54           6.06        2.37      15.51   38.80

    White-crowned hornbill         4           3.50        0.43a           0.51        0.12      2.20    67.46

    Helmeted hornbillb             1             -            -             -            -         -       -
    Probability of detection was combined with Bushy-crested hornbill.
    a

    Insufficient number of detections for density analysis.
    b

negative binomial regression model that ac-                sities ranged from 39.6 individuals (ind)/km2 ±
counts for over-dispersed count data (Dobson               19.1% for Wreathed hornbill to 0.51 ind/km2
and Barnett 2008). We assigned the number of               ± 67.46% for White-crowned hornbill. Overall,
hornbill detections per survey (detections) as             the analysis generated reasonably precise den-
the response variable. Relationships between               sity estimates indicated by the CV < 40%. An
explanatory variables were evaluated using                 exception occurred for White-crowned hornbill
correlation test with cut-off R value of 0.70 used         estimate, which has a high CV due to limited
in ecological studies (Mackenzie et al. 2006).             detections.
Two final explanatory variables were used: 1)
mean percentage of canopy covered by fruits
(% fruit in canopy) and 2) mean percentage of              Relationship between fruit availability and
canopy covered by ripe fruits (% ripe in can-              hornbill detections
opy). Models were ranked using AIC and the                 We recorded 166 observations of fruiting trees,
best fit model was selected. We then identified            consisting of 16 species within nine families
the significant variables for hornbill detection           during the survey (Appendix 1). A comparison
based on the model output.                                 between seven explanatory models showed
                                                           that the model “Hornbill.detection ~ % ripe in
                                                           canopy” was the best fit model with the lowest
Results
                                                           AIC (Table 2). We found that the mean percent-
Hornbill density estimates                                 age of canopy covered ripe fruits was a signifi-
We recorded a total of 141 detections of                   cant explanatory variable for hornbill detection
five hornbill species: Wreathed, Rhinoceros,               (Table 3). Nevertheless, we acknowledged the
Bushy-crested, White-crowned, and Helmeted                 possibility that not all fruit species consumed
hornbills. Aural detections accounted for 58% of           by hornbills in Ketambe were observed and
total detections. We were able to estimate four            verified. We also put caution on the limited
species densities except for Helmeted hornbill             sample size for replications (N = 5) when per-
that was only detected once (Table 1). The den-            forming the analysis.

6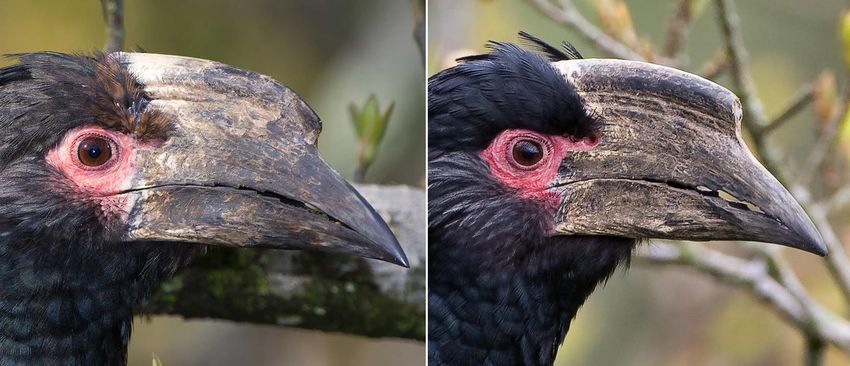
IUCN HSG                                                                        Hornbill Nat. Hist. & Conserv.

Discussion
Information on species population such as den-             In our study site, the Wreathed Hornbill had the
sity estimate is not only important for the conser-        highest density estimates, approximately 5.23
vation managers to assess the species status in            times higher than density in South-west of Su-
their area but also for assessment of their global         matra (Anggraini et al. 2000) and the highest
conservation status (i.e. as in the IUCN species           from all hornbill population studies that utilized
assessment). Here we presented the first density           detection probabilities (McConkey and Chivers
estimates of four hornbill species in Ketambe Re-          2004; Gale and Thongaree 2006; Marthy et al.
search Station derived from sampling methods               2016). Kinnaird and O’Brien (2005, 2007) report-
that utilized detection probability. As one of the         ed the influence of food availability on hornbill
last strongholds of tropical forests in Sumatra,           density, in which the birds follow the figs, a fa-
the density estimates for these four hornbill spe-         vorite dietary item of most hornbills. Here, the
cies (Wreathed, Rhinoceros, Bushy-crested, and             large number of Wreathed hornbills were related
White-crowned hornbills) were relatively higher            to the fruiting seasons of their favorite diet Dys-
compared to other sites in Sumatra, Kalimantan,            oxylum alliaceum which occurred during the first
and Thailand (Table 4). We also found that the             three surveys of this study. From our observation,
ripe fruit abundance had an influence on hornbill          Dysoxylum alliaceum distribution is highly limit-
detection in the study area.                               ed in Leuser Landscape and no documentation

Table 2. Top three negative binomial regression models ranked to assess the performance of food
availability variables in explaining hornbill detections. Models incorporated percentage of canopy
covered by ripe fruits (% ripe) performed better than other predictors.

    Models                                                  AIC       ΔAIC   Resid.df    2 x log-Likelihood

    Hornbill.detection ~ % ripe in canopy                  37.44       0        3              -31.44

    Hornbill.detection ~ % ripe in canopy + % fruit in
                                                           37.87      0.43      2              -29.87
    canopy

    Hornbill.detection ~ % fruit in canopy                 41.06      3.62      3              -35.06

Table 3. Negative Binomial Regression Model describing explanatory variables of hornbill detection
based on the top model. Back transformed coefficients (β) and confidence interval (CI) represents the
strength and direction of influence. Significant variables (p-value < 0.05) are highlighted in bold.

    Explanatory variable of              β                95% CI              z value           p value
    hornbill detection

    Intercept                          7.73              3.14-18.20             4.57             0.000

    % ripe in canopy                   1.07              1.03-1.13              3.02             0.003

7
IUCN HSG
Table 4. Density estimates (individuals/km2 with 95% CI) of hornbill species from this study compared
to other studies accounted for detectability.
South-west South-central Central Southern Ketambec
Sumatra Sumatra Kalimantanb Thailand
Species This study (Van
(Anggraini (Marthy et al. (McConkey and (Gale et al. Schaik et
et al. 2000) 2016) Chivers 2004) 2006) al. 1992)
Wreathed 39.26 7.50a + 0.10 0.69 4.12
hornbill (25.68-60.01) (0.40-1.18) (1.19)
Rhinoceros 3.05 2.60 1.20 3.70 2.69 2.39
hornbill (1.30-7.11) (0.70-2.10) (2.50-4.90) (1.99-3.64) (0.91)
Bushy- 6.06 3.05 4.60 5.50 0.64 4.89
crested
hornbill (2.37-15.51) (1.70-12.20) (0.32-1.28) (3.06)
White- 0.51 + + 0.30 0.08 -
crowned
hornbill (0.12-2.20) (0.03-0.24)
Helmeted + 1.90 0.40 0.70 1.21 0.42
hornbill (0.20-0.70) (0.81-1.82) (0.20)
+ Species present
- Species absent
a
Density estimate calculated from Distance but without information on CI.
b
Density for Rhinoceros hornbill was calculated from distance sampling; other species were estimated from
strip transects
c
Used multiple triangulation method in January 1992; density estimates were presented with standard
deviation (SD).
has been recorded in other locations outside Helmeted hornbills which could lead to competition
Ketambe yet. between these two species. Helmeted hornbills are
rarely present in Ketambe; thus, we expect Rhinoc-
eros hornbills to dominate food sources and result
The detections of Wreathed hornbill were de- in higher density.
creased in last two surveys, potentially because
they were foraging on fruits outside the study area,
as Wreathed hornbill have large home range up to Bushy-crested hornbill density was also consid-
2400 ha (Kitamura 2011). erably higher in Ketambe. This species strongly
avoids disturbed areas and prefer closed-canopy
forest (Anggraini et al. 2000). As Ketambe is sur-
The density of Rhinoceros hornbill was also higher rounded by human settlements and plantations in
than in other studies. As this species is highly frugiv- the eastern side, our study site represents an ideal
orous and favored figs (Hadiprakarsa and Kinnaird habitat for this species. However, we also observed
2004; Kitamura 2011), the numerous fig trees in Bushy-crested hornbills in our secondary forest site
Ketambe provide abundant food supplies. Further- next to the Alas River. This observation indicated
more, Hadiprakarsa and Kinnaird (2004) observed that Bushy-Crested might not be as highly sensitive
similar diet preferences between Rhinoceros and to disturbed areas as previously reported.
8IUCN HSG Hornbill Nat. Hist. & Conserv.
This study also provides the density of rare ed the presence of Wrinkled hornbill and Black
White-crowned hornbill, the first in Sumatra. hornbill. Great hornbills are present in forests
This omnivorous species has a substantial meat around Ketambe and usually are found togeth-
diet but limited information of its fruit-meat diet er with a flock of Rhinoceros hornbills in fruit-
has been published (Kinnaird and O’Brien 2007; ing trees (ARW and MI, personal observation).
Kitamura 2011). Thus, their density might be However, these three species were not detect-
influenced by not only fruit supplies, but also ed in this survey. We have limited knowledge
small animals and insects, requiring further as- of the absence of Great, Wrinkled, and Black
sessments. It is worth noting that White-crowned hornbills. Without ruling out the possibility of
hornbill density was generated through the poaching, we suspect the competition with
multi-species framework in Distance (Alldredge abundant closely-related species like Wreathed
et al. 2007), which can be useful in estimating and Wrinkled or Rhinoceros and Great hornbills
density of rare species in future studies. might contribute to this lack of detection which
requires further investigation.
While there is no estimate for Helmeted hornbill
density in Ketambe, the single aural detection in- Previous studies reported the increase of horn-
dicated a much lower density compared to other bill abundance in relation to fruit availabili-
studies. The scarcity of Helmeted hornbill detec- ty (Kinnaird et al. 1996; Anggraini et al. 2000;
tion might have resulted from illegal poaching in Naniwadekar et al. 2015). This study found that
Ketambe that started in the early 2010s due to overall hornbill detections were positively cor-
rapid demand of the hornbill casques (Beastall related with the percentage of ripe fruits in the
et al. 2016). Since 2011, the research and patrol canopy. Our findings confirmed the importance
activities within Ketambe Research Station were of ripe fruits reported by Anggraini et al. (2000),
interrupted until 2015, thus routine protections as we observed hornbills were attracted to the
were absent during that period. The population trees with abundant ripe fruits. The ripe fruits
decrease was confirmed by van Schaik’s study provide more sugar and nutrients than unripe
(cited from Kinnaird et al. 1996) that reported fruits, thus they are preferred by hornbills (Had-
higher density of this species in Ketambe three iprakarsa and Kinnaird 2004; Kitamura 2011). A
decades ago (0.42 ind/km2), although differenc- notable observation of this relationship was the
es in survey method and analysis were acknowl- Wreathed hornbill in Ketambe. Their detections
edged. This decrease was also reported by lo- were significantly lower in the last two surveys
cal research staff including authors MI, ARW, because there were no ripe fruits of Dysoxylum
and IBR who frequently encountered Helmeted alliaceum present.
hornbills in 1990’s and 2000’s. We suggested
poaching as the main factor for low detection of
Helmeted hornbill in the study area as there was Implications for hornbill conservation
no notable habitat loss or disruption in Ketambe management
and the fruiting trees, especially figs, were still Our study provides reliable baseline density
present in large numbers. data of four hornbill species in Ketambe Re-
search Station, Leuser Landscape. The findings
confirm the importance of Ketambe for hornbill
Previous study in Ketambe site by van Schaik
conservation indicated by overall species higher
in 1992 (cited from Kinnaird et al. 1996) report-
densities, especially Wreathed hornbills which
9IUCN HSG
to our knowledge is the highest ever documented Buckland ST. 2006. Point-transect surveys for song-
from studies utilized detection probabilities (Table birds: Robust methodologies. The Auk 123:345–
357.
4). Future research is needed to better understand
the population and ecology of hornbills in the Le- Buckland ST, Anderson DR, Burnham KP, Laake JL,
Borchers DL, Thomas L. 2001. Introduction to dis-
user Landscape. Firstly, as hornbill densities fluctu-
tance sampling: estimating abundance of biolog-
ate over time in relation to fruit supplies, long term ical populations. Oxford University Press, Oxford.
monitoring (e.g. monthly and yearly) is needed to Butchart SHM et al. 2010. Global Biodiversity : Indica-
identify the population dynamics. Secondly, as the tors of Recent Declines. Science 328:1164–1168.
current study only cover a small portion of the Leus- Dobson AJ, Barnett AG. 2008. An introduction to
er Landscape, we suggested conducting population generalized linear models, 3rd edition. CRC Press,
surveys in additional sites in this landscape. Thirdly, Boca Raton.
hornbill foraging behavioral studies are needed to Gale GA, Thongaree S. 2006. Density estimates of nine
identify the species and characteristics of fruits and hornbill species in a lowland forest site in southern
animals consumed by hornbills. Finally, as Ketambe Thailand. Bird Conservation International 16:57–69.
is located next to human settlements, comparative Hadiprakarsa YY, Kinnaird MF. 2004. Foraging charac-
studies of hornbill densities between pristine, edge, teristics of an assemblage of four Sumatran hornbill
species. Bird Conservation International 14:53–62.
and disturbed habitats could provide important in-
formation on hornbill responses to disturbances. Hardus ME, Lameira AR, Menken SBJ, Wich SA. 2012.
Effects of logging on orangutan behavior. Biologi-
cal Conservation 146:177–187.
Acknowledgments Hoffmann M et al. 2010. The impact of conservation
on the status of the world’s vertebrates. Science
We thank Marsya Christyanti and Laji Utoyo for their valu- 330:1503–1509.
able inputs during the study implementation and man-
uscript preparation. We thank Timothy G. O’Brien and IUCN. 2019. The IUCN Red List of Threatened Species.
Jarryd Alexander for their detailed comments to improve Version 2019-2. Available from https://www.iucnre-
the manuscript. Special thanks to the anonymous donor dlist.org (accessed October 25, 2019).
who supported this study. Kamal S, Agustina E, Azhari. 2018. Populasi burung
rangkong badak (Buceros rhinoceros) di ekosistem
Tahura Pocut Meurah Intan Provinsi Aceh. Jurnal Bi-
References otik 6:11–16.
Alldredge MW, Pollock KH, Simons TR, Shriner SA. Karanth KU, Nichols JD. 1998. Estimation of tiger den-
2007. Multiple-species analysis of point count data: sities in India using photographic captures and re-
A more parsimonious modelling framework. Jour- captures. Ecology 79:2852–2862.
nal of Applied Ecology 44:281–290. Kinnaird MF, O’Brien TG. 2005. Fast foods of the for-
Anggraini K, Kinnaird M, O’Brien T. 2000. The effects est: The influence of figs on primates and hornbills
of fruit availability and habitat disturbance on an as- across wallace’s line. Pages 155–184 in J. . Dew and
semblage of Sumatran hornbills. Bird Conservation J. P. Boubli, editors. Tropical Fruits and Frugivores:
International 10:189–202. The Search for Strong Interactors. Springer, The
Netherlands.
Ariefiandy A, Purwandana D, Coulson G, Forsyth DM,
Jessop TS. 2013. Monitoring the ungulate prey of Kinnaird MF, O’Brien TG. 2007. The ecology and con-
the Komodo dragon Varanus komodoensis : dis- servation of Asian hornbills: farmers of the forest.
tance sampling or faecal counts? Wildlife Biology University of Chicago Press, Chicago.
19:126–137. Kinnaird MF, O’Brien TG, Suryadi S. 1996. Population
Beastall C, Shepherd CR, Hadiprakarsa Y, Martyr D. fluctuation in Sulawesi Red-knobbed hornbills:
2016. Trade in the Helmeted Hornbill Rhinoplax tracking figs in space and time. The Auk 113:431–
vigil: The “ivory hornbill.” Bird Conservation Inter- 440.
national 26:137–146.
10IUCN HSG Hornbill Nat. Hist. & Conserv.
Kitamura S. 2011. Frugivory and seed dispersal by structure development and contested forest gov-
hornbills (Bucerotidae) in tropical forests. Acta ernance threaten the Leuser Ecosystem, Indonesia.
Oecologica 37:531–541. Land Use Policy 77:298–309.
Mackenzie DI, Nichols JD, Royle JA, Pollock KH, Bai- Thomas L, Buckland ST, Rexstad EA, Laake JL, Strind-
ley LL, Hines JE. 2006. Occupancy estimation and berg S, Hedley SL, Bishop JRB, Marques TA, Burn-
modeling: inferring patterns and dynamis of spe- ham KP. 2010. Distance software: Design and analy-
cies occurence. Academic Press, London. sis of distance sampling surveys for estimating pop-
ulation size. Journal of Applied Ecology 47:5–14.
Margono BA, Potapov P V, Turubanova S, Stolle F, Han-
sen MC. 2014. Primary forest cover loss in Indone- van Schaik CP, Mirmanto E. 1985. Spatial variation in
sia over 2000–2012. Nature Climate Change 4:1–6. the structure and litterfall of a Sumatran Rain Forest.
Biotropica 17:196–205.
Marthy W, Clough Y, Tscharntke T. 2016. Assessing the
biodiversity value of degraded lowland forest in Su- Wich SA, Sterck EHM, Utami SS. 1999. Are orang-utan
matra, Indonesia. Kukila 19:1–20. forest. females as solitary as chimpanzee females? Folia
Primatologica 70:23–28.
Naniwadekar R, Shukla U, Isvaran K, Datta A. 2015.
Reduced hornbill abundance associated with low Wich SA, Utami-Atmoko SS, Mitra Setia T, Djoyosud-
seed arrival and altered recruitment in a hunted and harmo S, Geurts ML. 2006. Dietary and energet-
logged tropical forest. PLoS ONE 10 (3): e0120062. ic responses of Pongo abelii to fruit availability
doi:10.1371/journal.pone.0120062 fluctuations. International Journal of Primatology
27:1535–1550.
Sloan S, Campbell MJ, Alamgir M, Collier-Baker E,
Nowak MG, Usher G, Laurance WF. 2018. Infra-
Appendix 1. Summary of observed fruiting trees categorized by family.
Family Species No. of observation
Annonaceae Canangium odorata 12
Cluciaceae Garcinia dioica 6
Combretaceae Terminalia bellirica 6
Elaeocarpaceae Elaeocarpus petiolatus 3
Euphorbiaceae Sapium baccatum 1
Meliaceae Dysoxylum alliaceum 98
Moraceae Antiaris toxicaria 1
Ficus altissima 5
Ficus annulata 1
Ficus benjamina 2
Ficus drupacea 2
Ficus obscura 8
Ficus parietalis 1
Ficus sp. 8
Myristicaceae Knema laurina 11
Sapindaceae Pometia pinnata 1
11IUCN HSG
Genetic monogamy in Von der Decken’s and Northern
Red-billed hornbills
Margaret F. Kinnaird1* and Timothy G. O’Brien2
1
World Wide Fund for Nature International, Nairobi, Kenya
2
Wildlife Conservation Society, Nairobi, Kenya
*Corresponding author - mkinnaird@wwfint.org
Abstract
Avian monogamy is usually characterized by pair bond between a male and female, often
social monogamy, a cooperative pair bond
characterized by cooperation in resource ac-
rather than genetic monogamy, a pair bond ac-
companied by fidelity. Hornbills (Bucerotidae, quisition and parental care (Bennett and Ow-
Bucorvidae) have a range of monogamous so- ens 2002). Genetic monogamy is defined as an
cial systems, but only one species, Monteiro’s exclusive pair bond accompanied by exclusive
hornbill (Tockus monteiri) has been confirmed
parentage or fidelity (Gowaty 1996, Reichard
to be genetically monogamous. We exam-
ined paternity patterns for two Tockus species, 2003). Social and genetic monogamy are not
Northern Red-billed hornbill (T. erythrorynchus) always equivalent; on average, 12.5% of off-
and Von der Decken’s hornbill ( ). spring of socially monogamous species result
We collected blood from females and chicks from extra-pair copulations (Bennett and Owen
in nestboxes, and the putative father deliver-
ing food to the nestbox, or accompanying ju- 2002).
venile birds. Paternity was determined using a
double-digest restriction site-associated DNA
sequencing (ddRAD-seq). All males delivering Asian hornbill species exhibit four monoga-
food for both species (n = 35 males). For males mous social systems including nomadic pairs,
accompanying juveniles, 14 of 15 putative fa- part-time territorial pairs, year-round territorial
thers were identified as the genetic father. Our
results extend the occurrence of genetic mo- pairs, and territorial family groups (Kinnaird and
nogamy to three species of Tockus hornbills. O’Brien 2007). Among African hornbills, savan-
na species including ground-hornbills (Bucor-
vus spp.) and Tockus hornbills (Tockus spp.) are
Keywords: genetic monogamy, Tockus hornbills,
pair bonds, fidelity the best studied (Kemp 1995). Ground-hornbills
are cooperative breeders on large territories
and savanna Tockus hornbills are monogamous
Introduction pairs on part-time or year-round territories.
Avian monogamy has been a topic of inter-
est for many decades (Lack 1968). However,
Only one study has been published on genet-
only recently has social monogamy been dis-
ic monogamy in a hornbill species, Monteiro’s
tinguished from genetic monogamy. Social
Hornbill (Tockus monteiri) in Namibia (Stanback
monogamy (85% of bird species) is defined
et al. 2002), where blood was obtained from 38
as an exclusive living arrangement involving a
hornbill families including 138 chicks. No evi-
12 Vol. 1(1): 12–16, 2020IUCN HSG Hornbill Nat. Hist. & Conserv.
dence of extra-pair copulations was found and door for examining the female and chicks (Fig.
all chicks were assigned to their putative father. 1). Boxes were placed in trees or on 4 m poles
In this paper, we report on the results of a pa- along service roads. Boxes were examined ev-
ternity analysis of chicks of two African savanna ery 4 days. Blood samples were obtained from
hornbill species, Von der Decken’s hornbill (T. females in nestboxes after chicks were hatched,
deckeni) and Northern Red-billed hornbill (T. and from chicks 2 weeks after hatching. Finally,
erythrorhynchus) in northern Kenya. males delivering food to nest boxes were cap-
tured using mist nests placed in front of nest
boxes and using recorded male hornbill calls
Methods as an audio lure. All hornbills were tagged with
This project was conducted at the Mpala Ranch a National Museums of Kenya metal identifica-
and Research Center, Laikipia County, Ken- tion leg band and colored plastic leg bands.
ya (0.284 – 0.5248 N and 36.828 – 36.8838
E). Mpala Ranch is a 200 km2 cattle ranch and
Genetic analysis was conducted at the Cornell
wildlife conservancy. Topographically, Mpala
Laboratory of Ornithology to identify the genet-
Ranch consists of rolling hills, an uplifted pla-
ic parentage of chicks. They used a double-di-
teau, granitic inselbergs, and is bordered by
gest restriction site-associated DNA sequenc-
rivers along more than half of its boundary. An-
ing (ddRAD-seq: Puritz et al. 2014) analysis.
nual rainfall averages 594 mm in the south and
This approach simultaneously locates single nu-
430 mm in the north, with rains typically occur-
cleotide polymorphisms (SNP) and genotyping
ring during April-May and October-November.
steps and is optimized to return a statistically
Droughts are sporadic, but increasing in fre-
powerful set of SNP markers (typically 150-600
quency (Franz 2007). The landscape is covered
after stringent filtering) from large numbers of
by bushland dominated by Acacia mellifera, A.
individuals (up to 240 per run). For full details of
etbaica, A. brevispica, and Grewia tenax, and
the analysis, see Thrasher et al. (2017).
by A. drepanolobium open woodland. Hornbill
species observed on the ranch include Eastern
yellow-billed (T. flavirostris), Crowned (T. albo-
Results
terminatus), Northern red-billed (T. erythroryn-
chus), Von der Decken’s (T. deckeni), African We monitored 10 Northern red-billed horn-
grey (T. nasutus) and Silvery-cheeked hornbills bill (NRBH) successful nesting events in 2012
(Bycanistes brevis). Only Von der Decken’s and (n = 2), 2013 (n = 3), and 2015 (n = 5) involv-
Northern red-billed hornbills have been ob- ing nine females and 19 chicks, and captured
served to breed on Mpala. four young juvenile birds with putative fathers
in walk-in traps. For Von der Decken’s hornbills
(VDDH), we monitored 27 successful nesting
We used three strategies to capture hornbills. events in 2012 (n = 2), 2013 (n = 9), 2014 (n = 6)
First, we used walk-in traps, baited with pea- and 2015 (n = 10) involving 26 females and 40
nuts and set around the Mpala Research Cen- chicks, and 11 capture events involving young
ter from 2011 to 2015. Second, we deployed juveniles traveling with an adult. For chicks
90 nest boxes during the breeding seasons of banded and bled at the nest site, we had 100%
March – July 2012 through 2015. Boxes were assignment of social father to genetic father for
25 x 20 x 50 cm with a 6 cm diameter entrance, both species. For four cases of juvenile NRBH
a perch below the hole, and a lockable side captured with an associated adult male, in all
13IUCN HSG
Fig. 1. Male Von der Decken’s hornbill delivering a beetle to female in nestbox.
cases, the adult male was the genetic father. believed that the threat of withholding food
For 11 cases of juvenile VDDH captured with from females was sufficient to constrain her,
an associated adult male, in 10 of 11 cases, the since female Tockus hornbills generally molt tail
male was identified as the genetic father. and wing feathers during incubation and are
unable to fly, and male desertion would doom
the female and her chicks. Such conflict-medi-
Discussion ated reproductive strategies assume that costs
Our results extend the finding of genetic mo- incurred are tolerable for (at least) one sex and
nogamy in Montiero’s hornbill (Stanbeck et al. that one sex gains at a cost to the other (Mock
2002) to two additional Tockus species, North- and Forbes 1992).
ern red-billed and Von der Decken’s hornbills.
Tockus hornbills exhibit several characteristics
Stanback et al. (2002) note that mate guarding
of long-term monogamy including year-long
is not particularly strong in Montiero’s hornbills
associations, territoriality, courtship feeding
and Finnie (2012) found the same in Southern
and sperm storage. Mulder et al. (1994) argued
yellow-billed hornbills (T. leucomelas). This
that any tendency toward extra pair copula-
loose guarding, combined with sperm storage,
tions in birds would be a compromise between
allows for the possibility of extra-pair copula-
females seeking genetically superior males and
tions prior to entering the nest. Purple Sand-
her dependence on male provisioning during
pipers (Calidris maritima) are long-lived, social-
nesting. Gowaty (1996) also believed that the
ly monogamous sandpipers also characterized
female should always seek a genetically superi-
by strong mate and territory fidelity, high male
or male and that socially bonded males should
parental investment and loose mate guarding,
attempt to restrict access to females through
that rarely seek extra-pair copulations (Pierce
mate guarding or other constraints. Gowaty
14IUCN HSG Hornbill Nat. Hist. & Conserv.
and Lifjeld 1998). Both Stanback et al (2002) evolved as an anti-predator behavior which in
and Pierce and Lifjeld (1998) argue that, when turn led to long-term sperm storage, high male
male paternal investment is high, the females investment, and cooperation over conflict. We
have little to gain from extra-pair copulations argue that if nest sealing was an effective an-
and should resist extra-pair copulations, mak- ti-predator behavior, it should have evolved
ing male attempts energetically expensive. more often among cavity nesters (Kinnaird and
Stanback et al. (2002) also argue that the com- O’Brien, 2008). Although hornbills have higher
plete dependence of female and chicks on nesting success than other cavity nesting spe-
male provisioning results in a strong overlap in cies, the result is not significantly different. We
reproductive interests of males and females, re- believe that female nest sealing evolved as a
sulting in cooperation rather than conflict. female strategy to ensure the cooperation of
the male.
For seven females (NRBH = 1 and VDDH = 6)
that nested at least twice during our study, we Our study strengthens the argument that Tock-
found that the same male was the father af- us hornbills are genetically monogamous as
ter two to four years, indicating extended pair well as socially monogamous. It also leads us
bonds in both Tockus species. Based on the to question whether the pattern of genetic mo-
observation of extended pair bonds in horn- nogamy will hold for Asian hornbills and the
bills, overlap in reproductive interest, and high forest hornbills of Africa. Given the increasing
male parental investment, we agreed with Stan- use of nest boxes to augment hornbill nesting,
back et al. (2002) that mate choice by females there is a greater opportunity to test for pater-
is based on provisioning skills rather than phe- nity within other hornbill genera.
notypically expressed genetic superiority (Kin-
naird and O’Brien, 2008). Females should try
Acknowledgments
to retain a good male provider. Since male pro-
vision is equal to female reproductive success, This study was funded by the National Geographic
Society, Wildlife Conservation Society, Chester Zoo,
and inferior male providers will either kill the
and Mpala Research Center.
female and chicks or force the female to aban-
don the chicks, females should only engage
with untested males under three conditions; a References
female mating for the first time, a female who Bennett PM and Owens IPF. 2002. Evolutionary
has abandoned an inferior male provider, or a Ecology of Birds: Life Histories, Mating Systems
female who has lost a mate. Females abandon- and Extinctions. Oxford Series in Ecology and
Evolution. Oxford University Press: Oxford.
ing inferior males may be a common feature
in monogamous systems with extended pair Finnie MJ. 2012. Conflict and communication: con-
sequences of female nest confinement in Yel-
bonds where females use paternal investment
low-billed hornbills. Unpublished PhD disserta-
as a signal of male quality. tion, Cambridge University, Cambridge, UK.
Franz TE, Caylor K, Nordbotten JM, Rodríguez-Itur-
be I, and Celia MA. 2010. An ecohydrological
A distinction between our ideas and those of approach to predicting regional woody species
Stanback et al. (2002) is the order of events in distribution patterns in dryland ecosystems. Ad-
the development of monogamy in hornbills. vances in Water Resources 33:215–230.
Stanback et al. (2002) assume that nest-sealing Gowaty PA. 1996. Battle of the sexes and origins of
15IUCN HSG
monogamy. In: Partnerships in Birds: The Study sandpiper, a species with high paternal invest-
of Monogamy. J Black (Ed), pp. 21–52. Oxford ment. Auk 115:602-612.
University Press: New York.
Puritz JB, Matz MV, Toonen RJ, Bolnick DI, and Bird
Kemp AC. 1995. The Hornbills. Oxford University CE. 2014. Demystifying the RAD fad. Molecular
Press: New York. Ecology 23:5937–5942.
Kinnaird MF and O’Brien TG. 2008. The Ecology Reichard U. 2003. Monogamy: past and present. In:
and Conservation of Asian Hornbills. University Monogamy: Mating Strategies and Partnerships
of Chicago Press: Chicago. in Birds, Humans and Other Mammals I. UH Re-
ichard and C Boesch (Eds), pp. 3–25. Cambridge
Lack D. 1968. Ecological Adaptations for Breeding
University Press: Cambridge.
in Birds. William Clowes: London.
Stanback M, Richardson DS, Boix-Hinzen C, and
Mock DW and Forbes LS. 1992. Parent-offspring
Mendelsohn J. 2002. Genetic monogamy in
conflict: a case of arrested development. Trends
Monteiro’s hornbill Tockus monteiri. Animal Be-
in Ecology and Evolution 7:409–413.
haviour 63:787–793.
Mulder RA, Dunn PO, Cockburn A, Lazenby-Cohen
Thrasher DJ, Butcher BG, Compagna L, Webster
KA, and Howell MJ. 1994. Helpers liberate fe-
MS, and Lovette IJ 2018. Double-digest RAD
male fairy-wrens from constraints on extra-pair
sequencing outperforms microsatellite loci at
mate choice. Proceedings of the Royal Society of
assigning paternity and estimating related-
London, Series B 255:223–229.
ness: a proof of concept in a highly promiscu-
Pierce EP and Lifjeld JT. 1998. High paternity with- ous bird. Molecular Ecology Resources: doi:
out paternity-associated behavior in the Purple 10.1111/1755-0998.12771.
16IUCN HSG Hornbill Nat. Hist. & Conserv.
Long-term monitoring of nesting behavior and nesting habitat of four
sympatric hornbill species in a Sumatran lowland tropical rainforest of
Bukit Barisan Selatan National Park
Marsya C. Sibarani1*, Laji Utoyo1, Ricky Danang Pratama2, Meidita Aulia Danus3,
Rahman Sudrajat1, Fahrudin Surahmat1, and William Marthy1
1
Wildlife Conservation Society-Indonesia Program, Jalan Tampomas no. 35, Bogor 16151 Indonesia
2
Universitas Lampung, Jalan Prof. Dr. Soemantri Brodjonegoro No.1, Bandar Lampung 35145 Indonesia
3
Bukit Barisan Selatan National Park, Jalan Ir. H. Juanda No. 19, Terbaya, Kotaagung, Lampung, 35384 Indonesia
*
Corresponding author: msibarani@wsc.org
Abstract
Hornbills are vulnerable to extinction due to to select nest cavities with entrance facing to-
their low reproductive output and dependence ward north-east direction, while the other horn-
on large trees as nesting sites. However, lit- bill species did not have preferences. Most tree
tle is known about their breeding behavior in species that were used by hornbills for nesting
Sumatra, which is important to plan effective also have high timber value, thus are vulnera-
strategies to save the nine species from extinc- ble to the risk of illegal logging. To ensure the
tion. Here we present the nesting season and survival of hornbills, sufficient number of tree
nest-site characteristics of sympatric hornbills cavities that are suitable for nesting must be
at Way Canguk Research Station, Bukit Bari- maintained.
san Selatan National Park, Sumatra, Indonesia.
We monitored in total 35 tree cavities in two
monitoring periods: 23 tree cavities between Keywords: breeding, bird population, reproduc-
2006 – 2009 and 20 between 2015 – 2018; and tive behaviour, Way Canguk Research Station
recorded the nesting activities of hornbills. We
also measured the characteristics of nest trees,
nest cavities, and vegetation within 20-m radius Introduction
of the nest trees. We found that there was a sig-
nificant decrease of nesting frequency between Ensuring the success of a species’ reproduction
the two monitoring periods, from a mean of is important to safeguard the survival of the
0.058 records/year in 2006 – 2009 to 0.013 species. Understanding species’ reproductive
records/year in 2015 – 2018. Of eight hornbill
species known to occur in the study area, only behavior and breeding habitat suitability are
four were found nesting during the study pe- required to plan effective conservation actions
riods, i.e. Bushy-crested, Helmeted, Rhinocer- (Côté 2003). Hornbills are cavity-nesters that
os, and Wreathed Hornbills. Among the four are dependent on the availability of tree cavi-
species, there were no differences in the height
ties for breeding. They are, however, unable to
of nest cavities, diameter, and height of nest
trees. All species preferred emergent trees and excavate their own nesting cavities (Poonswad
trees with big trunks as nesting sites. Wreathed 1995), but rather occupy cavities formed by the
Hornbill preferred nests with more vertical- decay of broken branches or excavated by other
ly-elongated nest entrance compared to the
birds such as woodpeckers and barbets (Datta
other three species which were found nesting
in oval cavities. Bushy-crested Hornbill seemed and Rawat 2004, Supa-Amornkul et al. 2011).
17 Vol. 1(1): 17–29, 2020IUCN HSG
Hornbills’ nesting cavities are usually located in cline of nesting success in hornbill population
large and tall trees (Poonswad 1995, Mudappa (Cahill and Walker 2000) and the population
and Kannan 1997, Utoyo et al. 2017), which are decline of some hornbill species (Anggraini et
rare in logged forests because the trees with al. 2000). Helmeted Hornbill is highly hunted
such characteristics are also of high timber val- for their dense casques that are used for carv-
ue (Mudappa and Kannan 1997, Collar 2015). ing—around 2,170 casques were seized from
illegal market in Indonesia and China between
2012 and 2014 (Beastall et al. 2016).
Hornbills occur sympatrically with a number of
other hornbill species across their ranges. As
frugivores and cavity-nesters, they have over- The island of Sumatra harbors nine species of
lapping niche, but some sympatric hornbills hornbills among the 62 hornbill species found
also exhibit resource partitioning on foraging globally and among the 13 species found in
strategies and nest cavity preferences. In Su- the Indonesian archipelago. Of the nine spe-
matra, Helmeted hornbill Rhinoplax vigil and cies, one is listed as Critically Endangered, two
Rhinoceros hornbill Buceros rhinoceros tend as Endangered, and four as Vulnerable on the
to predominantly feed on figs, while the diet IUCN Red List of Threatened Species (IUCN
of Bushy-crested hornbill Anorrhinus galeri- 2019). There are only few studies on hornbill
tus and Wreathed hornbill Rhyticeros undula- nesting behavior in Indonesia (Marsden and
tus primarily consists of oily drupaceous fruits Jones 1997, Kinnaird and O’Brien 2007, Ra-
(Hadiprakarsa and Kinnaird 2004). Helmeted hayuningsih et al. 2017). Particularly, not much
hornbills are found more frequently in the up- is known about hornbill nesting cycle and nest-
per canopy relative to the other sympatric spe- ing site characteristics in Sumatra. In this study,
cies (Hadiprakarsa and Kinnaird 2004). Great we aimed to (1) estimate the nesting period
hornbill Buceros bicornis tend to use larger of four sympatric hornbills, and (2) assess the
cavities, while Oriental Pied hornbill Anthra- characteristics of the hornbills’ nest cavities,
coceros albirostris used smaller ones in India nest trees, and nest sites at Way Canguk Re-
(Datta and Rawat 2004). Poonswad (1995) also search Station (WCRS), one of the last Suma-
reported differences in nesting tree diameter, tran lowland rainforests.
tree height, and nest cavity dimensions among
four sympatric hornbills in Thailand.
Methods
Study area
Compared to the other forest birds, hornbills
We conducted long-term tree cavity monitor-
have distinctively larger body size which is
ing at Way Canguk Research Station (WCRS),
linked to lower reproductive output, longer
Bukit Barisan Selatan National Park (BBSNP),
generation spans, and dependence on large
Lampung Province, Sumatra, Indonesia (Fig.
tree cavities (Gonzalez et al. 2013). Therefore,
1). The research area covers 800 ha of lowland
it will take a long time to reverse population
dipterocarp forest which ranges between 15 –
declines. Unfortunately, hornbills face high
70 m above sea level. The forest is a mixture of
threats of extinction due to habitat loss, habi-
intact primary forest and secondary forest dis-
tat disturbance, forest fragmentation, and ille-
turbed by past forest fires and illegal logging.
gal hunting (Kinnaird and O’Brien 2007). Forest
The annual rainfall during the study periods
fires are known to be associated with the de-
(2006 to 2018) ranged between 2459 – 4620
18IUCN HSG Hornbill Nat. Hist. & Conserv.
mm, with a mean of 3347 (SD = 644) mm. The
research area experiences two seasons: dry sea-
son during March-September (driest month in
August with a mean rainfall of 91 mm/month)
and rainy season during October-April (wettest
month in November with a mean rainfall of 519
mm/month). Eight hornbill species have been
recorded in the research area: Black hornbill An-
thracoceros malayanus, Bushy-crested hornbill,
Great hornbill, Helmeted hornbill, Oriental Pied
hornbill, Rhinoceros hornbill, White-crowned
hornbill Berenicornis comatus, and Wreathed
hornbill.
Tree cavity monitoring Fig. 1. The location of Way Canguk Research
Station in Bukit Barisan Selatan National Park,
We recorded the locations of trees with cavi- Sumatra, Indonesia.
ties found within the 800 ha research area ad
libitum during other biodiversity monitoring
We calculated nesting frequencies for each
or research. Each month throughout the year
individual tree. To account for unequal mon-
since 2006, we monitored the tree cavities and
itoring effort for each tree (Fig. 2), we includ-
recorded the occurrence of nesting hornbills.
ed monitoring effort in the calculation instead
If there were hornbills nesting in a tree cavi-
of simple counts of nest records. A record of
ty, we monitored their activities for three days
hornbill occupying a cavity was included in the
each month (average interval between visits =
calculation if the hornbills were seen occupying
7 days, SD = 6.9), 4 – 5 hours per day. We re-
the cavity for a minimum of 2 survey-months.
corded their behavior ad libitum and we tried to
Survey effort was defined as the number of sur-
minimize disturbance by frequent visit as these
vey-months, and then converted to years. We
hornbills are really sensitive (based on our field
only calculated nesting frequencies in trees that
observation where once they noticed human
we monitored for a minimum 24 months in each
presence the female will alert the male to not
study period. We then tested for differences be-
approach the nest).
tween the nesting frequencies in 2006 – 2009
and 2015 – 2018 using Wilcoxon rank sum test.
The monitoring data were only available for
2006 – 2009 and 2015 – 2018. We calculated
The duration of nesting cycle was approximated
hornbill nesting frequency (f) during each peri-
by calculating the difference between the first
od using the following formula:
and last date when the hornbills were observed
to occupy the cavity. To estimate the nesting
duration, we only used the observation data if
we had checked the cavity at least a month be-
fore and after the hornbills nesting to allow a
more accurate estimation.
19You can also read