How shape and flapping rate affect the distribution of fluid forces on flexible hydrofoils
←
→
Page content transcription
If your browser does not render page correctly, please read the page content below
This draft was prepared using the LaTeX style file belonging to the Journal of Fluid Mechanics   1
arXiv:2104.10897v1 [physics.flu-dyn] 22 Apr 2021

                                                       How shape and flapping rate affect the
                                                   distribution of fluid forces on flexible hydrofoils
                                                                       Paule Dagenais and Christof M. Aegerter†
                                                      Physik-Institut, University of Zurich, Winterthurerstrasse 190, 8057 Zurich, Switzerland

                                                                                 (Received xx; revised xx; accepted xx)

                                                      We address the fluid-structure interaction of flexible fin models oscillated in a water
                                                   flow. Here, we investigate in particular the dependence of hydrodynamic force distribu-
                                                   tions on fin geometry and flapping frequency. For this purpose, we employ state-of-the-
                                                   art techniques in pressure evaluation to describe fluid force maps with high temporal
                                                   and spatial resolution on the deforming surfaces of the hydrofoils. Particle tracking
                                                   velocimetry (PTV) is used to measure the 3D fluid velocity field, and the hydrodynamic
                                                   stress tensor is subsequently calculated based on the Navier-Stokes equation. The shape
                                                   and kinematics of the fin-like foils are linked to their ability to generate propulsive thrust
                                                   efficiently, as well as the accumulation of external contact forces and the resulting internal
                                                   tension throughout a flapping cycle.

                                                   1. Introduction
                                                     The interplay between fins shapes, elastic properties, hydrodynamic forces, passive
                                                   and controlled kinematics is the subject of persistent and active research (Videler
                                                   1975; Geerlink & Videler 1986; Tangorra et al. 2007; Lauder 2015; Puri et al. 2018).
                                                   Replicating the flexible fins or body of fish using hydrofoils with controlled motion
                                                   programs has proven a powerful tool to investigate the kinematics and propulsive
                                                   forces of swimmers (Shelton et al. 2014). Methods to quantify the fluid velocity field
                                                   are typically based on imaging tracer particles seeded into the flow (PIV/PTV)
                                                   (Maas et al. 1993; Dracos 1996; Raffel et al. 1998; Pereira et al. 2006). The vortex
                                                   wakes and thrust production of flapping foils with various geometries and flexibility
                                                   have been extensively characterized in the literature (Triantafyllou et al. 2004;
                                                   Godoy-Diana et al. 2008; Bohl & Koochesfahani 2009; Kim & Gharib 2010; Green et al.
                                                   2011; David et al. 2012; Marais et al. 2012; Shinde & Arakeri 2014; David et al. 2017;
                                                   Lucas et al. 2017; Muir et al. 2017). Furthermore, many researchers have resorted to
                                                   particle velocimetry experiments in order to quantify the flow field of aquatic animal
                                                   appendages and bioinspired synthetic fins (Blickhan et al. 1992; Stamhuis & Videler
                                                   1995; Müller et al. 1997; Drucker & Lauder 1999; Lauder 2000; Müller et al. 2000;
                                                   Drucker & Lauder 2001; Müller et al. 2001; Nauen & Lauder 2002a,b; Drucker & Lauder
                                                   2005; Müller & Van Leeuwen 2006; Tytell 2006; Lauder & Madden 2007; Tangorra et al.
                                                   2007; Müller et al. 2008; Tytell et al. 2008; Tangorra et al. 2010; Flammang et al.
                                                   2011a,b; Dewey et al. 2012; Esposito et al. 2012; Ren et al. 2016b,a; Mwaffo et al.
                                                   2017).
                                                     The research field making use of PIV/PTV-based pressure evaluation covers
                                                   a large collection of hydrodynamics problems, from micro channel junction flow
                                                   and turbine blades to animal locomotion (Gresho & Sani 1987; Jakobsen et al.
                                                   1999; Baur & Köngeter 1999; Gurka et al. 1999; Fujisawa et al. 2006; Liu & Katz
                                                                     † Email address for correspondence: aegerter@physik.uzh.ch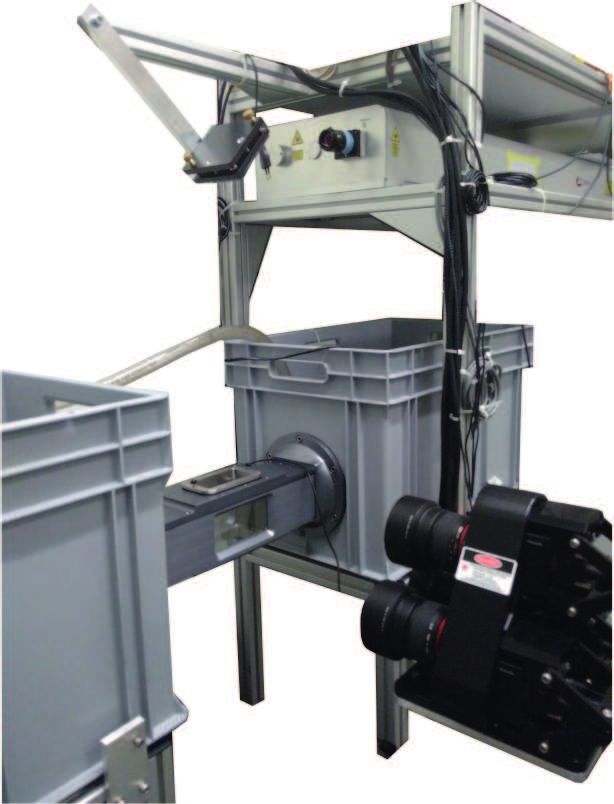
2
2006; van Oudheusden et al. 2006; Murai et al. 2007; van Oudheusden et al. 2007;
van Oudheusden 2008; Windsor 2008; Jardin et al. 2009; Lorenzoni et al. 2009;
Khodarahmi et al. 2010; de Kat & van Oudheusden 2012; Ragni et al. 2012; de Kat & Ganapathisub
2013; Panciroli & Porfiri 2013; van Oudheusden 2013; Dabiri et al. 2014; Joshi et al.
2014; Tronchin et al. 2015; Lucas et al. 2017; McClure & Yarusevych 2017; Mwaffo et al.
2017). Accurate and non-invasive methods to measure the fluid forces directly on the
surface of flapping fins are essential to investigate the mechanisms of underwater
propulsion. In the present work, we combine fluid velocity measurements from 3D
particle tracking velocimetry with hydrodynamic stress calculations based on the
Navier-Stokes equation to obtain well resolved dynamic maps of fluid forces on the
surface of flexible fin-like foils operating in different flow regimes. We address the
long-standing question of how the geometry and kinematics of oscillating hydrofoils
influence their spatio-temporal distributions of hydrodynamic forces. We focus on
the effects of flapping frequency, width, length and edge curvature (straight versus
bilobed). This approach offers a framework to investigate how specific morphological and
kinematic features can constitute an advantage for certain hydrodynamic functions. The
implications of this study reach into the fields of animal aquatic locomotion, as well as
the engineering design of biomimetic underwater vehicles. Such propulsive systems are
gaining importance due to their potential applications in the monitoring, maintenance
and exploration of underwater environments (Low & Willy 2006; Lauder et al. 2007;
Low 2007; Zhou & Low 2012; Qing Ping et al. 2013).

2. Material and Methods
                           2.1. Particle tracking velocimetry
   We use a three-dimensional, three components particle tracking velocimetry approach
(3D-3C PTV) to quantify the flow generated by the synthetic fins. Technical aspects of
three-dimensional PTV are well described in Pereira et al. (2006). The basic principle of
PTV relies on tracer particles seeded in the flow, illuminated by a laser beam and imaged
at regular time intervals to track the position of each particle, allowing the subsequent
reconstruction of the fluid velocity field. Because the aim is to calculate the hydrodynamic
stress tensor from the velocity fields, this experimental method presents several benefits
compared to other techniques such as tomographic or scanning stereo-PIV, the most
outstanding one being the possibility to instantaneously capture the whole flow volume,
allowing for the straight-forward reconstruction of the 3D velocity vectors everywhere
inside that volume.
   The different components of the experimental set up are shown in figure 1 with
their technical specifications. The working fluid is water and the seeding tracers are
polyimide particles with a diameter of ∼50 µm, which have been used in previous
particle velocimetry experiments to investigate the flow fields generated by fish fins
(Flammang et al. 2011a). The measurement volume in our experiments is 50×50×20
mm3 , with an approximate number of 8×10⁴ seeding particles inside that interrogation
domain. Three cameras mounted on a plate in a triangular arrangement are used to
record the 3D fluid velocity vectors ~u = (ux , uy , uz ). The flow chamber has transparent
walls on three sides and a fixation wall on one side for inserting the fin model, actuated
with a servomotor fixed outside the chamber. The hydrofoils are mounted horizontally
inside the tunnel, with their rotation axis parallel to the z axis and perpendicular to
the cameras plate. A frontal perspective would make the detection of the particles more
arduous in front of the fin surface. Water tanks are connected to both sides of the flow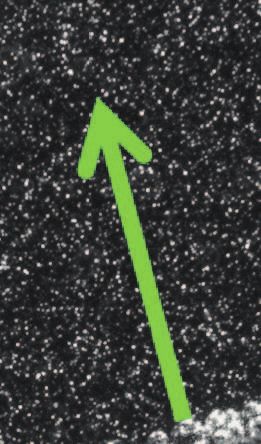
3
chamber in a recirculating system, and a pump is pushing water inside a pipe from one
tank to the other to control the upstream fluid velocity. A flow straightener is installed
at the inlet of the tunnel to insure laminar incoming stream. All the experiments were
performed using the V3V-9800 system (TSI Incorporated, 500 Cardigan Road, Shoreview,
Minnesota 55126 USA), which is characterized in Lai et al. (2008). The laser double pulse
timing and the cameras capturing frequency are synchronized in a method called frame
straddling: the time difference between a pair of position fields is determined by the time
difference between a pair of laser pulses (δt = 2.5 ms), and the rate at which velocity
fields are recorded (80 Hz) is half the cameras acquisition frequency, yielding a time
separation of ∆t=12.5 ms between the velocity fields. The reconstruction of the particles
positions is based on 2D Gaussian fit of the particles intensity distributions and a triplet
search algorithm is used for the 3D positions fields. The velocity vectors are computed by
tracking the particle displacements between subsequent laser pulses, using a relaxation
method to achieve a probability-based matching. These processing steps are conducted
using the V3V software (version 2.0.2.7). An appropriate combination of median filter,
velocity range and smoothing filter was applied to the raw velocity fields to reduce the
noise level and remove the worst outliers. Moreover, a mask is applied over the hydrofoil
during image processing to avoid detecting ghost particles inside its boundary. Finally, the
raw vectors are interpolated on a regular 3D grid using Gaussian interpolation, yielding a
final spatial resolution of 0.75 mm in each direction. Temporal and spatial resolutions were
chosen along recommendations offered in previous studies where the flow velocity field was
used to compute hydrodynamic pressure (de Kat & van Oudheusden 2012; Dabiri et al.
2014; Wang et al. 2017). The grid points inside the hydrofoil boundary, where no particle
is detected owing to the mask, are not attributed a velocity value and are not involved
in the hydrodynamic stress calculation. The closest grid points to the real fin boundary
define a virtual boundary, where the surface distributions of hydrodynamic forces are
evaluated.
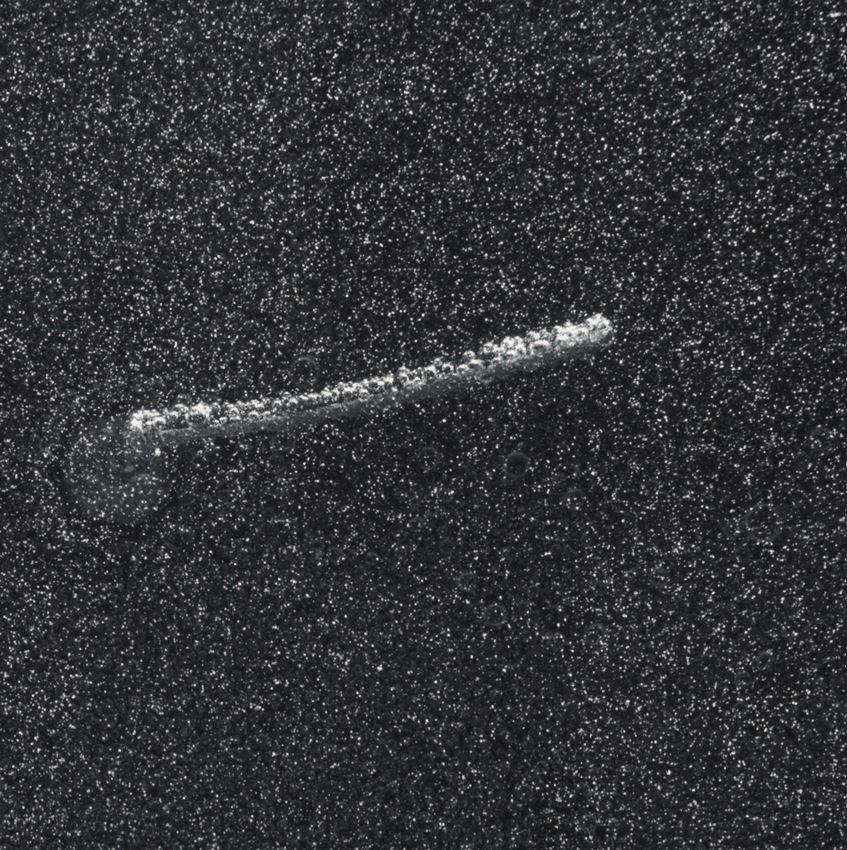
The foil midline is visually tracked over time in the x-y plane (see panel 7 of figure
1). For each time frame, points are manually superimposed on the fin midline and fitted
with a polynomial of degree 2. The 3D hydrofoil is reconstructed based on that fitted
quadratic curve, assuming that deflection occurs only along one axis. The virtual object
has a larger width than the actual foil (0.725 mm away from the real surface on each
side) owing to the fact that the particles can not be resolved directly at the fluid-solid
interface. In order to evaluate if the reconstructed foil boundary is sufficiently close to the
real surface where we want to extract the hydrodynamic pressure, we used the criterion
that the virtual surface should be located within the fluid boundary layer. Based on
the assumption of a laminar boundary layer, its thickness can be expressed as (in the
simplified case of a flat plate) (Prandtl 1952):
r
νx
δ=5 (2.1)
U
We could estimate that the thickness of the fluid boundary layer is >1 mm everywhere
on the fin except at the most proximal region (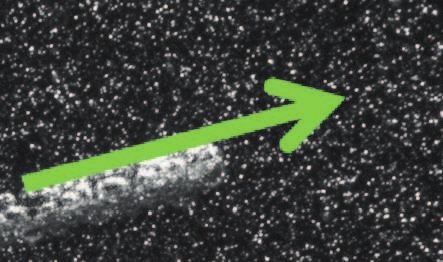
4
                                                    6

                   4

                             3

                                 5
                                                    7
                         2

                                     1
                                                F
              5
                                                        F∥

Figure 1: Experimental set up: (1) camera triplet (4 MP, 85 mm lenses, sensor size
11.3×11.3 mm2 , magnification 0.3, max. frequency 180 Hz) arranged in a triangular
configuration on a plate located at ∼465 mm from the middle of the (2) flow chamber,
illuminated by a (3) laser beam (double-pulsed, Nd:YAG, wave-length 532 nm, max.
120 mJ/pulse) expanded by a pair of cylindrical lenses and deflected by (4) a mirror.
(5) recirculating system composed of two tanks (total volume of ∼160 L) and a pump
connected to a pipe. (6) sketch of the flow chamber with inner dimensions (in mm), top
view (x − z plane) and frontal view (x − y plane), measurement volume (∼50×50×20
mm3 ) indicated with red rectangles, enclosing the trapezoidal fin. (7) example of an
image captured by one of the three cameras, with tracer particles and hydrofoil midline
clearly visible (direction of the free-stream indicated by blue dashed arrows and direction
of the normal and tangential forces indicated by green arrows).

width and thus allows us to verify that the virtual foil boundary provides an accurate
representation of the real surface distributions. This point was verified in a previous
study (Dagenais & Aegerter 2019), where we used a control volume analysis to compute
the forces generated by a flapping fin in similar conditions, and showed that the results
compared favorably to the integrated force distributions over the fin surfaces.

                   2.2. Morphologies and kinematics of the fin models
   The synthetic fins are illustrated in figure 2 and characterized in table 1 and figure 3.
Taking shape A1 as the reference geometry, A2 constitutes a shorter version and shape
B, a wider version. Shape C has the same length as shape A2 , but presents a bilobed
trailing edge. The aspect ratio (AR) of a fin is defined as the square of the span (width
at largest point) divided by the area. Even though the fin models do not mimic any fish
species in particular, their geometries can be compared to caudal fins with low aspect
ratios (AR=0.84 for shape A1 , 1.03 for shape A2 , 1.67 for shape B and 1.1 for shape C).
Examples include the Schistura genus, the Oryzias genus, the zebrafish (Danio rerio) and
the platy fish (Xiphophorus maculatus), as shown in figure 3 (Sambilay 2005; Offen et al.
2008; Parichy et al. 2009; Naruse et al. 2011; Plongsesthee et al. 2012; Bohlen et al. 2016;
Kottelat 2017).
   To produce the foils, a rigid cast of their negative form was 3D printed, then
liquid PDMS (polydimethylsiloxane) was poured inside the cast and the supporting
rod was inserted at the base. The material was cured for 36 hours at 58◦ C.
The resulting flexible membranes have a thickness of 0.55 mm. The proper-
5
ties of the cured PDMS can be found in the MIT material property database
(http://www.mit.edu/~6.777/matprops/pdms.htm). Most importantly, the mass
density matches that of water. A cantilever deflection set up was employed by Sahil Puri
(University of Zurich) to characterize the elastic properties (see Puri et al. (2018); Puri
(2018) for details), yielding a value of 0.8 MPa for the Young’s modulus. An external
velocity of u∞ = 55 mm/s is imposed in all experiments, and the fins are actuated at
their leading edge with a sinusoidal pitching motion with angular amplitude θ0 = 11◦ in
all cases. Shape A1 was selected to test the effects of pitching frequency, using f 1 =1.9
Hz, f 2 =2.8 Hz and f 3 =3.7 Hz. The natural frequency of this fin model (first mode) was
estimated by releasing it from a rest position and measuring the decaying oscillation of
its tip (in water). A value of 2.4 Hz was found, in between the lowest and intermediate
frequencies tested. For the experiments involving shapes A2 , B and C, frequency f 2 =2.8
Hz is used.
Two dimensionless parameters allow to characterize the flow regime of the hydrofoils.
The Strouhal number (St) encompasses the propulsion dependence on tail oscillation.
The Reynolds number (Re) describes the viscous versus inertial effects and determines
the transition from a laminar to a turbulent flow. These parameters are based on the
kinematic viscosity of water (ν), the external fluid velocity (U = u∞ ), the foil length (L),
the flapping frequency (f ) and the tip excursion amplitude (A):
U ·L f ·A
Re = St = (2.2)
ν U
Caudal fins found in nature are extremely diverse and cover a vast range of flow
parameters, depending on species but also on developmental stage and behavior. The
swimming velocities catalogued in the literature usually correspond to the maximal
speeds which fish can sustain for a short time only, yielding Re from 104 to 5×10⁶ (using
the animal body length) (Wardle 1975; Yates 1983; Vogel 1994). These high values are
not representative of slower gaits at which fish can also operate in natural conditions
(Bainbridge 1960; Weerden et al. 2013). For example, based on the vast literature about
zebrafish hydrodynamics, it can be estimated that this species operates at Re in the
range [390-2600] (using the caudal fin length to allow direct comparison with isolated
hydrofoils) (Parichy et al. 2009; Palstra et al. 2010; Mwaffo et al. 2017). In the present
study, Re is situated within [1062-1375] (table 1). Although not characteristic of fast
bursts or maximal velocity locomotion, this flow regime can be compared to the case of
fish cruising at roughly 0.5 to 0.9 body lengths per second, pertinent for certain species
(Sambilay 2005) and specific behaviors such as foraging, chemotaxis and exploration.
Furthermore, studies have demonstrated that fundamental flow features of flapping fin
propulsion can be captured by experiments and simulations performed at Re lower than
values typically measured for fast swimming fish, down to the order of 103 (Lauder et al.
2005; Bozkurttas et al. 2006; Buchholz & Smits 2006; Kern & Koumoutsakos 2006;
Mittal et al. 2006; Bozkurttas et al. 2009; Liu et al. 2017). Indeed, for sufficiently high
Re (> 103 ), this parameter plays a minor role compared to St in defining the flow
topology (Lentink 2008; Green et al. 2011).
In the case of flexible foils, St depends on the tip excursion amplitude and has to be
measured rather than fixed prior to the experiments. Therefore, we additionally define
the rigid Strouhal number (Str ), an input parameter based on the excursion amplitude
of an equivalent rigid fin (same length and angular amplitude at the base). For the six
experimental cases, we obtain Str in the range [0.33-0.64] (figure 3). Strouhal numbers be-
tween 0.2 and 0.4 usually yield the highest propulsion efficiency (Triantafyllou et al. 2000;
Taylor et al. 2003). Nevertheless, wider ranges of St within [0.2-0.7] were reported in var-6
B A1
A2 C
L
V D
0
Figure 2: Four fin geometries under study. Principal axes of the fin are shown in red:
proximo-distal axis (from 0 to L) and dorso-ventral axis (from V to D).
shape L d Re
(mm) (mm)
A1 25 14 1375
A2 20 13 1100
B 25 24 1375
C 20 13 1062
Table 1: Parameters of the fin models: length (L), width at the tip (d, distance between
lobes tips for shape C), Reynolds number (Re) and rigid Strouhal number (Str ).
ious fish species and for different developmental stages (Eloy 2012, 2013; Weerden et al.
2013; Xiong & Lauder 2014; Van Leeuwen et al. 2015; Link et al. 2017). For example,
adult zebrafish flap their caudal fins with St in a window of [0.37-0.52], depending on
their swimming mode (Parichy et al. 2009; Palstra et al. 2010; Mwaffo et al. 2017).
Aside from their pertinence in the fish world, the experimental parameters (AR,
Re and St) are similar to those selected in previous research about fluid-structure
interactions of flapping foils (Lauder et al. 2005; Godoy-Diana et al. 2008; Dai et al.
2012; Marais et al. 2012; Dewey et al. 2013; Quinn et al. 2014; Shinde & Arakeri 2014;
Quinn et al. 2015; David et al. 2017; Floryan et al. 2017; Liu et al. 2017; Rosic et al.
2017; Zhu et al. 2017). We explore a specific portion of the flow parameters space to
understand how propulsive efficiency and surface distributions of hydrodynamic forces
depend on shape and frequency at relatively low Reynolds numbers, a topic of high
interest in the field of fin propulsion and for the practical design of underwater vehicles
relying on bio-inspired undulating membranes.
2.3. Calculations
Based on the PTV-velocity fields, the total hydrodynamic stress tensor s is calculated
at each node in the 3D domain, which is the sum of the scalar pressure field p (multiplied
with the identity matrix and a factor -1) and the viscous stress tensor τ :
sij = −pδij + τij (2.3)7
B. tyrannus
E. jacksoni
1.8
B, f2
S. Tiburo
1.6 S. mystinus
1.4
S. serranoides
D. rerio
aspect ratio
P. virens / O. striatus
1.2
C, f2
1 A2, f2 O. latipes
S. aurantiaca
A1, f1 A1, f2 A1, f3
0.8 X. maculatus
S. kampucheensis
0.6 P. minutus
0.1 0.2 0.3 0.4 0.5 0.6 0.7 0.8
St R
Figure 3: Black dots: aspect ratio and rigid Strouhal number (Str , calculated based on
the rigid projection of the peduncle) for each fin model. Horizontal lines: caudal fins
aspect ratios for various fish species, derived from Sambilay (2005); Offen et al. (2008);
Parichy et al. (2009); Naruse et al. (2011); Plongsesthee et al. (2012); Bohlen et al.
(2016); Kottelat (2017). Dashed blue zone: range of Strouhal numbers typically associated
with efficient propulsion for flapping foils (Triantafyllou et al. 2000; Taylor et al. 2003).
Dashed pink zone: range of Strouhal numbers for the adult zebrafish caudal fin, derived
from Parichy et al. (2009); Palstra et al. (2010); Mwaffo et al. (2017)
The viscous stress tensor depends only on the spatial derivatives of the velocity field
(where µ is the dynamic viscosity):
∂ui ∂uj
τij = µ + (2.4)
∂xj ∂xi
Although it was included in the calculation, the viscous stress is much smaller than
the pressure in the present case. Indeed, the fins operate in the inertial flow regime
(Re>1000), although theoretically very close to the transitional range 3008
2014). Each component of the pressure gradient can be calculated from the Navier-Stokes
equation:
∂p
∂ X ∂
X ∂2
= −ρ + uj +µ ui (2.6)
∂xi ∂t j
∂xj j
∂x2j
Instantaneous pressure fields are reconstructed through direct integration of the
above equation with appropriate boundary conditions. We performed the pressure
calculation using the queen2 algorithm from Dabiri et al. (2014), available at
http://dabirilab.com/software/. A null pressure value is assumed on the external
boundary of the domain, in the undisturbed flow. The validity of that assumption
relies on the conditions H/D > 2, where H is half of the domain size (Dabiri et al.
2014). Substituting the tip excursion amplitudes for the characteristic dimension D, we
conclude that our experiments lie just above that limit. For each node inside the domain,
the pressure gradient is integrated along eight different paths (horizontal, vertical or
diagonal) originating on the outside contour. The median from the eight resulting
pressure values is finally selected. This algorithm offers the advantage of reasonable
computation time even for large domains. The crucial step in the pressure calculation lies
in the determination of the material Lagrangian acceleration. In the queen2 algorithm,
a so-called pseudo-tracking scheme is applied. The position of a particle at an instant
ti+1 is approximated based on its initial location ~xp (ti ) and the velocity evaluated at
this location, averaged between instants ti and ti+1 . The velocity of the particle at its
estimated forward position at time ti+1 is then employed to evaluate its acceleration at
time ti . The pressure gradient is evaluated in a quasi-3D manner, using in-plane velocity
derivatives only, but combining integration paths in both the x-y and the x-z planes.
The details of the calculation are presented in Dabiri et al. (2014).
The total hydrodynamic stress tensor (2.3) is projected on the surface of the solid
object to obtain a stress vector, which is the total force per unit area generated by the
fluid on the foil. Each i-component of the hydrodynamic stress vector acting on a surface
with a unit normal vector ên = (nx , ny , nz ) (oriented outwards) is expressed as:
Si (~x, t, n̂) = sij (~x, t) · nj (2.7)
In section 3, two types of distributions are presented: (1) instantaneous forces (per unit
length), obtained by the integration of the surface stress maps along the dorso-ventral
axis, at 5 selected time points covering half a period of oscillation, and (2) period-averaged
stress maps, where the normal stress is averaged either in absolute value or with its sign.
In each experiment, the flow field is collected over three flapping periods and 30 pairs
of velocity fields (10/period) are selected for the evaluation of hydrodynamic forces.
Instantaneous distributions are averaged over 6 equivalent time frames (considering the
symmetry between the left and right strokes). The period averaged distributions are
based on the 30 time frames. The instantaneous force (per unit length) is decomposed
into the x and y directions, yielding the thrust Fx and lateral force Fy acting on the fin.
The thrust force corresponds to the useful power spent by the fin (when it points in the
negative x direction, propelling the system upstream). The lateral forces correspond to
the wasted power. Hence, we define the efficiency ratio as the power invested by the fin
into useful thrust divided by the total rate of work done on the fluid:
hFx i · huf in i
η= (2.8)
hFx i · huf in i + h Fy i · 2Af9
This definition is equivalent to the Froude efficiency: it measures the ability of the
fin to convert work into upstream propulsion (Eloy 2013; Quinn et al. 2015). The over
lines indicate a spatial average and the brackets indicate a time average over a period.
Note that Fx is averaged with its sign; the absolute value is applied after averaging,
whereas Fy is averaged in absolute value directly because the fin is wasting energy due to
lateral forces from both sides. The fluid velocity is averaged over the foil virtual boundary
rather than over the whole volume, in order to better capture the specific ability of each
hydrofoil to generate downstream fluid motion (see table 2). This classification based on
η is compared to the usual efficiency classification based on the Strouhal number, where
the window of efficient propulsion is considered to be [0.2,0.4] (Triantafyllou et al. 2000;
Taylor et al. 2003).
Many authors have calculated the denominator of equation 2.8 for pitching fins (input
power) as the period-averaged product of torque and angular velocity at the base (Dewey
2013, Quinn 2015, Lucas 2015, Egan 2016, David 2017, Floryan 2017, Lucas 2017, Rosic
2017, Zhu 2017). This efficiency metric is appropriate for hydrodynamic experiments
where forces and torque sensors are placed at the attachment rod of the flapping
propulsor. In the present study, no load cells are involved and all information about the
forces imparted by the foil on the fluid are extracted solely from the flow velocity field.
In this context, a definition of η based on local force components integrated on the fin
surfaces is more suitable. A similar calculation using surface integration of hydrodynamic
stresses was used in Liu et al. (2017).
The uncertainties on the pressure and force distributions can be obtained using
error propagation arguments and an analysis of the inaccuracy on the Lagrangian
path reconstruction (used in the material acceleration evaluation). The uncertainties
on the particles positions in our PTV experimental set up are σx = σy ≃ 3.6µm
and σz ≃ 32 µm, which imply velocity uncertainties of σux = σuy ≃ 0.002 m/s and
σuz ≃ 0.018 m/s. Noise propagation from the velocity field to the material acceleration
and to the integrated pressure field has been the object of many studies (Liu & Katz
2006; Violato et al. 2011; de Kat & Ganapathisubramani 2013; van Oudheusden 2013;
Wang et al. 2017). We can derive an expression for the pressure uncertainty, relevant
for the present calculation scheme. As a first step, we express the material acceleration
uncertainty (with ai = Dui /Dt) as a sum of the error propagated from the velocity field
(first term under the square root) and the uncertainty from the Lagrangian path line
reconstruction (second term):
r
2σu2 i ~ i 2
σai = 2
+ (~σu · ∇)u (2.9)
∆t
The pressure field is the result of a spatial integration, its uncertainty therefore depends
on the spatial resolution ∆xi and on the number of nodes n crossed along the integration
path. Moreover, the pressure integration algorithm involves a median polling q among a
collection of N =8 paths, which reduces the uncertainty further by a factor of 2(Nπ−1)
(Kenney & Keeping 1962). Because any of the x, y or z directions can be followed by the
integration paths, the estimated pressure uncertainty is based on the average of errors in
all three directions (Dagenais & Aegerter 2019):
3
r
2σu2 i
r
ρ π X ~ i 2
σp = n∆xi 2
+ (~σu · ∇)u (2.10)
3 14 i=1 ∆t
The local pressure uncertainties are propagated to the force uncertainties using classic10
error propagation through an integration step, and the resulting values are shown with
error bars in section 3. Due to temporal
p and spatial averaging, these uncertainties are
reduced by an additional factor of Ntime × Nspatial . Ntime is the number of time frames
employed in the period average (6 or 30 for the instantaneous and period averaged
distributions, respectively). Nspatial is 1 for the instantaneous distributions and 20 in
the case of the period averaged curves of figure 11, which are spatially averaged over the
left/right and dorsal/ventral symmetric sides of the fin, as well as over 5 dorso-ventral
rows for each curve.
3. Results
3.1. Hydrofoils kinematics
The geometry and flapping frequency directly affect the fluid-structure interactions of
the hydrofoils. The deflection profiles of the midlines along the course of a flapping cycle
are shown in figure 4. The midlines excursions are used to evaluate A, the tip amplitude,
which is needed to calculate St. The phase lag between the peduncle and the tip (∆φ)
is determined by measuring the angle between the fin midline and the horizontal plane
(at the peduncle and at the tip) at regular time points during the motion cycle. The
results are listed in table 2. The largest phase lag is found for the wide fin geometry
(shape B), with ∆φ twice as large as for shape A1 . This tip recoil is associated to a
smaller excursion amplitude at the tip (A). Increasing the flapping frequency of shape
A1 induces a larger phase lag, but in this case, the diminution of the tip amplitude is
less important. Almost no phase lag is found for the shorter fins, independently of the
trailing edge geometry (shapes A2 and C). The shorter geometries thus behave more
like rigid fins. The capacity of each hydrofoil to generate streamwise fluid velocity can
be analyzed by averaging the value of ux over multiple periods and the whole volume
(uvol ) or over the fins virtual boundary (uf in ), the latter option displaying more obvious
differences (see table 2). The highest streamwise velocity is produced by the bilobed short
fin (shape C), followed by the long narrow fin flapping at maximal rate (shape A1 at f 3 ).
The slowest fluid velocity is observed in the case of the wider fin (shape B) followed by
the long narrow fin flapping at minimal rate (shape A1 at f 1 ). Based on the Strouhal
numbers alone, we would anticipate that the foil shape A1 with flapping frequencies f 2
and f 3 lie outside of the propulsive efficiency range [0.2,0.4]. Nevertheless, the efficiency
ratio η offers a different perspective on that classification, as will be shown in section 3.2.
3.2. Spatio-temporal distributions of fluid forces
The color code of figures 5, 6 and 9 follows that of figure 4 in terms of time partition.
Figure 5 illustrates the distributions of fluid forces (per unit length) in the x direction,
acting on the fins, along their proximo-distal axis. Half a period is represented using five
equidistant time points (naturally, the opposite half-period would produce symmetrical
distributions). Negative values correspond to useful propulsive thrust as the system is
pushed upstream. In all cases, the maximal amount of thrust is produced when the tip is
leaving its maximal point and initiating its motion back towards the center (time point
1/10 in green). The thrust then reduces gradually until time point 3/10 (orange), after
which it increases again as the fin approaches the opposite extremity of its excursion
(time point 4/10 in yellow). The maximal amount of thrust is generated by the long fin
at maximal flapping rate (shape A1 at f 3 ), followed by that same geometry at frequency
f 2 . The wider fin (shape B) also produces significant thrust although slightly lower than
the narrow geometry. For these three cases, the maximal amount of force is generated11
shape frequency ∆φ A uvol uf in St η
(T ) (mm) (mm/s) (mm/s)
A1 f1 0.11 11.0 52.6 48.3 0.37 0.14
A1 f2 0.18 12.0 54.5 54.8 0.61 0.17
A1 f3 0.32 10.3 56.5 58.4 0.69 0.17
A2 f2 0.08 8.0 55.3 53.8 0.40 0.13
B f2 0.36 7.7 46.4 47.4 0.39 0.19
C f2 0.07 7.5 56.7 61.4 0.38 0.10
Table 2: Kinematics and flow regime of the hydrofoils: phase lag between peduncle and
tip angles (∆φ, in fraction of a period), total amplitude covered by the fin tip over a
period (A), streamwise velocity component averaged over three periods (uvol , averaged
over the whole volume, and uf in , averaged over the virtual surface enclosing the fin),
Strouhal number (St) and efficiency ratio (η).
6 6 6
4 A 1, f 1 4 A 1, f 2 4 A 1, f 3
2 2 2
y (mm)
y (mm)
y (mm)
0 0 0
-2 0/10 -2 0/10 -2 0/10
1/10 1/10 1/10
-4 2/10 -4 2/10 -4 2/10
3/10 3/10 3/10
y (mm)
-6 4/10 -6 4/10 -6 4/10
0 5 10 15 20 25 0 5 10 15 20 25 0 5 10 15 20 25
x (mm) x (mm) x (mm)
6 6 6
4 A 2, f 2 4 B, f 2 4 C, f 2
2 2 2
y (mm)
y (mm)
y (mm)
0 0 0
-2 0/10 -2 0/10 -2 0/10
1/10 1/10 1/10
-4 2/10 -4 2/10 -4 2/10
3/10 3/10 3/10
-6 4/10 -6 4/10 -6 4/10
0 5 10 15 20 25 0 5 10 15 20 25 0 5 10 15 20 25
x (mm) x (mm) x (mm)
x (mm)
Figure 4: Hydrofoils midlines at 5 time points equidistant over half a period.
by the most distal portion of the fin, peaking close to 80% of the total length. The
thrust is drastically reduced in the case of the shorter fin (shape A2 ). In comparison, the
short fin with bilobed edge (shape C) produces slightly larger amount of thrust at time
points 0/10 and 1/10, but this is compensated by a positive distribution of Fx at time
3/10, detrimental to propulsion. In that specific case, the maximum amount of force is
generated closer to the center of the foil. The time evolution of the total force in the x
direction (integrated over the whole fin surface) is shown in red in figure 7. Because of
the symmetry between the left and right strokes of the fin, maximum thrust is generated
twice per cycle.
Figure 6 presents the y component of the hydrodynamic force (per unit length) acting
on the fin. This lateral force corresponds to wasted energy (not useful to propulsion). The
most thrust-producing foils (shapes A1 at f 3 , A1 at f 2 and shape B) are also the ones12 where the most energy in lost in accelerating fluid in the lateral direction. Moreover, the distribution on Fy is correlated to the distribution of Fx both temporally and spatially, with a maximum lateral force produced at time points 0/10, 1/10 and 2/10, at a position close to 80% of the fin length. The time points which are typically not associated to thrust production (3/10 and 4/10) correspond to lower lateral forces. The bilobed geometry (shape C) presents a more complex spatio-temporal distribution of Fy , where the force peak alternates between two locations during the half period: at 50% of the fin length for time points 1/10 and 3/10, and 80% for time points 2/10 and 4/10. The lowest levels of wasted energy due to lateral forces are found for the long fin at low frequency (shape A1 at f 1 ), followed by the shorter fin (shape A2 ). The time evolution of the total lateral force is shown in blue in figure 7. The left and right strokes produce mirroring force profiles due to the motion symmetry. As a measure of propulsive energy, we use η, the ratio between the energy employed to produce thrust and the sum of that energy with the energy employed to produce lateral forces (equation 2.8). Figure 8 allows to compare the efficiency thus defined for all foils with their respective flapping rates, as a function of Str and St. David et al. (2017) have raised the question of whether or not the Strouhal number calculated from the tip excursion amplitude is a good metric for the width of a vortex wake. They showed that for highly flexible foils, the width of the wake is overestimated by the large tip excursion, and that a rigid projection of the pitching peduncle approximates better the vortices spacing. Interestingly, the fact that flexible fins have larger tip excursion amplitudes than their rigid counterparts is not verified in all our experiments. It is true for geometries A1 and A2 , but not for shapes B and C, where the amplitude is smaller than the rigid projection. Therefore, in some cases, the flexibility of a fin tends to decrease its excursion amplitude and its Strouhal number. The most efficient shape is the wider foil (B), followed by the long narrow shape (A1 ), which is equally efficient at frequencies f 2 and f 3 but drops in efficiency at lower frequency (f 1 ). The shorter fins are the less efficient ones, with the lowest value of η found for the short fin with a bilobed edge (C). This is consistent with the fact that flexible fins are typically more efficient than their rigid counterparts (Dewey et al. 2013). Indeed, shapes A2 and C, because of their specific geometries, behave almost like rigid panels, as can be inferred from the close to zero phase lag between the peduncle and the tip angles (table 2), and from the visualization of their midlines (figure 4). In figure 8, the dashed regions denote the range of Strouhal numbers typically associ- ated to efficient thrust production. Interestingly, the classification based on the definition of η shows that shape A1 at frequencies f 2 and f 3 is more efficient than shapes A2 and C, even though their Strouhal numbers lie outside of the usual window of efficiency [0.2,0.4]. In all cases, the efficiency ratio η remains below 0.2, indicating that less that 20% of the input power is used for propelling the system in the upstream direction, which is not particularly efficient. The normal force distributions (per unit length) on both sides the hydrofoils are illustrated in figure 9. Low flapping rate (shape A1 at f 1 ) or shorter fin length (shape A2 ) result in lower amount of normal forces across both surfaces, peaking close to 70% of the total fin length. At intermediate or higher flapping rate (shape A1 at f 2 or f 3 ), when the fin is wider (shape B), or when the edge is bilobed (shape C), the normal forces increase and the maximum magnitude is shifted close to 80% of the fin. Moreover, the asymmetry between the left and right sides of the hydrofoils becomes more important. The magnitudes are asymmetric, and in the most extreme cases, the normal force has the same sign on both fin sides (see for example time points 3/10 and 4/10 for shape A1 at f 2 ). These asymmetries translate into larger internal tension within the material. If the sum of
13
the forces on both sides is positive, the material inside the fin is subjected to an outward
stretching as it experiences a net force in the direction of the outward normal. Contrarily,
if the sum on both sides is negative, the resultant force points towards the inside of the fin,
which is then subjected to a net compression. A perfectly symmetric force distribution
on both sides (sum equal to zero) would indicate that one side is pulled while the other is
pushed with the exact same magnitude, therefore, the hydrodynamic stress would result
in the acceleration of the foil, with no internal stress caused by the net external contact
forces. To evaluate the spatial distribution of internal tension across the hydrofoils, the
normal stress is averaged over a full cycle of flapping, with its sign. The results are
presented as color maps in figure 10. Negative values denote an excess of compression
over the oscillation cycle, positive values denote stretching. All membranes experience an
overall stretching over the tip region. The most extreme occurrence of that effect is found
at the tip of shape A1 at f 3 . A high concentration of stretching is also seen for shape A1 at
f 2 , localized in the very center of the tip, and for shape B, where the concentration zone
is shifted to the corners. Additionally, there is a compression zone located distally to the
center of the foils, between approximately 50% and 75% of the total length. This is seen
in all cases except for shape A1 at f 2 , where the internal compression is relaxed in the
center of the fin. Furthermore, the normal stress distributions are averaged over a period,
in absolute values, revealing which portions of the fin are most prominently involved in
the production of hydrodynamic forces. These spatial distributions are presented in figure
11, with stress curves covering the dorso-ventral axes of the fin and taken at different
locations across its length (25%, 50%, 75% and 100%). The maximum values are always
found at ∼75% of the foil length. The variations across the surface are marked mostly in
the case of the long and narrow geometry (shape A1 ), where the curves at 0.25L, 0.5L,
0.75L and L become more and more separated as the flapping frequency increases. It is
noteworthy that a special stress pattern emerges for shape A1 at f 2 , where the curve at
0.75L adopts a bilobed signature, not observed for f 1 nor f 3 . The excess of normal stress
on the tip corners of shape B is also visible in the corresponding graph (stress curve at
L). Finally, all fin geometries and flapping rates result in lower levels of hydrodynamic
forces generated at the lateral edges (dorsal and ventral) of the hydrofoils.

                          3.3. Vorticity fields and wake structures
   The vorticity field (~ω=∇  ~ × ~u) is very informative about characteristic flow structures,
revealing relations between wake topology, surface distributions of fluid forces and propul-
sive efficiency. To allow comparison with previous work, we present the distributions of
ωz , the z component of the vorticity, in 2D planes intersecting the fins at mid-span.
Instantaneous ωz maps are shown in figure 12, as the foils are crossing the y = 0 axis
(corresponding to 2/10 of a period, color-coded in pale blue in figures 4, 5, 6 and 9).
Period-averaged ωz maps are shown in figure 13.
   During the flapping cycle, the instant when the fins cross the y = 0 axis occurs between
the points of maximal and minimal thrust production (see figure 7). Figure 12 illustrates
that a vortex with a core of negative ωz (rotating clockwise) forms at the tip of each fin.
For shape A1 at frequency f 1 , the vortex is almost detached at this point, whereas at f 2 ,
it is fully detached, with a second smaller vortex forming at the tip. The size and strength
of these clockwise vortices correlate with propulsive efficiency: the largest vortices, with
maximal |ωz | of the order of 50 s-1 , are found for shape A1 at f 2 , shape A1 at f 3 and
shape B at f 2 , the three cases with maximal η coefficients. Counterclockwise vortices are
also present in the snapshot vorticity fields for shapes A1 (at f 3 ), A2 , B and C. They
are located more downstream as they have been shed during the precedent half-cycle of
motion. In the lower frequency cases for shape A1 (f 1 and f 2 ), they are not discernable
14
0.01 0.01 0.01
0
0 0
-0.01
-0.01 -0.01
Fx (N/m)
Fx (N/m)
Fx (N/m)
-0.02
-0.02 A 1, f 1 -0.02 A 1, f 2 -0.03
A 1, f 3
0/10 0/10 -0.04 0/10
-0.03 1/10 -0.03 1/10 1/10
2/10 2/10 2/10
Fx (N/m)
3/10 -0.05 3/10
-0.04 3/10 -0.04
4/10 4/10 4/10
-0.06
0 0.2 0.4 0.6 0.8 1 0 0.2 0.4 0.6 0.8 1 0 0.2 0.4 0.6 0.8 1
L L L
0.01 0.01 0.01
0 0 0
-0.01 -0.01 -0.01
Fx (N/m)
Fx (N/m)
Fx (N/m)
-0.02 A 2, f 2 -0.02 B, f 2 -0.02 C, f 2
0/10 0/10 0/10
-0.03 1/10 -0.03 1/10 -0.03 1/10
2/10 2/10 2/10
-0.04 3/10 -0.04 3/10 -0.04 3/10
4/10 4/10 4/10
0 0.2 0.4 0.6 0.8 1 0 0.2 0.4 0.6 0.8 1 0 0.2 0.4 0.6 0.8 1
L L L
L
Figure 5: Thrust (x-component) force per unit length acting on the fin (in N/m), at 5
time points equidistant over half a period.
0.06 0.06
0.05
0.04 A 1, f 1 0.04 A 1, f 2 A 1, f 3
0.02 0.02
0
0 0
Fy (N/m)
Fy (N/m)
Fy (N/m)
-0.02 -0.02
-0.05
-0.04 -0.04
-0.06 0/10 -0.06 0/10 0/10
-0.08 1/10 -0.08 1/10 -0.1 1/10
2/10 2/10 2/10
Fy (N/m)
-0.1 3/10 -0.1 3/10 3/10
4/10 4/10 4/10
-0.12 -0.12 -0.15
0 0.2 0.4 0.6 0.8 1 0 0.2 0.4 0.6 0.8 1 0 0.2 0.4 0.6 0.8 1
L L L
0.06 0.06 0.06
0.04 A 2, f 2 0.04 B, f 2 0.04 C, f 2
0.02 0.02 0.02
0 0 0
Fy (N/m)
Fy (N/m)
Fy (N/m)
-0.02 -0.02 -0.02
-0.04 -0.04 -0.04
-0.06 0/10 -0.06 0/10 -0.06 0/10
-0.08 1/10 -0.08 1/10 -0.08 1/10
2/10 2/10 2/10
-0.1 3/10 -0.1 3/10 -0.1 3/10
4/10 4/10 4/10
-0.12 -0.12 -0.12
0 0.2 0.4 0.6 0.8 1 0 0.2 0.4 0.6 0.8 1 0 0.2 0.4 0.6 0.8 1
L L L
L
Figure 6: Lateral (y-component) force per unit length acting on the fin (in N/m), at 5
time points equidistant over half a period.
in the field of view, most likely because they have been shed downstream past x = 35
mm by that time. The persistence in the close downstream wake of these positive ωz
vortices do not appear to be correlated with propulsive efficiency, nor their magnitude or
orientation. Rather, it is the flow structures directly adjacent to the tip which embody
the capacity of a fin to generate efficient thrust. It is interesting to observe that the15
0.1 1.5 0.1 1.5 0.1 1.5
A 1, f 1 A 1, f 2 A 1, f 3
total force (mN)total force (mN) 0 1 0 1 0 1
total force (mN)
total force (mN)
-0.1 0.5 -0.1 0.5 -0.1 0.5
-0.2 0 -0.2 0 -0.2 0
-0.3 -0.5 -0.3 -0.5 -0.3 -0.5
-0.4 -1 -0.4 -1 -0.4 -1
Fx Fx Fx
Fy Fy Fy
-0.5 -1.5 -0.5 -1.5 -0.5 -1.5
0 0.2 0.4 0.6 0.8 1 0 0.2 0.4 0.6 0.8 1 0 0.2 0.4 0.6 0.8 1
0.1 fraction of a period 1.5 0.1 fraction of a period 1.5 0.1 fraction of a period 1.5
A 2, f 2 B, f 2 C, f 2
0 1 0 1 0 1
total force (mN)
total force (mN)
total force (mN)
-0.1 0.5 -0.1 0.5 -0.1 0.5
-0.2 0 -0.2 0 -0.2 0
-0.3 -0.5 -0.3 -0.5 -0.3 -0.5
-0.4 -1 -0.4 -1 -0.4 -1
Fx Fx Fx
Fy Fy Fy
-0.5 -1.5 -0.5 -1.5 -0.5 -1.5
0 0.2 0.4 0.6 0.8 1 0 0.2 0.4 0.6 0.8 1 0 0.2 0.4 0.6 0.8 1
fraction of a period fraction of a period fraction of a period
fraction of a period
Figure 7: Total forces (in mN) acting on the fin, at 5 time points equidistant over half a
period (thrust and lateral forces, in the x and y directions respectively).
0.2 B, f2 0.2 B, f2
0.18 A1, f2 A1, f3 0.18 A1, f2 A1, f3
0.16 0.16
A1, f1 A1, f1
η
η
0.14 0.14
A2, f2 A2, f2
0.12 0.12
C, f2 C, f2
0.1 0.1
0.08 0.08
0.2 0.3 0.4 0.5 0.6 0.7 0.2 0.3 0.4 0.5 0.6 0.7
St r St
Figure 8: Efficiency ratio (as defined by equation 2.8), as a function of the rigid Strouhal
number Str , calculated based on the rigid projection of the peduncle (left) and the flexible
Strouhal number St, calculated based on the tip excursion amplitude of the flexible foils
(right).
curvature of the trailing edge has an impact on the position at which the vortices are
being shed. Indeed, counter-rotating vortices are added to the wake along the y = 0 axis
for a straight edge geometry (shape A2 ), whereas they are detaching at higher y positions
for a bilobed trailing edge (shape C).16
0.08 0.08 0.1
0.08
0.06 A 1, f 1 0.06 A 1, f 2 A 1, f 3
0.06
0.04 0.04 0.04
0.02
Fn (N/m)
Fn (N/m)
Fn (N/m)
0.02 0.02
0
0 0 -0.02
-0.02 0/10 -0.02 0/10 -0.04 0/10
1/10 1/10 1/10
2/10 2/10 -0.06 2/10
-0.04 -0.04
Fn (N/m)
3/10 3/10 -0.08 3/10
4/10 4/10 4/10
-0.06 -0.06 -0.1
0 0.2 0.4 0.6 0.8 1 0 0.2 0.4 0.6 0.8 1 0 0.2 0.4 0.6 0.8 1
0.08 L 0.08 L 0.08 L
0.06 A 2, f 2 0.06 B, f 2 0.06 C, f 2
0.04 0.04 0.04
Fn (N/m)
Fn (N/m)
Fn (N/m)
0.02 0.02 0.02
0 0 0
-0.02 0/10 -0.02 0/10 -0.02 0/10
1/10 1/10 1/10
-0.04 2/10 -0.04 2/10 2/10
3/10 3/10 -0.04 3/10
4/10 4/10 4/10
-0.06 -0.06 -0.06
0 0.2 0.4 0.6 0.8 1 0 0.2 0.4 0.6 0.8 1 0 0.2 0.4 0.6 0.8 1
L L L
L
Figure 9: Normal force per unit length (in N/m), acting on both sides of the fin (left
side: diamonds, right side: stars) at 5 time points equidistant over half a period.
0.8 0.8 1.6
A 1, f 1 A 1, f 2 A 1, f 3
0.4 0.4 0.8
0 0 0
-0.4 -0.4 -0.8
-0.8 -0.8 -1.6
0.8 0.8 0.8
A 2, f 2 B, f 2 C, f 2
0.4 0.4 0.4
0 0 0
-0.4 -0.4 -0.4
-0.8 -0.8 -0.8
Figure 10: Period averaged signed value of the normal stress acting on the sides of the
fin (in Pa).
The period-averaged z-vorticity also presents a correlation with propulsive efficiency:
the three hydrofoils with highest η coefficients (shape A1 at f 2 and f 3 and shape B at
f 2 ) display the highest means, around 15 s-1 (figure 13). For all shapes and frequencies,
the period-averaged ωz indicates that a surplus of clockwise vorticity is induced at the
tip when the fin travels in the y < 0 region, and vice-versa. In other words, the fluid17
5
4 4
4
3 3
3
2 2
2
1 1
1
0.25L 0.25L 0.25L
0.5L 0.5L 0.5L
0 A 1, f 1 0.75L 0 A 1, f 2 0.75L 0 A 1, f 3 0.75L
L L L
Ventral Center Dorsal Ventral Center Dorsal Ventral Center Dorsal
4 4 4
3 3 3
2 2 2
1 1 1
0.25L 0.25L 0.25L
0.5L 0.5L 0.5L
0 A 2, f 2 0.75L 0 B, f 2 0.75L 0 C, f 2 0.75L
L L L
Ventral Center Dorsal Ventral Center Dorsal Ventral Center Dorsal
Figure 11: Period averaged absolute value of the normal stress acting on the sides of the
fin (in Pa, σp =0.2 Pa).
tends to rotate more towards the exterior of the motion envelope close to the tip. In the
wake surrounding more proximal portions of the foils, the opposite effect is observed: the
period-averaged z-vorticity is slightly positive in the y < 0 region, and vice-versa. This
phenomenon is linked to the period-averaged surface maps of normal stress (figure 10),
denoting an excess of stretching close to the tip, and a surplus of compression towards
the center and more proximal surface regions. Moreover, stronger stretching force at the
tip appears to be related to higher mean vorticity close to the trailing edge, as seen
for shape A1 at f 2 and f 3 and shape B at f 2 . From figure 13, an estimation of the
vortex shedding angle can be drawn, corresponding to the opening angle of the maximal
|ωz | zone. This angle is wider in the cases of shape A1 at f 2 and f 3 , roughly following
the tip curvature of the motion envelopes. The most efficient fin (shape B) presents a
less pronounced shedding angle, which remains aligned with the motion envelope outline.
The shedding angle seems particularly constrained for the two shorter fins behaving more
like rigid panels (shapes A2 and C), which are also the least thrust-efficient hydrofoils.
In those cases, the high vorticity areas are almost aligned with the y = 0 axis. When
comparing the period-averaged wake signatures of shape A1 at f 1 , f 2 and f 3 , we observe
that increasing the flapping frequency results in the appearance of a reversed circulation
area in the downstream wake, close to x = 33 mm, where ωz changes its sign. This mean
vorticity reversal does not seem related to propulsive efficiency, since it is also slightly
visible in the case of shape A2 at f 2 , one of the least efficient foils in terms of thrust
production.
4. Discussion and outlook
We have established a systematic experimental approach to compare the hydrodynamic
stress maps on different fin shapes with varying flapping frequency, allowing us to identify
the effects of each parameter on the spatio-temporal distributions of fluid forces, and18
20 20 20
A 1, f 1 A 1, f 2 A 1, f 3
10 10 10
10 10 10
0 0 0
y (mm)
y (mm)
y (mm)
-10 -10 -10
0 0 0
-20 -20 -20
-30 -30 -30
-10 -10 -10
-40 -40 -40
-50 -50 -50
y (mm)
0 10 20 30 0 10 20 30 0 10 20 30
x (mm) x (mm) x (mm)
20 20 20
A 2, f 2 B, f 2 C, f 2
10 10 10
10 10 10
0 0 0
y (mm)
y (mm)
y (mm)
-10 -10 -10
0 0 0
-20 -20 -20
-30 -30 -30
-10 -10 -10
-40 -40 -40
-50 -50 -50
0 10 20 30 0 10 20 30 0 10 20 30
x (mm) xx (mm)
(mm) x (mm)
Figure 12: Snapshots of ωz , the z-component of the vorticity field (in s-1 ) in the plane
intersecting the fins half-way through their span, as they are crossing the y = 0 axis,
travelling towards positive y.
15 15 15
A 1, f 1 A 1, f 2 A 1, f 3
10 10 10
10 10 10
5 5 5
y (mm)
y (mm)
y (mm)
0 0 0 0 0 0
-5 -5 -5
-10 -10 -10
-10 -10 -10
y (mm)
-15 -15 -15
0 10 20 30 0 10 20 30 0 10 20 30
x (mm) x (mm) x (mm)
15 15 15
A 2, f 2 B, f 2 C, f 2
10 10 10
10 10 10
5 5 5
y (mm)
y (mm)
y (mm)
0 0 0 0 0 0
-5 -5 -5
-10 -10 -10
-10 -10 -10
-15 -15 -15
0 10 20 30 0 10 20 30 0 10 20 30
x (mm) xx (mm)
(mm) x (mm)
Figure 13: Period-average of ωz , the z-component of the vorticity field (in s-1 ) in the
plane intersecting the fins half-way through their span, with the cycle of motion envelopes
indicated by white areas.
link them to the direct wake topology. In our analysis, we payed special attention to the
ability of each hydrofoil to generate thrust (force propelling the system upstream), lateral
forces (not contributing to propulsion) and the resulting propulsion efficiency. We also
investigated the spatial distributions of external contact forces normal to the fins surfaces
and the corresponding internal tension accumulating within the material. We have found19 that the long narrow geometry generates the most thrust (at equal frequency), and that increasing the flapping frequency increases thrust. Between both short geometries, the bilobed trailing edge allows to produce slightly more thrust than the straight edge, but only temporarily during the period. At a certain point during the flapping cycle, it is also pushed downstream by the fluid (the opposite of propulsive thrust). It is typically the distal region of the fins which participates more in thrust generation, except for the short bilobed geometry whose central portion is the one most involved. As for the lateral forces, detrimental to propulsive efficiency, the short straight geometry (at equal frequency) reaches the lowest levels. For the long geometry, reducing the flapping frequency also reduces the lateral force magnitude throughout the cycle. The examination of instantaneous and period-averaged vorticity fields yielded the conclusion that the formation of larger and stronger vortices directly at the tip as well as the accumulation of excess vorticity close to the trailing edge over a full period are related to better propulsive efficiency. Among all cases tested, the most efficient geometry was found to be the long wide fin, followed by the long narrow one, whose efficiency remained similar at higher frequency but dropped significantly at the lowest one. The least efficient fin morphology is the short fin with bilobed trailing edge. This type of tip curvature is ubiquitous in nature. It is interesting, both for the study of biological swimmers and for the design of artificial fins, to discover that the naturally widespread bilobed shape does not improve efficiency nor does it grant more thrust producing capabilities to a simple fin model at Reynolds numbers which are on the low side of the inertial regime. It is more likely that an authentic fish fin with a bilobed trailing edge is coupled with specific elasticity profiles and complex controlled motion programs, in order to achieve its functional role. It could also be that the advantages of this tip curvature appear only for a specific combination of parameters such as length and flapping frequency. Besides, we have observed that the bilobed geometry results in a dynamical shift of fluid force peaks along the fin length during the stroke cycle. This more complex dynamics of force distributions could be used actively by an appendage to achieve fine maneuvers. The external contact forces from the fluid acting normally on both foils surfaces result in an accumulation of internal tension throughout the flapping cycle. The fin tip is subjected to an excess of tissue stretching, an effect which becomes more important as the foil becomes longer, or as it flaps faster. The stretching tension concentrates towards the tip corners for a wider geometry. Moreover, the foil membranes experience an overall compression zone at about two thirds of their total length. Interestingly, in the case of the long narrow geometry, flapping at frequency f 2 , this compression region partly disappears. In that specific case, a particular stress pattern emerges from 75% of the total length up to the tip, where the normal stress (averaged in absolute value over a period) presents a double peak signature. For all fin geometries, the period averaged absolute value of the normal stress reaches its maximum at about 75% of the total length. These stress maps are very indicative of how the fin architecture must be conceived in order to withstand specific concentrations of mechanical loads and internal tension throughout its oscillation cycle. The flexible tails of rayed-fins fishes display an impressively wide range of morpholog- ical traits and provide a great model system to study the relation between fin geometry and propulsive efficiency (Affleck 1950; McNeill 1974; Lauder 1989; Weihs 1989; Lauder 2000; Lauder & Madden 2007; Blake et al. 2009; Flammang et al. 2011b). Complex com- binations of environmental constraints participate in the selective evolution of fish fins, and the resulting elastic properties, geometry and kinematics of each specie constitute an elegant compromise between competing survival demands such as the necessity to achieve fine control of the fin surface for delicate maneuvering, to generate quick acceleration bursts or to maintain long distance efficiency (Webb 1975; Lauder & Liem 1983; Lauder
20
1989, 2006, 2015). It is tempting to assume that evolution has optimized the geometric
and kinematic parameters of fins to meet with the functional demands of distinct habitats.
However, drawing a parallel between form and function requires taking into account
the evolutionary history of fins morphologies, and considering not only the external
shape, but also internal structures, in order to avoid mistaking correlations between
morphology, habitat and function for causal relationships (Lauder & Liem 1983; Lauder
1989). Previous investigations on the interplay between shape and stiffness of fin models
and their capacity to generate thrust efficiently have already demonstrated that efficiency
varies in a complex manner as a function of the different fin attributes, and that it is not a
simple matter to identify an optimal shape (Feilich & Lauder 2015). Rather, efficiency can
be maximized by several combinations of parameters, depending on the flow conditions,
and it remains a great challenge to draw general conclusions about the functional
advantages of geometrical and kinematic aspects. The present work illustrates how the
investigation of hydrodynamic stresses based on three-dimensional PTV experiments can
provide precious information about the mechanical interplay between a fin-like structure
and the surrounding fluid. It paves the way for future experimental studies using direct
evaluation of fluid forces on the surface of submerged flexible appendages, allowing to
tackle directly the fundamental problem of form and function in the context of propulsion
through a fluid medium. To conclude, the possibility to resolve the 3D instantaneous
hydrodynamic stress fields on small-scaled models of deformable structures opens the
door to many applications in the engineering design of aeronautic and aquatic vehicles
or the field of biophysics concerned with animal locomotion.

5. Acknowledgements
   This work was funded by the Swiss National Science Foundation (SNF) via a Sinergia
research grant as well as a UZH Forschungskredit Candoc grant. We are grateful for
interdisciplinary discussions with Tinri Aegerter, Anna Jaźwińska, Ivica Kicic, Sahil Puri
and Siddhartha Verma. We are very thankful to J.O. Dabiri et al. for making the queen2
pressure algorithm available Dabiri et al. (2014). Declaration of Interests: The authors
report no conflict of interest.

                                      REFERENCES
Affleck, R J 1950 Some points in the function, development and evolution of
      the tail in fishes. Proceedings of the Zoological Society of London 120 (2),
      349–368, arXiv: https://zslpublications.onlinelibrary.wiley.com/doi/pdf/10.1111/j.1096-
      3642.1950.tb00954.x.
Aris, R 1990 Vectors, Tensors and the Basic Equations of Fluid Mechanics. Dover Publications.
Arnal, D 1984 Description and prediction of transition in two-dimensional, incompressible flow.
      In Special Course on Stability and Transition of Laminar Flow (ed. AGARD-R-709).
Bainbridge, R 1960 Speed and stamina in three fish. Journal of Experimental Biology 37 (1),
      129–153, arXiv: https://jeb.biologists.org/content/37/1/129.full.pdf.
Baur, T & Köngeter, J 1999 Piv with high temporal resolution for the determination of
      local pressure reductions from coherent turbulence phenomena. In 3rd Int. Workshop on
      PIV, 101-106 . Santa Barbara, USA.
Blake, R W, Li, J & Chan, K H S 2009 Swimming in four goldfish carassius
      auratus morphotypes: understanding functional design and performance employing
      artificially selected forms. Journal of Fish Biology 75 (3), 591–617, arXiv:
      https://onlinelibrary.wiley.com/doi/pdf/10.1111/j.1095-8649.2009.02309.x.
Blickhan, R, Krick, C, Zehren, D, Nachtigall, W & Breithaupt, T 1992 Generation of
      a vortex chain in the wake of a suhundulatory swimmer. Naturwissenschaften 79, 220–221.
You can also read