Simple One-Step Leaf Extract-Assisted Preparation of α-Fe2O3 Nanoparticles, Physicochemical Properties, and Its Sunlight-Driven Photocatalytic ...
←
→
Page content transcription
If your browser does not render page correctly, please read the page content below

Hindawi
Journal of Nanomaterials
Volume 2021, Article ID 8570351, 25 pages
https://doi.org/10.1155/2021/8570351

Research Article
Simple One-Step Leaf Extract-Assisted Preparation of α-Fe2O3
Nanoparticles, Physicochemical Properties, and Its Sunlight-
Driven Photocatalytic Activity on Methylene Blue
Dye Degradation

 V. Archana ,1 J. Joseph Prince ,1 and S. Kalainathan 2

 1
 Department of Physics, University College of Engineering, Anna University-BIT Campus, Tiruchirappalli 620024, Tamil Nadu, India
 2
 Centre for Nanotechnology Research, VIT, Vellore, Tamil Nadu 632014, India

 Correspondence should be addressed to V. Archana; c.v.archanavenkat@gmail.com

 Received 24 July 2020; Revised 26 March 2021; Accepted 29 April 2021; Published 2 June 2021

 Academic Editor: Thathan Premkumar

 Copyright © 2021 V. Archana et al. This is an open access article distributed under the Creative Commons Attribution License,
 which permits unrestricted use, distribution, and reproduction in any medium, provided the original work is properly cited.

 Hematite nanoparticles have been prepared from Moringa oleifera leaf extracts. Phytochemicals are derived from plant extracts
 which act as a stabilizing and capping agent as well as a surfactant. This green route protocol is attractive owing to its speed,
 reliability, and ecofriendly and cost-effective qualities. The synthesized iron oxide nanoparticles were subjected to three different
 calcination temperatures (500, 600, and 700°C). The crystallinity nature and phase purity have been confirmed by powder X-ray
 diffraction (PXRD). Optical properties have been studied by UV-visible (UV-vis) and diffuse reflectance spectroscopy (DRS). A
 very narrow bandgap was observed, and absorbance was observed at the visible region. Photoluminescence spectra have
 exhibited a multicolor emission band from the near UV to visible region due to defect centers (F centers). EDX (energy
 dispersive X-ray spectrum) has given information on the stoichiometric ratio of Fe and O. The functional groups which are
 responsible for nanoparticle formation have been identified by Fourier transformed infrared spectroscopy (FTIR), surface
 morphology transformation has been illustrated by scanning electron microscopy (SEM) studies, and VSM measurements have
 exhibited a hysteresis curve that shows the weak and strong ferromagnetic behavior in nature at RT. TEM micrographs have
 confirmed that particles are in the nanorange, matching the results from the XRD report. The SAED pattern gives information
 on the polycrystalline nature of hematite nanoparticles. TG-DSC characterization revealed phase transition, decomposition, and
 weight loss information. Frequency-dependent electrical properties were studied. Here, we report what the present studies have
 revealed: that hematite nanopowder prepared from the green route is environmentally friendly, takes a short time to prepare, is
 an economical and promising candidate material for electromagnetic devices and ferromagnet manufacturing, and is a
 photocatalyst in water treatment applications without adding additives (H2O2).

1. Introduction otic bacteria and eukaryotes such as fungi and plants. Bio-
 green synthesis has a greater advantage compared to
Phytochemical-mediated synthesis is a green route protocol microorganisms wherein plant-mediated synthesis uses a
that has received great attention because it is a novel strategy one-step synthesis. However, because of the mutation of
and it is an alternative to physical and chemical methods [1]. microorganisms over time, they may lose their ability to syn-
In this type of bottom-up approach, the phytochemicals thesize nanoparticles; in addition, the process is very labori-
reduce the raw materials into metal nanoparticles. The ous and time consuming [4]. Plant-mediated synthesis is a
reducing agents involved in nanoparticle synthesis are alka- one-step protocol and is safe; hence, research on plants has
loids, phenolic compounds, terpenoids, and coenzymes. expanded rapidly [4–6]. As biological agents, plants serve as
The bioactive compounds can act as a capping and stabilizing reducing and capping agents involved in the synthesis pro-
agent [2, 3]. The biosynthesis route employs simple prokary- cess which is considered ecofriendly [7, 8]. Every part of
2 Journal of Nanomaterials

the plant can be used for nanoparticle synthesis, like the oxide has attracted the most attention due to its high eco-
leaves, stems, straws, and flowers [7–13]. The leaf extract nomical availability, colloidal stability, nontoxicity, eco-
acts as an environmental reducing agent that is nonhazard- friendly nature, magnetic property, and surface engineering
ous and nontoxic. Here, extracellular methods had been capability, and it can be tailored according to its shape and
used for the synthesis of nanoparticles including the use of size [35]. It has been widely used as catalysts, pigments in
leaf extract prepared by boiling or crushing leaves [14–16]. paint, noncorrosive agents due to its corrosion resistivity,
There are many advantages when comparing the green optoelectronic devices, gas sensors, biosensors, and devices
method over the chemical method of synthesis, namely, it for solar energy conversion, water splitting, water purifica-
can be prepared at room temperature, it uses nonpoisonous tion, and high-density data storage. Because of its magnetic
capping, it functions as a stabilizing agent, it is an easy property, it is used as a contrasting agent in biomedical imag-
method, it can be applied for large scale production, and it ing techniques like MRI scans, absorbents, biomedical appli-
is economical as well. cations like in in vitro and in vivo studies, targeted drug
 Biosynthesis of iron (III) oxide (α-Fe2O3) hematite nano- delivery, bioseparation, and magnetic fluid hyperthermia.
particles prepared from Moringa oleifera leaf extracts is Magnetic iron oxide nanoparticles can easily be conjugated
reported here. When exposed to Moringa oleifera leaf extract, with DNA, peptides, and antibodies. They can be used in
aqueous metal ions are reduced and metal and metal oxide anticancer therapy, ferrofluids, cell labeling, and separation,
nanoparticles are formed. The plant belongs to the Moringa- and they show significant physical and chemical properties
ceae family. It is distinguished by parietal placentation; a 3- concerning their oxidation states [35–38]. Nowadays nano-
valved fruit; an elongated, nondehiscent berry; and winged biohybrid particles have been prepared, which both have
seeds. It is a medium-sized tree, and the botanical name of magnetic and biological functions in biomedical therapeutics
the tree is Moringa oleifera Lam. The family consists of the and diagnostics.
single genus Moringa [17]. It is widely available in India, Iron oxides have multiple forms that are polymorphic in
and it is an essential dietary ingredient in Indian food. The nature. Among them, iron (III) oxide (hematite (α-Fe2O3)),
plant contains minerals, protein, vitamins, amino acids, and magnetite (Fe3O4), and magemite (γ-Fe2O3) are common
phenolics and provides a rich and rare combination of zeatin, forms [38]. Iron oxides have been synthesized through vari-
quercetin, β-sitosterol, caffeoylquinic acid, and kaempferol. ous synthetic methods including hydrothermal, coprecipita-
The leaves contain concentrations of ascorbic acid; estro- tion, sonochemical, sol-gel, thermal decomposition, and wet
genic substances [18]; iron; calcium; phosphorus; copper; chemical [1–6]. Here, we synthesized through a one-step
vitamins A, B, and C; α-tocopherol; riboflavin; nicotinic acid; simple green route and focused on hematite nanoparticles
folic acid; pyridoxine; β-carotene; protein; and in particular, (α-Fe2O3) alone. Hematite is an n-type semiconductor with
essential amino acids such as methionine, cysteine, trypto- a narrow bandgap of 2.2 eV. It exhibits long-term stability
phan, and lysine [19]. Nanoparticle synthesis using a plant under ambient conditions [36]. Owing to its unique chemi-
system is the current scenario. Plant-mediated synthesis is cal, thermal, optical, magnetic, and electrical properties and
not only used for environmental impact but is also used to its high stability in ambient conditions, it has received great
produce large quantities of contamination-free nanoparticles attention among researchers. Usually, the hematite nanopar-
with a well-defined morphology and size [20–22]. The char- ticles are antiferromagnetic in nature, where spins are aligned
acteristics of the nanoparticles have been influenced by the antiparallel in adjacent planes [37]. But here, the synthesized
source of the plant extract because different extracts contain iron oxide nanoparticles show an unusual ferromagnetism at
different concentrations and combinations of organic reduc- room temperature, and the prepared nanoparticles by this
ing agents. A plant extract-mediated bioreduction involves plant extract-assisted method has yielded large coercivity
mixing the aqueous extract with an aqueous solution of the magnetic iron oxide nanoparticles as illustrated in M-H mea-
relevant metal salt at room temperature, and it can been surements. The hematite nanoparticles prepared by this one-
completed within a few minutes [2, 3, 23, 24]. Various metal step green protocol will be a promising material in spintro-
nanoparticles have been synthesized from the Moringa olei- nics, data storage devices, ferromagnet manufacturing, and
fera leaf extract. electromagnetic devices owing to their natural RTFM.
 Generally, metal oxides are widely employed as catalysts, Hematite nanoparticles have a very narrow bandgap, so they
optical devices, sensors, thermal conductivity enhancers, can be used as a visible-light catalyst in wastewater or
energy conversion devices, biomedical imaging, paints, opto- polluted-water purification. Here, we report a simple, low-
electronic devices, and nanodrug delivery [24–34]. Engi- cost, ecofriendly, room temperature one-step synthesis pro-
neered nanomaterials have unique properties, and their tocol for hematite nanoparticle preparation. The prepared
shape, size, and morphology can be tailored leading to out- hematite nanoparticles were air-dried and heated at different
standing properties which are limited to bulk materials. A temperatures and chemical and physical properties; then,
variety of differently structured metal oxides include nano- their various parameters were analyzed by different charac-
particles, wires, tubes, fibers, whiskers, films, layers, triangles, terization tools, and the results were summarized and
tetrapods, disc, and sheets. They are the most desired struc- explained. Aqueous Moringa oleifera leaf extract-mediated
tures widely used in technical applications, and their unique synthesis of hematite nanoparticles exhibited a room temper-
structural features are large surface-to-volume ratio, cations ature ferromagnetism with a rich coercivity value, and it
with valence states, anions with deficiencies, and depletion degraded the methylene blue dye in an aqueous solution
of carriers [1]. Among all of the metal nanoparticles, iron under visible light. Even though there are many narrow-
Journal of Nanomaterials 3

 (a) Moringa oleifera leaves (b) Moringa oleifera leaf extract

 Figure 1: Moringa oleifera.

gap metal oxides that are designed for dye degradation such was mixed with water and refluxed for 40 minutes at 70
as TiO2, WO3, and ZnO [39], these are undergoing degrees Celsius in a heating mantle. Then, the extract was
research and have not gained great attention for the degra- filtered using Whattman filter paper (No. 1) several times
dation of water pollutants under visible light in an aqueous and kept in sterile bottles under refrigerated conditions for
medium. However, iron (III) oxide has received great atten- future use. The leaf and its extract are shown in
tion. The synthesized disc-like hematite nanostructure has Figures 1(a) and 1(b).
degraded 69% of dye under sunlight. So, the reported green
preparation of hematite nanoparticles with disc-like mor- 2.3. Preparation of Leaf Extract-Assisted Hematite (α-Fe2O3)
phology promises to be a visible-light photocatalyst for Nanoparticles. Freshly prepared Moringa oleifera leaf extract
removing organic pollutants in water. The bioactive mole- (stabilizing agent and capping agent as well) was added drop
cules act as a capping and stabilizing agent in nanoparticle by drop to 100 ml of an aqueous solution of FeCl3 and stir-
formation, so we can avoid using toxic chemicals to avoid red vigorously at room temperature. Then, a few drops of
aggregation in nanoparticle formation. Hematite nanoparti- NaOH were added into the homogeneous solution under
cles are magnetic, hence they can be used as a magnetic stirring to maintain an appropriate pH; it acts as a precipi-
catalyst and could be recovered from the solution with a tating agent as well. The pale red color of the solution chan-
magnet so it will be reused in the degradation of dyes ged into a dark brown color after 4 hrs of stirring; then, the
[21, 22, 40–42]. Herein, we report a simple one-step proto- precipitation settled at the bottom of the flask as dark brown
col to produce a nanoparticle with different morphologies colloidal particles. The dark brown color indicates the for-
and with no surfactant, can act as a stabilizing and capping mation of hydrated iron nanoparticles and is shown in
agent, and is a highly stable magnetic iron oxide with a Figure 2(a). The colloidal solution was then centrifuged sev-
high coercivity value which could act as an environmentally eral times at a speed of 4000 rpm for 15 minutes in the cen-
friendly, biodegradable, magnetically separated magnetic trifuge machine and then washed several times with double-
visible-light catalyst to remove organic pollutants in an distilled water and ethanol to remove the loosely bounded
aqueous medium. impurities. After the washing process was over, the superna-
 tant was collected and dried overnight in a hot air oven at 70
2. Materials and Methods degrees Celsius. The dried dark brown samples were col-
 lected, crushed, and ground by mortar and pestle. The
2.1. Material Collection. Fresh Moringa oleifera leaves were
 ground samples were calcinated in a muffle furnace at three
collected from the southern part of Tamil Nadu, India
 different temperatures of 500, 600, and 700°C for three hours
(10.3673°N, 77.9803°E). Moringa oleifera leaves were col-
 for dehydration. This process removes the organic and other
lected from homes, and analytical grade (AR) chemicals were
 impurities, until finally, a deep-red-colored iron oxide nano-
used without further purification. FeCl3 and sodium hydrox-
 powder is obtained and is shown in Figures 2(b) and 2(c).
ide pellets (NaOH) were purchased from Alfa Aesar Pvt. Ltd.
 The dried samples were submitted to different characteriza-
(purity 98%).
 tion techniques to study the physical and chemical proper-
2.2. Aqueous Moringa oleifera Leaf Extract Preparation. ties. The formation mechanism of α-Fe2O3 is shown in
Freshly collected Moringa oleifera leaves were washed thor- Figure 2(d).
oughly with double-distilled water to remove dust particles,
weighed, and transferred into the round bottom flask, and it 2.4. Formation Mechanism of α-Fe2O3
4 Journal of Nanomaterials

 (a) Iron oxide nanoparticle (b) Hematite nanopowder
 Fecl3 Leaf extracts (FeOOH) formation+

 Phytochemicals

 Centrifuge

 Nano particles formation Stabilized NPS

 Calcination Air dry

 Iron nanoparticles stabilized by bioactive molecules

 -Fe2O3 nanoparticles formation

 (c) Hematite nanopowder (d) Formation mechanism of α-Fe2O3

 Figure 2: Hematite nanopowder prepared from Moringa oleifera leaf extract.

 (a) The role of precipitating agents in hematite nanopar- photoluminescence spectrophotometer at room temperature
 ticle formation is with an excitation wavelength of 320 nm. UV-visible spectro-
 scopic studies were conducted with a Shimadzu dual-beam
 spectrometer. The size of the nanoparticle was determined
2Fecl3 + 6NaOH → ðn − 3ÞH2 O → Fe2 O3 ⋅ nH2 OðFeOOHÞ2 + 6 NaCl by a transmission electron microscope (FEI Tecnai T20)
 accelerated at 200 kV, the morphology of the hematite nano-
 ð1Þ particles was studied using a scanning electron microscope
 (JEOL JSM-6390), and elemental analysis was performed by
 energy dispersive X-ray analysis (EDS) which is attached to
 an SEM X-ray column along with SEM images of nanoparti-
 (b) The role of phytochemicals in hematite nanoparticle cles. The functional groups were found using a Fourier trans-
 formation is to serve as capping and stabilizing agents form infrared spectrum (FTIR) spectrophotometer (Perkin
 Elmer Spectrometer) using KBr pellets in the spectral range
2.5. Material Characterization and Instrumentation. The cal- of 4000–400 cm-1. Investigation of magnetic properties was
cinated iron oxide nanoparticles were analyzed with the performed at room temperature, where a vibrating sample
PANanalytical X ′ Pert Pro Powder X-ray Diffractometer magnetometer model is employed, and here, the applied
with CuKα radiation operated at 40 kV and 30 mA and with magnetic field ranged from -15000 to +15000 (Lakeshore,
a wavelength of λ = 1:54060 Å in the range of 2θ = 10 − 80° . USA, model 740 equipped with a 2.17 T magnetic field).
The photoluminescence spectra studied with the 300– Thermal properties were analyzed by the thermal analyzer
700 nm regions were recorded with a Varian Cary Eclipse NETZSCH STA 449 F3 Jupiter which performs simultaneous
Journal of Nanomaterials 5

TG-DSC measurement on the sample. Dielectric properties 104
were characterized by an a.c. impedance spectroscopy and 110
dielectric analysis using the Hioki 3532-50 LCR HiTESTER 024 116
 214
meter in the frequency range of 50 Hz–5 MHz. 113 122
 300
 119
 012 217223

 Intensity (a.u.)
2.6. Photocatalytic Studies. To examine the photocatalytic
activity of the prepared samples, the methylene blue dye
was taken as a pollutant, and sunlight was used as a light 104
source. 50 ml of 10 ppm dye solution was taken, and 0.5 mg 012 110 024 116 214 217
 113
of the prepared photocatalyst was used. This experiment
was performed on a perfect sunny day, and the time was
between 12 pm and 2 pm. The aliquots of dye solution were
taken every 20 min and subjected to UV-vis spectroscopy to
analyze the change in concentration of the solution. The deg-
 10 20 30 40 50 60 70 80
radation efficiency was calculated using the following: 2 (degree)

 1−C 700°C
 η= × 100ð%Þ: ð2Þ 600°C
 C0 500°C

 Figure 3: PXRD patterns of hematite nanoparticles at 500°C, 600°C,
3. Results and Discussion and 700°C.
3.1. Structural Analysis. Phase purity, crystal structure, and
 Table 1: Crystallite size and lattice strain.
crystallinity conformed with powder X-ray diffraction
(PXRD) techniques. The synthesized IONPs (iron (III) oxide Average crystallite size(D) (nm) Lattice strain
nanoparticles) were calcined at three different temperatures Temperature W-H (×10-3)
(500, 600, and 700°C) at a muffle furnace. After air drying Debye-Sherrer’s method
 (UDM model)
in a hot air oven, it was characterized with PXRD. The dif-
fraction patterns are shown in Figure 3. At 500°C, no peak 500°C — —
was observed, which implies that the sample calcined at 600°C 23 -10.5
500°C was amorphous in nature, and there was no growth. 700°C 35 3.55
The peaks were observed to have a diffraction pattern with
poor crystallinity when the IONPs were calcined at a 600°C
 3.2. Lattice Microstrain Calculation
calcination temperature, whereas the peaks were observed
with good crystallinity when they were calcined at 700°C. 3.2.1. W-H Plot Method with UDM (Uniform Deformation
The IONPs calcined at 600 and 700°C temperatures have a Model). The microstrain of the hematite nanopowder was
pure hematite phase (α-Fe2O3), and it belongs to the rhom- found by the William–Hall method. Let it be considered that
bohedral crystal structure with the R-3c space group. The the strain is uniform in all crystallographic directions due to
space group number is 167 and is affirmed by diffraction the isotropic nature of crystals.
peaks which are illustrated in Figure 3. The lattice constant The lattice microstrain can be estimated from the follow-
values are a = 5:0285 Å, b = 5:0285 Å, c = 13:7360 Å. All ing formalism:
peaks were indexed according to ICDD reference number
01-079 0007. The XRD patterns clearly show that there are K ⋅λ
no additional peaks belonging to other phases of the iron β cos θ = + ð4ε sin θÞ, ð4Þ
 D
oxides (β-Fe2O3, ε-Fe2O3, and γ-Fe2O3) and magnetite
(Fe3O4). Hence, pure α-Fe2O3 hematite nanoparticles have
 where β is strain broadening, K is the dimensionless shape
been formed through this single-step biogenic synthesis.
 factor (0.9), ε is the lattice strain, D is the crystallite size, λ
 Debye-Scherrer’s formula was employed to calculate the
 is the X-ray wavelength for the Cukα radiation (1.5406 Å),
average crystallite size of IONPs as shown below:
 and θ is Bragg’s diffracting angle.
 β cos θ values were taken from the y-axis, and 4 sin θ
 K ⋅λ
 D= , ð3Þ values were taken from the x-axis, respectively. Then, fitted
 β cos θ linearly from the slope (gradient) value, the lattice strain
 was calculated. Owing to the existence of the tensile strain
where K is the shapeless factor, λ is the X-ray wavelength for and compression on the lattice, the positive and negative
Cukα radiation (1.5406 Å), D is crystallite size, θ is Bragg’s slopes (strain) were observed from the W‐H plot. The calcu-
diffracting angle, β is full-width half maximum (FWHM) lated strain is shown in Table 1, and the W‐H plot is shown
strain broadening. Calculated crystallite size is shown in in Figure 4.
Table 1. The crystallite size has increased with rising heat
treatment. The trend of a linearly increasing crystallite size 3.3. Surface Morphology, Size of the Particle, and Elemental
with temperature is matched with the previous reports. Composition Analysis. The particle dispersion, crystallinity,
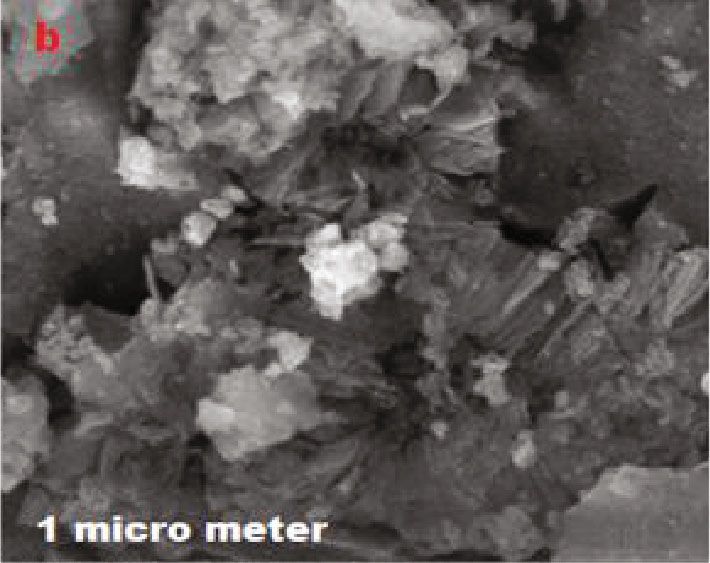
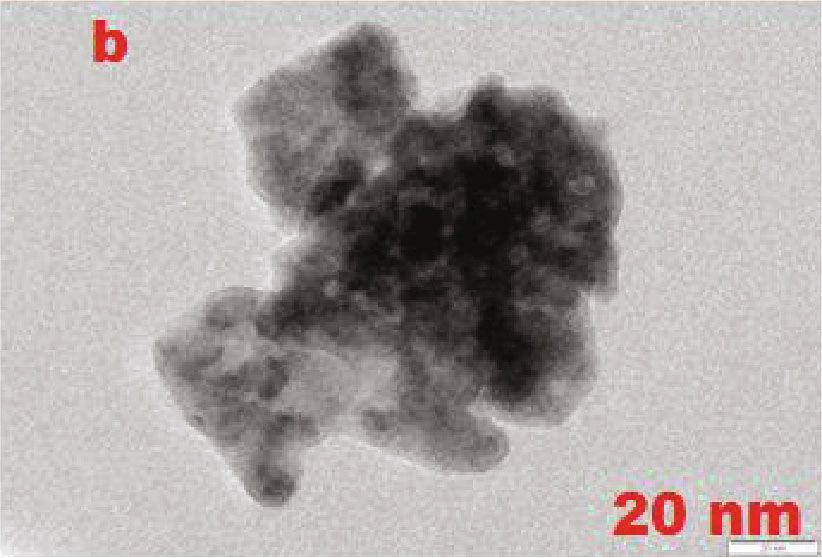
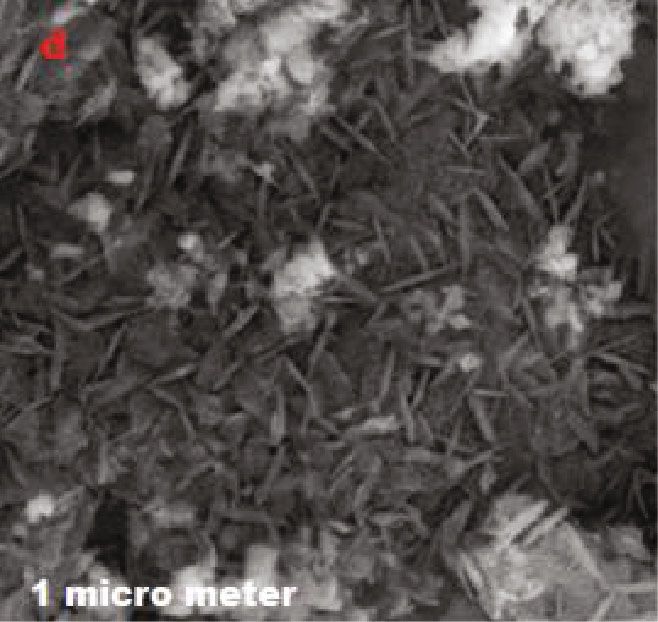
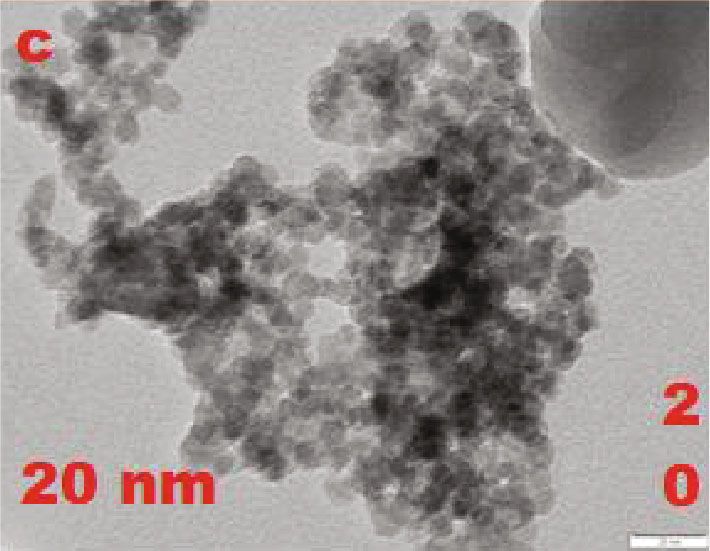
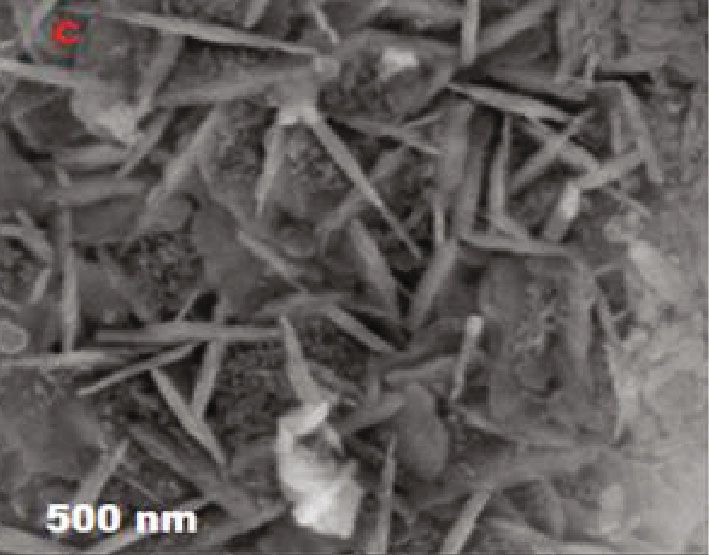
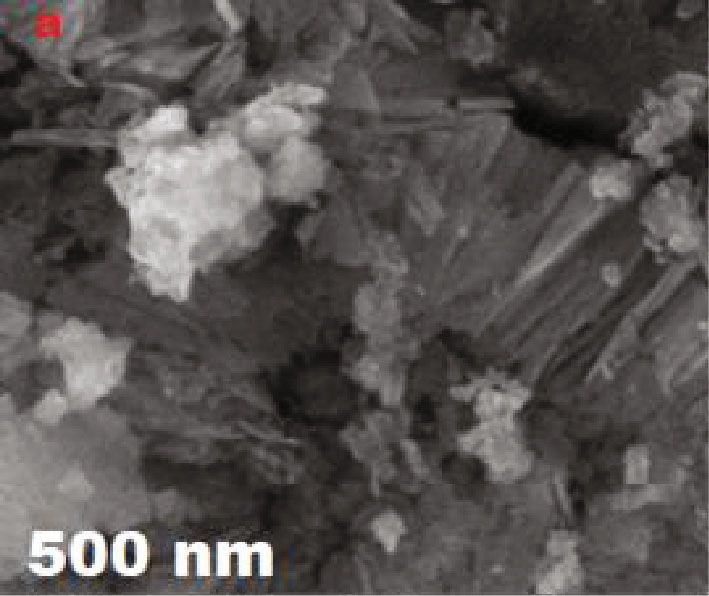
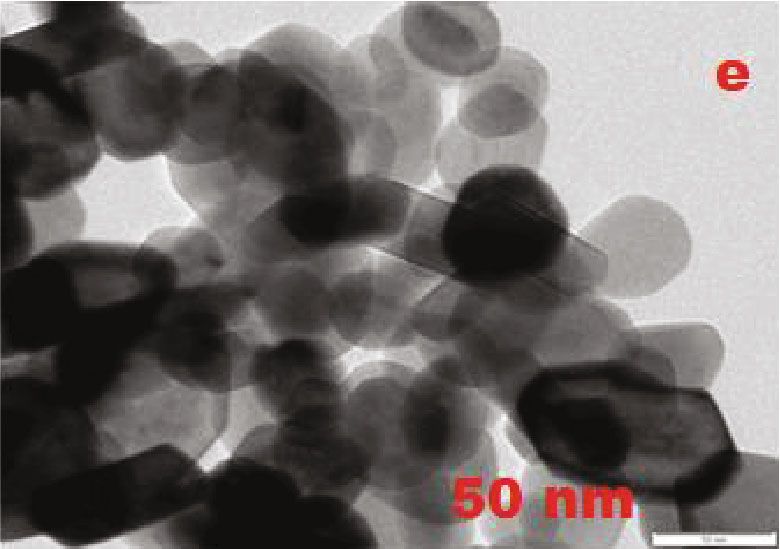
6 Journal of Nanomaterials

 0.022
 0.020 Fe2O3 600°C 0.010
 -Fe2O3 700°C
 0.018 0.009

 0.016 0.008
 y = 0.00355x−0.00126
 0.014 0.007
 y = −0.01051x+0.02453
 B cos

 0.012

 cos
 0.006
 0.010
 0.005
 0.008
 0.004
 0.006
 0.004 0.003

 0.002 0.002

 0.8 1.0 1.2 1.4 1.6 1.8 2.0 2.2 0.8 1.0 1.2 1.4 1.6 1.8 2.0 2.2 2.4
 4 sin 4 sin
 (a) (b)

 Figure 4: William-Hall’s plot of α-Fe2O3 at 600°C (a) and 700°C (b).

morphology, and size were observed from SEM (scanning particles are nano in size, and this is in good agreement
electron microscope) and TEM (transmission electron with XRD reports.
microscope) imaging techniques. SEM micrographs are The elemental concentration of hematite nanoparticles
shown in Figure 5. In the air-dried samples that were calcined that was determined from the EDX spectrum is shown in
at 500°C, all the particles were aggregated and it seems that (Figure 7(a)). The EDX spectrum confirmed that it has only
there was a sheet-like morphology as observed in Fe and O elements. The obtained atomic percentage of Fe
Figures 5(a) and 5(b). In samples that were calcined at and O was clearly tabulated and indicated as an inset in the
600°C, a nanoplate-like morphology was formed as shown EDX spectra (Figure 7(b)). It was also observed that it has a
in Figures 5(c) and 5(d), and it started to grow and a clear good stoichiometric ratio of Fe and O.
hexagonal nanodisc morphology was observed at 700°C as
shown in Figures 5(e) and 5(f). A temperature-dependent 3.4. Optical Properties. Absorbance and diffuse reflectance
morphology was observed from the SEM micrographs, and spectra of hematite nanoparticles have been discussed, and
it was clearly seen to be regular and clustered, with clear their optical properties have been reported here. The elec-
shapes that could be observed. Shape transformation was a tronic transitions occur in iron oxide nanoparticles because
function of calcination temperatures and could be a reason they are magnetically coupled and exhibit ligand-to-metal
for yielding high-crystallinity IONPs.. charge transfer (LMCT). These are the origins for the elec-
 In order to confirm the morphology, the size of the parti- tronic transition within the shell of the 3d5 orbital of Fe3+ ions
cle, and the nature of crystallinity of the nanostructured hema- and could be the reason why the absorption bands are
tite particles, TEM imaging techniques and SAED (selected exhibited in iron oxides from UV to near IR wavelengths.
area electron diffraction) pattern analysis were employed. First, Fe3+ cations appear in adjacent sites which are magnet-
The bright field images of TEM of the samples are shown in ically coupled. Secondly, ligand field transitions of Fe3+
Figure 6. The sample was annealed at 500°C, and a sheet-like occur, and then there is charge transfer from ligand to metal
morphology can be seen in Figures 6(a) and 6(b). At 600°C (LMCT). The double excitation process is the reason for the
and 700°C, the hematite nanoparticles have exhibited bands appearing in the visible region. This means that excita-
nanoplate-like morphology and hexagonal nanodisc morphol- tion occurs within two adjacent Fe ions or a pair of Fe3+ ions.
ogy as illustrated in Figures 6(c)–6(f). To further confirm the This process yields the absorption band at the visible region,
crystallinity of IONPs, SAED pattern analysis was employed. so the hematite color is red. The transition process from 6 A
The SAED micrographs of the hematite nanoparticles are 1ð6 SÞ + 6A1ð6 SÞ to 4 T1ð4 GÞ + 4 T1ð4 GÞ occurs due to a pair
shown in Figure 6. The sample that was calcined at 500°C of excitation processes, so the band is absorbed at the visible
has only diffuse rings, and no bright spots were observed at region (400–600 nm) [43, 44].
the diffraction pattern. So we conformed that the sample is
amorphous in nature, as shown in Figure 6(g). The SAED 3.5. Absorbance Spectrum and Band Gap Calculation (before
patterns of samples which were annealed at 600°C and Calcination). UV-vis absorbance spectroscopy explains the
700°C have discrete tiny bright and sharp spots which optical property and electronic structure of the nanoparticles.
make up the ring. This implies that the IONPs are crystal- The UV-visible absorption spectrum and Tauc plot of hema-
line in nature, as shown in Figures 6(h) and 6(i). This is in tite nanoparticles is shown in Figures 8(a) and 8(b). It was
conformity with the TEM micrographs showing all the taken once the nanoparticles were formed, that is, before
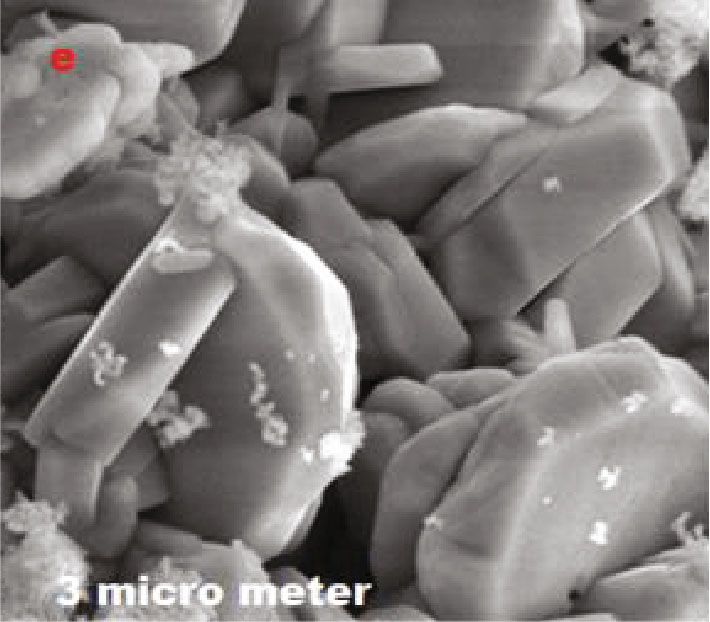
Journal of Nanomaterials 7

 (a) (b)

 (c) (d)

 (e) (f)

 Figure 5: SEM images of hematite nanoparticles at 500°C (a, b), 600°C (c, d), and 700°C (e, f).

calcination. The absorbance spectrum was recorded in the 3.6. DRS Spectrum and Band Gap Calculation (after
range of 200 nm to 800 nm. The absorption band edge was Calcination). The optical properties of hematite nanoparti-
found at 459 nm in the visible region, and the energy band cles were studied from the reflectance spectrum, and they
gap value is 2.7 eV. The optical band gap (Eg) value was com- were analyzed by diffuse reflectance spectroscopy (DRS). It
puted from the Tauc plot using the following: was done after calcination of the samples. It was recorded
 in the range of 200 nm to 800 nm in reflectance mode. The
 Aðhv − EgÞn optical band gap energy of hematite nanoparticles was calcu-
 α= , ð5Þ lated by the Kubelka-Munk function:
 hv

where α is the absorption coefficient, Eg is the optical band
gap of the hematite nanoparticles, A is a constant, hν is the ð1 − R Þ2
 F ðR Þ = , ð6Þ
energy of the photon, n is the nature of transitions. 2R
8 Journal of Nanomaterials

 (a) (b)

 (c) (d)

 (e) (f)

 (g) (h)

 Figure 6: Continued.
Journal of Nanomaterials 9

 (i)

 Figure 6: TEM images and SAED patterns of hematite nanoparticles at 500°C (a, b, and g), 600°C (c, d, and h), and 700°C (e, f, and i).

 c:\edax32\genesis\genspc,spc 09-Oct-2017 10:57:53
 chlorite (Nrm,% = 38.86, 20.96, 34.83, 1.14, 3.84, 0.28) LSecs : 21
 747

 597

 448 Fe

 298

 149 O Element Wt % At %
 Fe
 OK 00.00 21.28
 0
 1.00 2.00 3.00 4.00 5.00 6.00 7.00 8.00 9.00 10.00 11.00 FeK 00.00 78.72
 Energy (keV)
 (a) (b)

 Figure 7: EDX spectra of hematite nanoparticles (a) and atomic percentage of Fe and O (b).

where R is reflectance. The graph was plotted between extract FTIR spectra exhibit four intense peaks centered at
ðFðRÞhνÞ2 and hν. The energy band gap values at different 3433 cm-1; 3452 cm-1, attributed to –OH stretching vibra-
calcination temperatures have been calculated by extrapola- tions; and a peak at 1636 cm-1assigned to –OH bending
tion of the linear part of ðFðRÞhνÞ2 at the x-axis plot to the vibrations owing to contamination of the sample during
intersection with hν at the y-axis. The intercept value is the analysis or ambient water molecules or signal distortions
energy band gap of hematite nanoparticles. The calculated [51–53]. The band observed at 1034 cm-1 corresponds to
Eg values of 1.7 eV, 1.5 eV, and 1.2 eV for 500, 600, and the aromatic stretching of various bioactive compounds
700°C are illustrated in the KM plot, as shown in and proteins [54, 55]. None of the peaks was observed at
Figure 8(c). The band gap value has decreased when increas- 2900 cm-1 since the phytochemicals had been removed dur-
ing temperature was observed owing to the growth of parti- ing the calcination process. The transformation from an enol
cles and crystallinity, and the value matches well with form to a keto form is due to the presence of flavonoids and
previous reports [1]. The smallest band gap was observed phenols. This mechanism reduces the metal ions and forms
when calcined at 700°C [45–49]. A significant blue shift was nanoparticles since it releases reactive H atoms and forms
observed owing to a quantum confinement effect [50]. the O-H group since the phenol group has an electron-
 donating ability [55, 56]. The metal oxide characteristic
3.7. Functional Group Analysis. The FTIR spectrum of hema- absorption band arises from below 1000 cm-1 to form inter-
tite nanoparticles is shown in Figure 9. FTIR analysis is a atomic vibrations. The peak observed at 431 cm-1 indicates
tool used to identify the functional groups which are respon- the presence of Fe2O3; moreover, the peaks were present at
sible for the formation of metal oxides in plant leaf extract- 958 cm-1 and 651 cm-1 attributed to the Fe-O stretching
mediated synthesis. The FTIR spectrum was recorded at and Fe-O-Fe bridging stretching modes [53, 56, 57]. Then,
the wave number of 400-4000 cm-1. Moringa oleifera leaf FTIR analysis results were used to identify the functional
10 Journal of Nanomaterials

 Absorption (a.u.)

 ( h )2 (a.u.)
 2.7 eV
 459 nm

 200 300 400 500 600 700 800
 1.0 1.5 2.0 2.5 3.0 3.5 4.0
 Wavelength (nm)
 h (eV)
 Fe2O3
 Fe2O3

 (a) (b)

 2 eV
 KM ((1−R)2/2R)

 2.1 eV

 2.2 eV

 1.0 1.2 1.4 1.6 1.8 2.0 2.2 2.4 2.6 2.8 3.0 3.2 3.4 3.6 3.8 4.0
 Photon energy (eV)
 500°C
 600°C
 700°C
 (c)

 Figure 8: Absorption spectra and Tauc plot (a, b) and KM plot of diffuse reflectance spectra (c).

groups and phytochemicals which are responsible for stabi- mograph. The first weight loss takes place due to the OH
lizing and reducing hematite nanoparticles. groups present at the surface, so water molecules have been
 removed. The second weight loss is due to the phytochemi-
3.8. Thermal Analysis (TG, DTA, and DSC). Thermal analysis cals present in the hematite nanoparticles which evaporated.
of hematite nanoparticles has been carried out from room And the third weight loss is due to the formation of a
temperature to 1200°C. The sample to be analyzed is placed completely pure alpha-Fe2O3 phase [58–60]. The endother-
on an alumina crucible, and the samples are heated in an mic peaks were observed at the DTA thermograph at 286,
air atmosphere at the range of 10°C/min. The TGA/DTA 916, and 910°C temperatures. The peaks were obtained in
and DSC thermographs of the nanoparticles are shown in the DSC thermograph due to the evaporation of water and
Figure 10. The synthesis is the green mediated one so the organic substances and crystallization of iron oxide [58–60].
phytochemicals were conjugated with hematite nanoparticles
so it will be removed during the heat treatment. We can con- 3.9. Surface Defect Analysis (Photoluminescence Properties).
firm this one from weight loss information from the TGA The room temperature photoluminescence property of
curve. The weight loss information and the exothermic and hematite nanoparticles has been studied to elucidate the sur-
endothermic peaks were studied from the TGA/DTA ther- face defects, to study the quantum size effect, and to explore
Journal of Nanomaterials 11

 emission band is centered at the 404 nm wavelength (3 eV)
 100 due to F+ (or VO+1) centers [63]. The blue emission is cen-
 1256 1034 tered at around 491 nm and arises due to structural defects
 80 which act as defect donors from Vo and acceptor states from
 Transmittance (%)

 1636 Fe3+ vacancies in n-type semiconductor metal oxides which
 can be induced both by the new energy levels in the band
 60
 615 gap [62, 64, 65] and by the hole trapped at the metal ion
 vacancy; it was assigned to theF 2 center [66, 67]. The orange
 40 3453
 958 emission arises at 592 nm due to the relaxation luminescence
 of defect centers F 1+ +1 0
 2 (or VO + VO ) created because of
 20 mechanical stress [63, 66, 67]. The emission may call broader
 1837
 Gaussian fit emissions at 592 nm. The emission band arises in
 431
 0 the UV region due to oxygen vacancies (surface defects). The
 4000 3500 3000 2500 2000 1500 1000 500 high intense green emission band centered at 521 nm,
 Wave number (cm−1) 535 nm, and 544 nm wavelengths is attributed to oxygen
 500°C 700°C
 vacancy F(VO 0 ) centers. Band gap emission indicates that
 600°C MO (leaf extract) the hematite nanoparticles have structural defects and rich
 oxygen vacancies. The oxygen vacancy Vo present at the
Figure 9: FTIR spectra of hematite nanoparticles and Moringa defect side are good electron scavengers in photocatalytic
oleifera leaf extract. activity [62]. Peak intensities have been increased with rising
 calcination temperatures. Owing to the size-associated opti-
the optical properties. The possible emission band is shown cal properties in iron oxide nanoparticles, the self-trapped
in photoluminescence spectra for all the samples obtained states are observed. The same emission band observed in all
at different calcination temperatures. The PL spectra were the three samples was obtained at different calcination
recorded at room temperature with a xenon lamp as an exci- temperatures. The PL optical study has given the physical
tation light source. The hematite nanoparticles that were property of the materials. So, according to the above study,
excited with the 320 nm wavelength and the emission spectra alpha-Fe2O3 will be used as a potential material for optoelec-
that were recorded are shown in Figure 11. The bulk hematite tronic applications [37].
nanoparticles do not show the photoluminescence emission
because of forbidden d‐d transition, magnetic relaxation, 3.10. Magnetic Property (M-H Loop Analysis). The magnetic
and an efficient lattice [44, 61, 62]. The magnetic nanoparti- hysteresis loop of the hematite nanoparticleM-Hcurve under
cles have quantum confinement effects so electronic states of room temperature-dependent field magnetization is shown
a nanometal oxide relax the forbidden rule in d‐d transition, in Figure 12. The parameters obtained from VSM magnetic
and partial optical transition is allowed so it exhibits the PL saturation (Ms), remanent magnetization (Mr), and hard
spectra [44]. Nanostructured metal oxides have a high coercivity (Hc) are tabulated and shown in Table 2. Here,
surface-to-volume ratio, so they have a large surface area hematite nanoparticles exhibit ferromagnetic behavior at
associated with defects and they create more oxygen vacan- room temperature which was observed from the obtained
cies. Because they have a large surface area, nanomaterials results and the M-H curve. The Ms values of all the three
have dangling bonds [62] Generally, holes from the valence samples obtained at different calcination temperatures are
band and electrons from the electronic states are recombined 4.8216, 3.1946, and 0.54164 emu g-1 while comparing bulk
with each other; this is responsible for the emission, that is, iron oxide nanoparticles. These values are low since the Ms
electronic transition behavior occurs within the transition value for bulk iron oxide is 92 emu g-1 [35]. These low Ms,
metals. The emission band originates from to the quantum Mr, and Hc values of hematite nanoparticles clearly indicate
confinement effect and the influence of particle size [62]. that they are in a nanodimension. Hematite nanoparticles are
PL spectra in hematite nanoparticles cover a broad range antiferromagnetic in nature since the spins are aligned anti-
from UV to near the orange visible region. The hematite parallel in adjustment planes and parallel in the same plane
nanoparticles have a multicolor emission peak from near [37], but here, we report the obtained nanoparticles at differ-
UV to the orange color band in the visible region (363 nm- ent calcination temperatures having an unusual magnetic
592 nm) in all the samples due to surface modification. property owing to surface defects, different crystal structures,
There is a multicolor emission band observed in various nanosizes of the particles, shapes, single domains, and surface
regions. The near UV emission band is centered at 363 nm charges [36, 38, 68, 69]. Bulk iron oxides have a magnetic
(3.41 eV), the violet band at 405 nm (3.0 eV), the green band property owing to the multiple domains present there. Each
at 521-544 nm, and the orange band at 592 nm wavelengths, domain has spins aligned in the field direction, and uniform
respectively. The first peak is observed at 363 nm (3.41 eV) magnetization could be separated by each domain wall.
owing to the recombination of holes and electrons and is Nanodimension iron oxides have a single domain, and the
attributed to exciton emission, and the last peak is a weak spins are aligned in the same direction with the applied field
band observed at 592 nm and attributed to band edge direction; hence, the coercivity value has been increased [37].
transition owing to defects at the forbidden energy region Unusual ferromagnetic behavior is observed in all three
and Fe3+ ligand field transition [44, 61, 62]. The violet samples because of the uncompensated magnetic spin of
12 Journal of Nanomaterials

 TG (%) DTG (%/min) TG (%) DSC/mW/mg
 110 0.5 100
 0.0 2
 95
 100 Mass change: 31.42% −0.5
 90 1
 Mass change: 25.03% −1.0
 85
 90 −1.5 0
 −2.0
 80
 −1
 80 −2.5 75
 Mass change: 5.17%
 −3.0 70 −2
 70 −3.5 65
 Residual mass: 68.58% (1198.7°C) −3
 −4.0
 0 200 400 600 800 1000 1200
 60
 Temperature (°C) 0 200 400 600 800 1000 1200
 Temperature (°C)
 (a) (b)

 Figure 10: TGA/DTA (a) TG-DSC (b) thermograph of hematite nanoparticles.

 363 nm Fe3+-O2--Fe3+ interactions and yields the uncompensated
 spins [69]. Here, we have observed that the hematite nano-
 disc obtained at 700°C has a wide loop hysteresis curve with
 enhanced coercivity which indicates strong ferromagnetic
 behavior in a hematite nanodisc. A high coercivity value
 Intensity (a.u.)

 521 nm has been achieved because of the anisotropy particle mor-
 535 nm 592 nm phologies and subparticle structure present in hematite
 505 nm 544 nm nanoparticles [71]. The coercivity value increases with
 405 nm respect to temperature due to variations in the crystallite size
 and the particle size of hematite nanoparticles [72]. The sam-
 ples are calcined at different temperatures, so the hysteresis
 curve also seems to be different at various temperatures. At
 500°C, weak ferromagnetism is exhibited, as shown in
 Figures 12(a)–12(c), whereas at 600 and 700°C, room
 300 350 400 450 500 550 600
 Wavelength (nm)
 temperature ferromagnetism is exhibited, as shown in
 Figures 12(c)–12(f). So the hematite nanodisc obtained at
 700°C
 600°C
 700°C and 600°C could be potential and promising materials
 500°C for ferromagnets.

Figure 11: Photoluminescence emission spectra of hematite 3.11. Frequency Dependence Electrical Property of
nanoparticles. Hematite Nanoparticles
 3.11.1. Real Part of Dielectric Constant (ε ′ ). The hematite
Fe3+ cations [37, 38]. Here, spin order coupling takes place in nanoparticles are pelletized by hydraulic pressure and
between the two adjacent planes; it could be called canting coated with silver paste on the surface to create better con-
spin structure [37]. The sample obtained at a 700°C calcina- ductions. Frequency dependence of dielectric properties
tion temperature has an Hc value of 2761.0 Oe, which is high was studied with varying temperatures from RT to 180°C
when compared to the other two sample Hc values obtained (30°C, 80°C, 130°C, and 180°C). To design an energy storage
at 600 and 500°C calcination temperatures, and it has not device, the dielectric constant and dielectric breakdown
reached saturation due to parasitic magnetism where the strength are the important parameters for calculating the
electron spin was not rigid at an antiparallel arrangement energy density of the dielectrics. Dielectric loss is an impor-
[70]. The three samples were showing the same RTFM tant parameter for capacitor performance. The capacitance
behavior. The Ms value has decreased while the temperature loss factor is measured by the parallel plate capacitor
increased because of the increasing trend of crystallite size method using an LCR meter for the frequency range
[68]. Increasing calcination temperature has created the between 100 Hz and 5 MHz with different temperatures
point defects of oxygen vacancies since oxygen vacancies (30°C, 80°C, 130°C, and 180°C). The dielectric constant is
are close to the surface. So, a point defect has been induced calculated using the following:
at the surface since it created more oxygen vacancies. It might
be one of the reasons for the ferromagnetic nature of
 Cp × t
hematite nanoparticles [68, 69]. Antiferromagnetic behavior εr = , ð7Þ
can be destroyed by point defects, so RTFM arises owing to ε0 × A
Journal of Nanomaterials 13

 −15000 −10000 −5000 0 5000 10000 15000
 6 6 −1500 −1000 −500 0 500 1000 1500
 2.0 2.0
 4 4
 Magnetic moment/mass (emu/g)

 1.5 1.5

 Magnetic moment/mass (emu/g)
 2 2 1.0 1.0

 0.5 0.5
 0 0
 0.0 0.0

 −2 −2 −0.5 −0.5

 −1.0 −1.0
 −4 −4
 −1.5 −1.5

 −6 −6 −2.0 −2.0
 −15000 −10000 −5000 0 5000 10000 15000 −1500 −1000 −500 0 500 1000 1500
 Field (G) Field (G)
 Fe2O3 500°C Fe2O3 500°C

 (a) (b)

 −1200 −900 −600 −300 0 300 600 900 1200 −15000 −10000 −5000 0 5000 10000 15000
 6 6 4 4

 3 3
 4 4
 Magnetic moment/mass (emu/g)
 Magnetic moment/mass (emu/g)

 2 2

 2 2
 1 1

 0 0 0 0

 −1 −1
 −2 −2
 −2 −2
 −4 −4
 −3 −3

 −6 −6 −4 −4
 −1200 −900 −600 −300 0 300 600 900 1200 −15000 −10000 −5000 0 5000 10000 15000
 Field (G) Field (G)

 Fe2O3 500°C Fe2O3 600°C

 (c) (d)

 Figure 12: Continued.
14 Journal of Nanomaterials

 −5000 −4000 −3000 −2000 −1000 0 1000 2000 3000 4000 5000
 4 4
 −15000 −10000 −5000 0 5000 10000 15000
 3 3
 0.6 0.6
 Magnetic moment/mass (emu/g)

 Magnetic moment/mass (emu/g)
 2 2
 0.4 0.4
 1 1
 0.2 0.2
 0 0
 0.0 0.0
 −1 −1
 −0.2 −0.2
 −2 −2
 −0.4 −0.4
 −3 −3
 −0.6 −0.6
 −4 −4
 −5000 −4000 −3000 −2000 −1000 0 1000 2000 3000 4000 5000 −15000 −10000 −5000 0 5000 10000 15000
 Field (G) Field (G)
 Fe2O3 600°C Fe2O3 700°C

 (e) (f)
 −15000 −10000 −5000 0 5000 10000 15000
 5 5
 4 4
 Magnetic moment/mass (emu/g)

 3 3
 2 2
 1 1
 0 0
 −1 −1
 −2 −2
 −3 −3
 −4 −4
 −5 −5
 −15000 −10000 −5000 0 5000 10000 15000
 Field (G)
 Fe2O3 500°C
 Fe2O3 600°C
 Fe2O3 700°C

 (g)

 Figure 12: M-H curve (hysteresis loop) of hematite nanoparticles at the room temperature.

 Table 2: Magnetic parameters from the M-H (hysteresis loop) curve.

 Magnetic saturation (emu/g) Magnetic remanence (emu/g) Magnetic coercivity (Oe)
Calcination temperature(°C)
 (Ms) (Mr) (Hc)
500 4.8216 0.11358 73.022
600 3.1946 0.32480 208.90
700 0.54164 0.16078 2761.0

where ε0 is the permittivity of the free space (8:85 × 10−12 to 5 MHz, the dielectric constant increases rapidly along with
Farad per meter (F/m)), Cp is the capacitance in Farad, A an increase in frequency due to space charge polarization and
is the area of the cross-section of the pellet, and t is the interfacial polarization along with temperature increases
thickness of the pellet. from RT, as shown in Figures 13(a)–13(c). When the applied
 The five types of polarization, namely, space, charge, frequency increases, the dielectric constant value gradually
dipolar, ionic, and electronic are the reasons for the dielectric decreases, while at high-frequency range, its value is a con-
nature of materials. When frequency is applied from 100 Hz stant along with different temperatures. The same trend has
Journal of Nanomaterials 15

 1.8 × 101 Fe2O3 600°C
 Fe2O3 500°C
 3.0 × 100
 1.5 × 101
 2.5 × 100

 Dielectric constant
 1.2 × 101
 Dielectric constant

 2.0 × 100
 9.0 × 100
 1.5 × 100
 6.0 × 100
 1.0 × 100
 3.0 × 100
 5.0 × 10⁻¹
 0.0
 0.0
 2 3 4 5 6 7 2 3 4 5 6 7
 Log(F) Log(F)

 30°C 130°C 30°C 130°C
 80°C 180°C 80°C 180°C

 (a) (b)

 8 × 100 Fe2O3 700°C

 7 × 100

 6 × 100
 Dielectric constant

 5 × 100

 4 × 100

 3 × 100

 2 × 100

 1 × 100

 2 3 4 5 6
 Log(F)

 30°C 130°C
 80°C 180°C
 (c)

 Figure 13: Dielectric constant of hematite nanoparticles with different temperatures.

happened by obeying Koop’s theory owing to the Maxwell– 3.11.3. Tan Loss. The tan loss is high at low frequency but low
Wagner-type interfacial polarization. At the high-frequency at high frequency due to the constant reach of the surface
range, the dielectric constant is found constant and merges polarization value, and therefore, it limits the electrons to fol-
due to a decrease in polarization and vacancy defects [71]. low the AC signals. This is the reason for the high value at
 low frequency, which disappeared while applying high fre-
3.11.2. Imaginary Part of Dielectric Constant (ε″ ). The tan quency. The tan loss is shown in Figures 15(a)–15(c). During
loss decreased with an increase in frequency for all the tem- moderate and low frequencies, the polarization is high,
perature conditions due to the thermally activated accumula- whereas at high frequencies, charges could not follow the
tion of charge carriers and space charge polarization. The AC signals [72]. Due to the domination of the conducting
imaginary part of the dielectric constant value is large at the grains, the resistivity comes down, so the loss rises and
low-frequency range, as shown in Figures 14(a)–14(c). The saturates at a high frequency and it obeys Koop’s law. The
polarization mechanism, defects, and thermally activated tan loss is given by the following empirical relation:
mobile ion conduction are the reasons for the fast-rising
trend of the imaginary part of the dielectric constant at lower
frequencies with the thermally activated conduction of ε′
 Tan loss = : ð8Þ
mobile ions [72]. ε″
16 Journal of Nanomaterials

 3.2 × 101 Fe2O3 600°C
 2.8 × 101
 3.2 × 101
 Fe2O3 500°C
 2.4 × 101
 2.8 × 101
 2.4 × 101 2.0 × 101

 Dielectric loss
 2.0 × 101 1.6 × 101
 Dielectric loss

 1.6 × 101
 1.2 × 101
 1.2 × 101
 8.0 × 100
 8.0 × 100
 4.0 × 100
 4.0 × 100
 0.0 0.0

 2 3 4 5 6 7 2 3 4 5 6 7
 Log(F) Log(F)

 30°C 130°C 30°C 130°C
 80°C 180°C 80°C 180°C
 (a) (b)

 1.2 × 101 Fe2O3 700°C

 1.0 × 101

 8.0 × 100
 Dielectric loss

 6.0 × 100

 4.0 × 100

 2.0 × 100

 0.0

 2 3 4 5 6 7
 Log(F)
 30°C 130°C
 80°C 180°C
 (c)

 Figure 14: Dielectric loss of hematite nanoparticles with different temperatures.

3.11.4. AC Conductivity Studies. The frequency-dependent low temperature, less charge carriers are available, and there
AC conductivity of the iron oxides studied and the graph are less hoping electrons, which are the reasons for low
plotted between frequency and conductivity are shown in conduction at low frequency [73, 75]. AC conductivity is
Figures 16(a)–16(c). The AC conductivity is at a maximum calculated using the following:
at higher temperature with high frequency for all the samples
due to the presence of a charge carrier and an increase in σ = 2πf εε0 tan δ, ð9Þ
hopping electrons [73]. Moreover, it obeys the Maxwell-
Wagner two-layer model; according to this theory, the where ε0 is the permittivity of free space (8:854 × 10−12 F/m).
conductivity increases gradually along with the frequency
[74]. Due to polarization effects at the electrode and electro- 3.11.5. Impedance Analysis (Z ′ and Z ″ ). Complex impedance
lyte interface at low frequency, the variation of conductivity (Z ∗ = Z ′ + iZ ″ ) was analyzed at different temperatures on
occurs. All the values have merged at lower frequency both sides of the relaxation peak. The frequency and tem-
because the grains and grain boundaries are more active; at perature dependence of the real part of impedance (Z ′ )
Journal of Nanomaterials 17

 6.0 × 10⁻¹ Fe2O3 500°C
 Fe2O3 600°C
 1.6 × 100
 5.0 × 10⁻¹

 4.0 × 10⁻¹ 1.2 × 100
 Tan loss

 Tan loss
 3.0 × 10⁻¹
 8.0 × 10⁻¹
 2.0 × 10⁻¹

 1.0 × 10⁻¹ 4.0 × 10⁻¹

 0.0
 0.0

 2 3 4 5 6 2 3 4 5 6 7
 Log(F) Log(F)

 30°C 130°C 30°C 130°C
 80°C 180°C 80°C 180°C
 (a) (b)

 1.5 × 100
 Fe2O3 700°C

 1.2 × 100

 9.0 × 10⁻¹
 Tan loss

 6.0 × 10⁻¹

 3.0 × 10⁻¹

 0.0

 2 3 4 5 6
 Log(F)

 30°C 130°C
 80°C 180°C
 (c)

 Figure 15: Tan loss of hematite nanoparticles with different temperatures.

and the imaginary part of impedance were studied using the the conductivity with respect to frequency. At high fre-
following: quency, the part of the impedance value has merged due to
 the release of the space charge because of the reduction of
 g the barrier properties or the accumulation of charges at the
 Z′ = , electrode surface along with the rise of the temperature [76,
 Cp2 ω2 +G
 ð10Þ 77]. A decreasing trend of the Z ′ value at high frequency is
 Cpω
 Z″ = , almost low in all the samples.
 Cp2 ω2 + G Oxygen vacancies in the metal oxides and relaxation
 process in the materials are the reasons why the frequency-
where ω is 2πf , G is conductance, Cp is the static capaci- dependent imaginary part of impedance shifted to a higher
tance of materials. frequency with an increase in temperature. At higher temper-
 ature, the values are saturated and merged at higher frequency
3.11.6. Real Part of Impedance (Z ′ ). The increasing trend of [76, 77], as shown in the supplementary information and in
frequency and temperature would decrease the real part of Figures 17(b), 17(d), and 17(f).
the impedance value owing to a space charge effect, and the
values are saturated at high frequency as shown in the figure
which is given in the supplementary information and in 3.11.7. Cole-Cole Plot or Nyquist Plot. The graph plotted
Figures 17(a), 17(c), and 17(e) where there is an increase in between the real part of impedance (Z ′ ) and the imaginary
18 Journal of Nanomaterials

 3.5 × 10⁻⁵ 3.6 × 10⁻⁵
 Fe2O3 500°C Fe2O3 600°C
 3.2 × 10⁻⁵
 3.0 × 10⁻⁵
 2.8 × 10⁻⁵
 2.5 × 10⁻⁵
 2.4 × 10⁻⁵
 AC conductivity

 AC conductivity
 2.0 × 10⁻⁵ 2.0 × 10⁻⁵

 1.5 × 10⁻⁵ 1.6 × 10⁻⁵
 1.2 × 10⁻⁵
 1.0 × 10⁻⁵
 8.0 × 10⁻⁶
 5.0 × 10⁻⁶ 4.0 × 10⁻⁶
 0.0 0.0
 2 3 4 5 6 7
 LogF(Hz) 2 3 4 5 6 7
 Log(F)
 30°C 130°C 30°C 130°C
 80°C 180°C 80°C 180°C
 (a) (b)

 4.0 × 10⁻⁵
 Fe2O3 700°C
 3.5 × 10⁻⁵
 3.0 × 10⁻⁵
 2.5 × 10⁻⁵
 AC conductivity

 2.0 × 10⁻⁵
 1.5 × 10⁻⁵
 1.0 × 10⁻⁵
 5.0 × 10⁻⁶
 0.0

 −5.0 × 10⁻⁶
 2 3 4 5 6 7
 Log(F)
 30°C 130°C
 80°C 180°C
 (c)

 Figure 16: AC conductivity of hematite nanoparticles with different temperatures.

parts of impedance (Z ″ ) are shown in Figures 18(a)–18(c)). exhibited only hematite nanodisc methylene blue degrada-
From Figure 18, the semicircle with distinct radii appears at tion in aqueous medium. The degradation process went on
low frequency due to grain boundaries [75–77]. The semicir- under sunlight since its band gap energy is at the visible
cle decreases with increasing temperature due to the negative region of the electromagnetic spectrum. The reason for pick-
temperature coefficient of materials which are promising ing the nanodisc for degradation is because, based on TG-
materials for thermistor applications. DSC and XRD reports, a complete hematite structure was
 formed after 500 degree Celsius. To study the photocatalytic
3.12. Visible-Light-Driven Photodegradation of Methylene activity, the prepared sample was dispersed in dye solution
Blue Dye by Hematite Nanodisc and kept in the dark for 1 hour to achieve adsorption-
 desorption equilibrium. The time-dependent UV spectrum
3.12.1. Photocatalytic Analysis of Fe2O3 NPs. The key factors of a hematite nanodisc sample is shown in Figure 19(a).
to determine the photocatalytic activity of the hematite nano- The change in concentration with respect to reaction time
particles are atomic structure, surface area, and its electronic is shown in Figure 19(b). The main factors that degrade the
structure. The SEM analysis revealed that the synthesized dye molecules are hydroxyl radicals (•OH), superoxide
nanoparticles have different morphologies such as nanodiscs, anions (•O2−), and light. When the semiconductor metal
nanoplates, and sheets at 700, 600, and 500 degrees Celsius, oxide sample is exposed to a light source, the free electrons
and its band gap has been calculated from the DRS spectrum. on the surface of the sample will absorb the light photons
Its band gap energy is 1.7 eV, 1.5 eV, and 1.2 eV. Here, we and are excited from a valance band to a conduction band.
Journal of Nanomaterials 19

 1.2 × 10⁹ 5 × 10⁸ Fe2O3 500°C
 Fe2O3 500°C
 1.0 × 10⁹
 4 × 10⁸
 8.0 × 10⁸
 3 × 10⁸

 Z″
 6.0 × 10⁸
 Z′

 2 × 10⁸
 4.0 × 10⁸

 1 × 10⁸
 2.0 × 10⁸

 0.0 0
 3 4 5 6 7
 2 3 4 5 6 7 Log(F)
 Log(F) 30°C 130°C
 80°C 180°C
 30°C 130°C
 80°C 180°C
 (a) (b)

 Fe2O3 600°C 8 × 10⁷
 2.0 × 10⁸ Fe2O3 600°C
 7× 10⁷

 1.5 × 10⁸ 6× 10⁷

 5× 10⁷
 Z′

 Z″

 1.0 × 10⁸ 4× 10⁷

 3× 10⁷
 5.0 × 10⁷
 2× 10⁷

 0.0 1× 10⁷

 0
 2 3 4 5 6 7 3 4 5 6 7
 Log(F) Log(F)

 30°C 130°C
 30°C 130°C
 80°C 180°C
 80°C 180°C
 (c) (d)

 1.4 × 10⁸ 1.6 × 10⁸ Fe2O3 700°C
 Fe2O3 700°C
 1.2 × 10⁸ 1.4 × 10⁸
 1.2 × 10⁸
 1.0 × 10⁸
 1.0 × 10⁸
 8.0 × 10⁷ 8.0 × 10⁷
 Z″
 Z′

 6.0 × 10⁷ 6.0 × 10⁷
 4.0 × 10⁷
 4.0 × 10⁷
 2.0 × 10⁷
 2.0 × 10⁷
 0.0
 0.0 −2.0 × 10⁷
 2 3 4 5 6 7
 2 3 4 5 6 7 Log(F)
 Log(F)
 30°C 130°C
 30°C 130°C 80°C 180°C
 80°C 180°C
 (e) (f)

 Figure 17: Real part and imaginary part of impedance (Z ′ and Z ″ ) at 500 C (a, b), 600°C (c, d), and 700°C (e, f).
 °
You can also read