Hydrochemistry and Evolution of Water Quality in a Context of Aridity and Increasing Agriculture in Three River Sub-Basins of Santiago Island ...
←
→
Page content transcription
If your browser does not render page correctly, please read the page content below
geosciences

Article
Hydrochemistry and Evolution of Water Quality in a Context of
Aridity and Increasing Agriculture in Three River Sub-Basins
of Santiago Island (Cape Verde)
Nemias Gonçalves, Teresa Valente * , Jorge Pamplona                          and Isabel Margarida Horta Ribeiro Antunes

                                          Campus de Gualtar, ICT, University of Minho, 4710-057 Braga, Portugal; moniznemias1983@gmail.com (N.G.);
                                          jopamp@dct.uminho.pt (J.P.); imantunes@dct.uminho.pt (I.M.H.R.A.)
                                          * Correspondence: teresav@dct.uminho.pt

                                          Abstract: In regions under development and facing recurrent droughts, increasing the area of
                                          irrigated agriculture may create additional disruption in water resources management. The present
                                          study was focused on three river sub-basins with the highest agricultural intensity (S. Miguel, Ribeira
                                          Seca and S. Domingos) in Santiago Island (Cape Verde). Sets of wells were selected to evaluate
                                          the influence of salinization and agriculture practices on the hydrochemistry. This assessment
                                          was performed by using data from the bibliography (2003) and a recent campaign (2016). The
                                          water chemistry indicates lower mineralization in the S. Miguel sub-basin. Nitrates and nitrites,
                                          typically associated with diffuse pollution, are present in all sub-basins, but with varying patterns.

                                   Additionally, sodium chloride waters occur in all the three sub-basins, especially those closest to the
                                          coastline. In turn, a bicarbonate-magnesium facies was identified in S. Domingos, at the furthest point
Citation: Gonçalves, N.; Valente, T.;
                                          from the coast, indicating a geological control. The comparison between the two periods suggests a
Pamplona, J.; Antunes, I.M.H.R.
Hydrochemistry and Evolution of
                                          decrease in water quality. The rising extension of the irrigation area associated with aridity should
Water Quality in a Context of Aridity     intensify the already observed soil salinization. Thus, the present review highlights the strategic
and Increasing Agriculture in Three       importance of water monitoring at the basin level as a management tool for resources preservation in
River Sub-Basins of Santiago Island       insular arid and developing regions.
(Cape Verde). Geosciences 2021, 11,
263. https://doi.org/10.3390/             Keywords: river basin; agriculture pressure; hydrochemistry; water quality; salinization risk
geosciences11060263

Academic Editors: Dimitris Tigkas
and Jesus Martinez-Frias                  1. Introduction
                                               The sustainable use of natural resources, especially water, has assumed an increasing
Received: 8 April 2021
                                          relevance in unfavorable contexts, such as arid and semi-arid climates. The challenges to
Accepted: 14 June 2021
Published: 21 June 2021
                                          adequate resource management are even greater in territories subject to anthropogenic
                                          pressures associated with population growth and unregulated economic activities, as is the
Publisher’s Note: MDPI stays neutral
                                          case in many developing countries.
with regard to jurisdictional claims in
                                               Current scenarios of climate disruption, characterized by increasingly frequent and
published maps and institutional affil-
                                          persistent droughts, make the preservation and sustainable management of the territory
iations.                                  and its resources even more pressing in regions such as the west coast of Africa.
                                               Water, a fundamental component of life and essential to a wide variety of economic
                                          activities, is one of the most abundant natural resources on the planet, but also one of the
                                          most susceptible to degradation. The need for its use for human consumption (e.g., drinking
                                          and cooking), and also for the development of activities such as agriculture, transport,
Copyright: © 2021 by the authors.
Licensee MDPI, Basel, Switzerland.
                                          industry and recreation, highlights the critical nature of this resource. It is, however, a
This article is an open access article
                                          limited and limiting resource, as shown by the recurrent water scarcity problems in many
distributed under the terms and
                                          parts of the world, sometimes with tragic consequences [1].
conditions of the Creative Commons             The Cape Verde Archipelago, together with the archipelagos of the Canary Islands, the
Attribution (CC BY) license (https://     Azores and Madeira, constitutes the region of Macaronesia, known for its biogeographical
creativecommons.org/licenses/by/          specificities, including the floristic and faunistic richness [2]. The state of the art focused
4.0/).

Geosciences 2021, 11, 263. https://doi.org/10.3390/geosciences11060263                                https://www.mdpi.com/journal/geosciences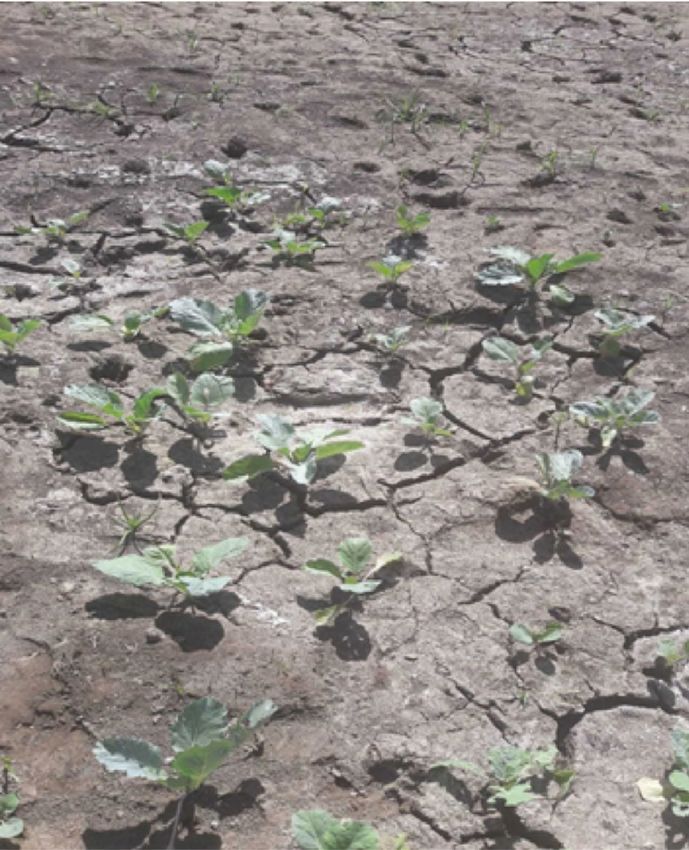
1, x FOR PEER REVIEW 2 of 22
Geosciences focused
2021, 11, 263 on
this territorial context also suggests similar problems related to water re- 2 of 22
sources management. For example, the authors of [3–6] presented literature reviews and
discussed problems associated with water quality, with reference to the main threats to
on this
supply in the Canary territorial
Islands. context
There are also suggests
also severalsimilar
works problems related
focusing ontohydrogeochemi-
water resources man-
agement. Forof
cal controls and salinization example,
water the authors of
in several [3–6] presented
islands from theliterature
Azoresreviews and discussed
Archipelago [7–
problems associated with water quality, with reference to the main threats to supply in the
10]. The present study follows these approaches by reviewing the water quality situation
Canary Islands. There are also several works focusing on hydrogeochemical controls and
in Santiago Islandsalinization
(Cape Verde), a developing
of water andfrom
in several islands semi-arid territory
the Azores located
Archipelago on the
[7–10]. Thewest
present
coast of Africa, subject to water
study follows thesescarcity
approaches andbyanthropogenic
reviewing the water activities, especially
quality situation agricul-
in Santiago Island
ture. (Cape Verde), a developing and semi-arid territory located on the west coast of Africa,
subject to water scarcity and anthropogenic activities, especially agriculture.
Cape Verde is a small country with ten islands (Figure 1). The focus of this article is
Cape Verde is a small country with ten islands (Figure 1). The focus of this article is
Santiago Island, which
Santiago isIsland,
the mostwhichpopulated
is the mostisland,
populatedsince about
island, since55% of55%
about theofCape Verde
the Cape Verde
population lives there [11]. lives
population The there
capital
[11].ofThe
thecapital
country
of theiscountry
Praia City.
is Praia City.
Figure 1. Geographic locationlocation
Figure 1. Geographic of Cape Verde
of Cape and
Verde Santiago
and Santiago Island (west
Island (west coast
coast of Africa).
of Africa).
Several technical and/or scientific studies can be cited (e.g., [12,13]). The first hy-
Several technical and/or scientific studies can be cited (e.g., [12,13]). The first hy-
drogeological survey of the archipelago was carried out by [14], having also contributed
drogeological survey of the archipelago
to the discussion was carried
of the problem out supply,
of the water by [14],withhaving also contributed
the objective of advocating
to the discussion immediate
of the problem
solutions.of the waterthe
Additionally, supply, with
project CVI the objective
75/001, financed byoftheadvocating
United Nations
Development
immediate solutions. Programme
Additionally, the(UNDP),
projectis CVI
the source of thefinanced
75/001, greatest hydrogeological
by the United knowledge
Na-
of the island. The reports prepared by [15,16] should also be mentioned.
tions Development Programme (UNDP), is the source of the greatest hydrogeological
As a result of these projects, an extensive list of studies on the hydrogeological behavior
knowledge of theinisland.
volcanicThe reports
terrains prepared
can be by [15,16]
cited, including should also be mentioned.
[17–34].
As a result of these projects,
In a more or lessan extensive
direct way, theselist of studies
works put forwardon in
the hydrogeological
evidence the primordialbe-strate-
havior in volcanicgic need forcan
terrains protecting
be cited,theincluding
water, due to its scarcity and fragility. Indeed, groundwaters
[17–34].
In a more orare onedirect
less of the main
way,sources
these ofworks
water inputregions with surface
forward water deficit
in evidence or in territories
the primordial
without a centralized supply system. However, in many cases, the population consumes
strategic need forgroundwater
protecting inthe water, due to its scarcity and fragility. Indeed, ground-
a disorganized way and without quality control, with consequent risks to
waters are one ofpublic
the main
health.sources of water in regions with surface water deficit or in
territories without a centralized supply system. However, in many cases, the population
consumes groundwater in a disorganized way and without quality control, with conse-
quent risks to public health.
In general, the literature review indicates a reduction in water quality, often linked
to salinization in coastal areas, as a direct result of overexploitation of aquifers (e.g., [35])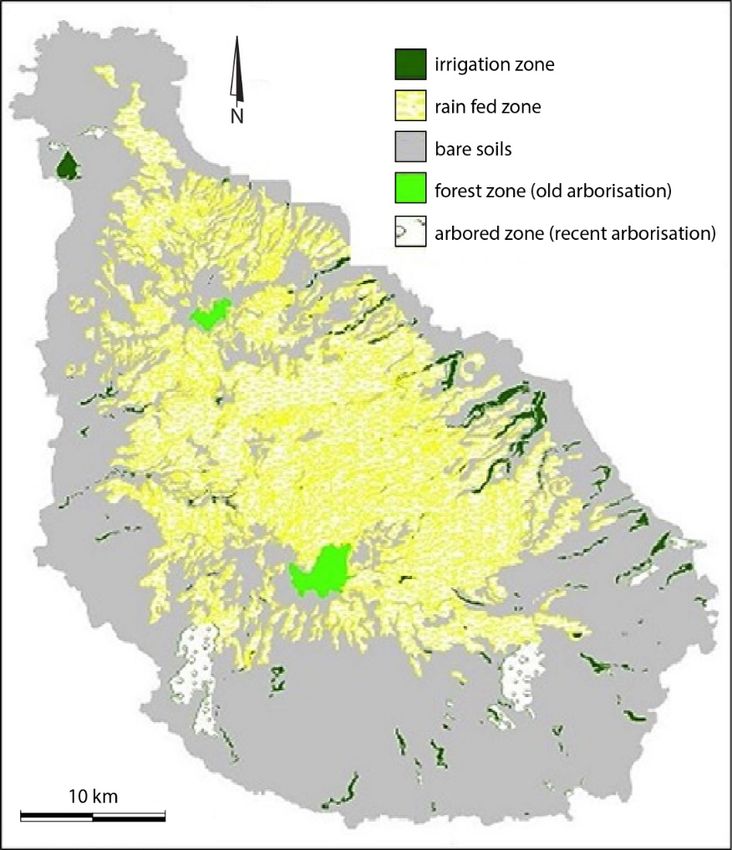
Geosciences 2021, 11, 263 3 of 22
In general, the literature review indicates a reduction in water quality, often linked to
Geosciences 2021, 11, x FOR PEER REVIEW in coastal areas, as a direct result of overexploitation of aquifers (e.g., [35])3and
salinization of 22
sand extraction on beaches that destroy natural barriers against saline intrusion (Figure 2).
Figure2.2. Images
Figure Images illustrating
illustrating the
theexploitation
exploitationof
ofresources
resourceson
onSantiago
SantiagoIsland:
Island:(A,B)
(A,B)extraction
extractionofof
sand on the beaches; (C) exploitation on the river channel; (D) extraction of pebbles on the beach.
sand on the beaches; (C) exploitation on the river channel; (D) extraction of pebbles on the beach.
Santiago Island
Santiago Island has
hasfive
fiveriver
riverbasins
basinsand andnumerous
numerousseasonalseasonalstreams
streamsdependent
dependenton on
the rainy
the rainy season.
season. Close to the the Atlantic
Atlantic Ocean,
Ocean, the the valleys
valleys areare filled
filled with
with Quaternary
Quaternary
sediments of
sediments ofalluvium
alluviumand andthese
theseare arethe
thebest
bestforforagriculture.
agriculture.Nevertheless,
Nevertheless,most mostof ofthese
these
valleysare
valleys areintensively
intensively cultivated
cultivated throughout
throughout the the
year,year,
sincesince irrigation
irrigation waterwater is mostly
is mostly from
from groundwater
groundwater extraction.
extraction. Although Although
there arethere are several
several degradationdegradation activities
activities in thesein these
basins,
such as the
basins, suchmentioned exploitation
as the mentioned of sand and
exploitation of gravel,
sand and agriculture is the mostisimportant
gravel, agriculture the most
economic
importantactivity
economic onactivity
the island.on the Therefore, it has theitstrongest
island. Therefore, impact in
has the strongest someinofsome
impact the
basins. This justifies
of the basins. the approach
This justifies of focusing
the approach the study
of focusing theonstudy
the sub-basins with a greater
on the sub-basins with a
agricultural intensityintensity
greater agricultural (located (located
on the east on side of theside
the east island):
of theS.island):
Miguel,S.Ribeira
Miguel, Seca and
Ribeira
S. Domingos.
Seca and S. Domingos.
The
Thepresent
presentworkworkpursues
pursuesthe themain
mainfollowing
followingobjectives:
objectives:(i) (i)general
generalcharacterization
characterization
of
ofthe
theriver
riverbasins
basinsconsidering
consideringthe thestate
stateofofthetheart;
art;(ii)
(ii)analysis
analysisof ofthe
thehydrochemistry
hydrochemistryand and
evolution
evolution trends
trends inin one
one ofofthe
themost
mostcultivated
cultivatedbasins;
basins;(iii)
(iii)evaluation
evaluationof ofthe
theinfluence
influenceof of
agriculture and other control factors on the water
agriculture and other control factors on the water quality. quality.
This
Thisreview
reviewand andthe
theobtained
obtainedresults
resultsintend
intendto to
contribute
contribute with knowledge
with knowledge thatthat
could be
could
applied in similar territories, for helping decision making on water
be applied in similar territories, for helping decision making on water resources man- resources management
in arid insular
agement in aridcontexts.
insular contexts.
2. General Characterization of Santiago Island
2. General Characterization of Santiago Island
2.1. Geomorphology and Geology
2.1. Geomorphology and Geology
The archipelago of Cape Verde presents, in general, complex morphologies, character-
ized byThe archipelago
high of Cape
altitudes, large Verde
terrain presents,
slopes, in general,
accentuated complex
orography and morphologies,
extensive highlandschar-
acterized by Santiago
(“Achadas”). high altitudes, largepresents
Island thus terrain aslopes, accentuated
great diversity orography
of relief and extensive
forms (Figure 3), from
highlands (“Achadas”). Santiago Island thus presents a great diversity
the steepest peaks and slopes with rocky outcrops, often separated by deep valleys of relief(young
forms
relief forms), to flat surfaces, which mainly develop on the outskirts of the island [36]. by
(Figure 3), from the steepest peaks and slopes with rocky outcrops, often separated It
deep
has anvalleys
average(young
altituderelief forms),
of 278.5 to flat
m, with surfaces, which
a maximum mainly
altitude develop
of 1392 m. Theon the outskirts
island has two
of the island [36].
asymmetrical It has an average
mountainous altitude
areas (Figure 3),of 278.5
the Picom,dawith a maximum
Antónia altitude
(1392 m), to the of 1392
south,
m. The island has two asymmetrical mountainous areas (Figure 3), the Pico da Antónia
(1392 m), to the south, and Malagueta mountain (1063 m), to the north, separated by a
plateau area at an average altitude of 550 m, built from cones and other reliefs in various
states of erosion [37].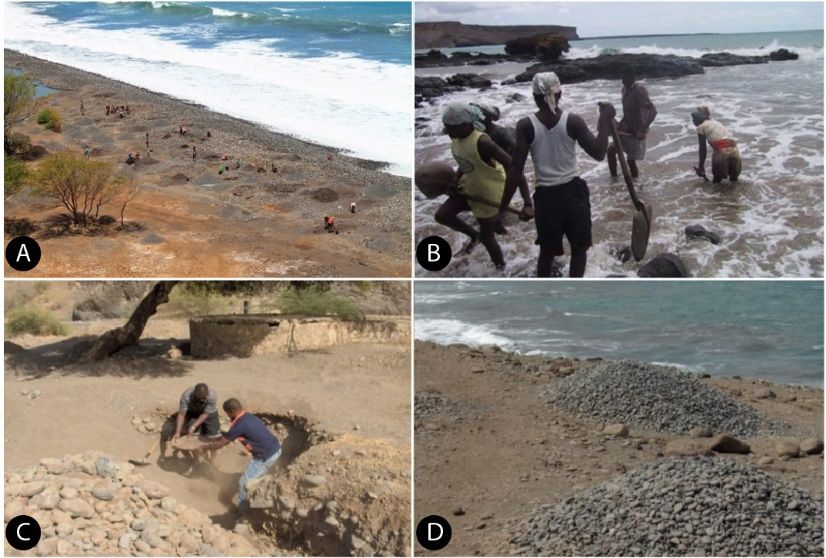
“Achadas” (I); Pico da Antónia Mountain Ridge (II); Santa Catarina Plateau (III); Eastern
                             Flank (IV); Malagueta Mountain Ridge (V); Tarrafal (VI); Western Flank (VII).
                                    The geology of Santiago is mainly composed of volcanic and volcanoclastic materi-
                             als, outcropping predominantly basalts and pyroclastic products (≈91%), limburgites
                             (≈5%) and phonolites (≈2%). Although to a lesser extent, basanites and tephrites, leucitites
Geosciences 2021, 11, 263                                                                                                  4 of 22
                             and nefelinites and associations of sedimentary rocks grouped in two facies (marine and
                             terrestrial) can also be found. The magmatic rocks are distributed by different ages and
                             various geological formations. The oldest formations are mostly located in eroded sectors
                             (e.g.,
                            and      river beds).
                                 Malagueta         Metamorphic
                                              mountain            rocks
                                                           (1063 m),      arenorth,
                                                                     to the   almost  non-existent,
                                                                                    separated        and their
                                                                                               by a plateau     presence
                                                                                                             area          is lim-
                                                                                                                  at an average
                             ited to aofsmall
                            altitude          amount
                                          550 m,         of evidence
                                                  built from          of contact
                                                              cones and          metamorphism
                                                                          other reliefs            phenomena.
                                                                                        in various states of erosion [37].

                             Figure 3. Santiago Island geomorphological units (adapted from [37,38]). GIS 2D terrain digital
                            Figure 3. Santiago Island geomorphological units (adapted from [37,38]). GIS 2D terrain digital map
                             map (after [39]).
                            (after [39]).

                                  The hydrogeological
                                 Faults (NE–SW, WNW–ESE   map and
                                                               of Santiago
                                                                    NW–SE)Island    is schematized
                                                                             are responsible   for thein  Figure of
                                                                                                       insertion  4 where     the
                                                                                                                       the main
                             main   units  are  reported.  The  three  main  geological   units  with   hydrogeological
                            valleys, namely, the S. Miguel, Ribeira Seca and S. Domingos valleys that have NE–SW              im-
                             portance are the Pico da Antónia Eruptive Complex (PA), Monte das Vacas Formation
                            directions.
                             (MV)  and
                                 The    RecentofSedimentary
                                      authors                  Quaternary
                                                  [37,38] considered  seven Formations   (a) ([40]).
                                                                            geomorphological         Based
                                                                                                 units      on data
                                                                                                        (Figure         from the
                                                                                                                3): Southern
                             National Institute
                            “Achadas”   (I); Picoof
                                                  daWater  Resources
                                                     Antónia  Mountainof Cape Verde,
                                                                          Ridge        and as
                                                                                (II); Santa    evidenced
                                                                                            Catarina       by [40],
                                                                                                       Plateau  (III);the pillow
                                                                                                                        Eastern
                            Flank (IV); Malagueta Mountain Ridge (V); Tarrafal (VI); Western Flank (VII).
                                  The geology of Santiago is mainly composed of volcanic and volcanoclastic materials,
                            outcropping predominantly basalts and pyroclastic products (≈91%), limburgites (≈5%)
                            and phonolites (≈2%). Although to a lesser extent, basanites and tephrites, leucitites
                            and nefelinites and associations of sedimentary rocks grouped in two facies (marine and
                            terrestrial) can also be found. The magmatic rocks are distributed by different ages and
                            various geological formations. The oldest formations are mostly located in eroded sectors
                            (e.g., river beds). Metamorphic rocks are almost non-existent, and their presence is limited
                            to a small amount of evidence of contact metamorphism phenomena.
                                  The hydrogeological map of Santiago Island is schematized in Figure 4 where the main
                            units are reported. The three main geological units with hydrogeological importance are
                            the Pico da Antónia Eruptive Complex (PA), Monte das Vacas Formation (MV) and Recent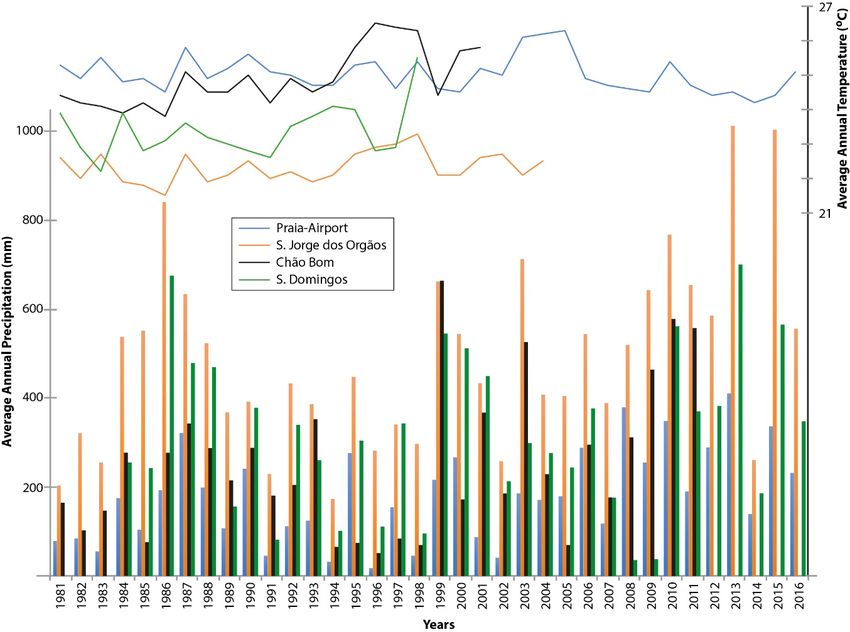
Geosciences 2021, 11, 263 5 of 22
Geosciences 2021, 11, x FOR PEER REVIEW 5 of 22
Sedimentary Quaternary Formations (a) ([40]). Based on data from the National Institute
of Water
lavas of theResources
Pico da of Cape Verde,
Antónia and asComplex
Eruptive evidenced(PA)
by [40], the pillow
represent thelavas
mostofhydrogeological
the Pico da
Antónia Eruptive Complex (PA) represent the most hydrogeological productive level.
productive level.
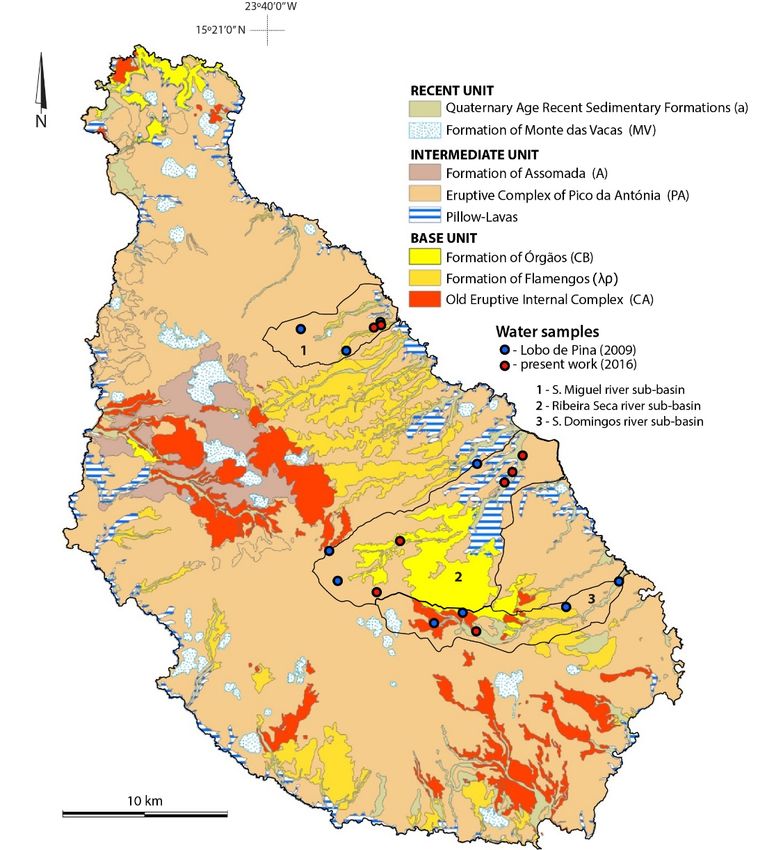
Figure
Figure4. 4.Map
Mapofofhydrogeological units (adapted
hydrogeological units (adaptedfrom
from Cape
Cape Verde
Verde geological
geological map map
to thetoscale
the scale
1:25,000 [29,41,42]. The circles represent the location of the water samples in the river sub-basins:
1:25,000 [29,41,42]. The circles represent the location of the water samples in the river sub-basins:
1—S. Miguel,
1—S. Miguel,2—Ribeira
2—Ribeira Seca and 3—S.
Seca and 3—S.Domingos.
Domingos.
2.2.2.2. Climate
Climate
Cape Verde is located between the subtropical Atlantic North high-pressure area
Cape Verde is located between the subtropical Atlantic North high-pressure area
(Azores anticyclone) and the West Africa Intertropical Convergence Zone (ITCZ). The
(Azores anticyclone) and the West Africa Intertropical Convergence Zone (ITCZ). The
orientation and position of these systems have a great impact on the archipelago [37].
orientation and is
When the later position ofthe
shifted to these systems
south, have adrops
precipitation greatdramatically
impact onasthethearchipelago
archipelago [37].
When
staysthe later is
exposed toshifted to thedry
the northeast south,
winds precipitation drops
from the Sahara dramatically as the archipelago
Desert.
stays exposed to the northeast dry winds from the
The study area is characterized by a tropical climate withSahara Desert.
two distinct seasons: dry
The (December
season study areatoisJune), characterized
where the by a tropical
influence of theclimate
easternwith
sectortwo distinct
of the Azoresseasons:
anticy- dry
clone (December
season is felt, often interrupted by episodes
to June), where of precipitation
the influence of theofeastern
low intensity
sectordueof to
theinvasions
Azores anti-
of polar
cyclone is air;
felt,wet season
often (August toby
interrupted October),
episodes where more than 90%of
of precipitation of low
annual precipitation
intensity due to in-
vasions of polar air; wet season (August to October), where more than 90% of annual
precipitation occurs. The months of June and November are considered the transition
months [37]. The meteorological characteristics, in addition to the geographical condi-
tions, are also strongly conditioned by local factors, such as altitude, relief and distance to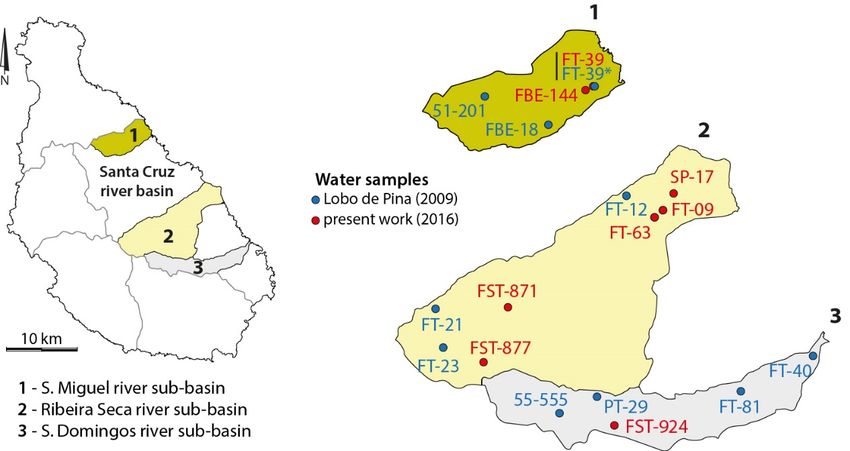
Geosciences 2021, 11, 263 6 of 22
021, 11, x FOR PEER REVIEW 6 of 22
occurs. The months of June and November are considered the transition months [37]. The
meteorological characteristics, in addition to the geographical conditions, are also strongly
conditioned by local factors, such as altitude, relief and distance to the sea, and the insular
structure.
typical climate feature, andThe altitude
there mayisbeoneyears
of theorgeomorphological
successive yearscharacteristics
of extreme dry thatsea-
most influences
sons. the temperature and precipitation regime. Irregular rainfall is a typical climate feature, and
Table 1 shows there
themay be yearsand
maximum or successive
minimumyears of extreme
values dry seasons.
of precipitation and temperature
Table 1 shows the maximum and minimum values of precipitation and temperature
for a series of at least 25 years, registered in the different meteorological stations in San-
for a series of at least 25 years, registered in the different meteorological stations in Santiago
tiago Island. Figure 5 graphically represents the distribution of mean annual precipita-
Island. Figure 5 graphically represents the distribution of mean annual precipitation (1990
tion (1990 to 2016) and the distribution of the mean annual temperature in Santiago Is-
to 2016) and the distribution of the mean annual temperature in Santiago Island (1981 to
land (1981 to 2016)2016)for
forfour
four stations. Thesemeteorological
stations. These meteorological stations
stations (Figure
(Figure 4), except
4), except Praia-Aeroporto,
Praia-Aeroporto,cover
coverthethe river
river sub-basins
sub-basins under
under study:
study: S. Miguel,
S. Miguel, RibeiraRibeira
Seca and Seca and S. The only
S. Domingos.
Domingos. The only meteorological
meteorological station station with arecord
with a regular regular record
of the of the temperature
temperature is indicating
is Praia-Airport,
Praia-Airport, indicating a variation between
a variation between 24 and 26.5 C. ◦
24 and 26.5 °C.
Table 1.
Table 1. Meteorological Meteorological
stations stations
of Santiago of Santiago
Island with the Island with theand
precipitation precipitation
temperatureandmaxi-
temperature maxi-
mum (max) and minimum (min) values: precipitation is based on the temporal series 1990 to 2016; 1990 to 2016;
mum (max) and minimum (min) values: precipitation is based on the temporal series
temperature
temperature is based is based
on the series 1981on
tothe series 1981 to 2016.
2016.
Annual Precipitation (mm)
Annual Annual
Precipitation (mm) Temperature Temperature (◦ C)
Annual(°C)
Meteorological Station
Meteorological Station
Maximum Minimum
Maximum Maximum
Minimum Minimum Minimum
Maximum
Praia-Airport 410
Praia-Airport 17.8
410 26.3
17.8 24.2
26.3 24.2
Órgãos
S. Jorge dos1013
S. Jorge dos Órgãos 1013
174 174
23.3 23.3
21.5 21.5
Chão Bom 664 51,3 26.5 23.8
Chão Bom 664 51,3 26.5 23.8
S. Domingos 707 35.8 25.5 22.2
S. Domingos 707 35.8 25.5 22.2
Figure 5.Figure 5. Distributions
Distributions of averageofannual
average annual precipitation
precipitation (1990
(1990 to 2016) andto
of2016) andannual
average of average annual(1981
temperature tem-to 2016) in
Santiagoperature (1981
Island (data to 2016)byinINMG—Instituto
provided Santiago Island Nacional
(data provided by INMG—Instituto
de Meteorologia Nacional
e Geofísica de de Mete-
Cabo Verde).
orologia e Geofísica de Cabo Verde).
The average annual precipitation has not exceeded 300 mm in about 65% of the ter-
ritory, located at less than 400 m altitude, while in the areas located at more than 500 m
altitude (Pico da Antónia and Malagueta), the total annual precipitation can reach more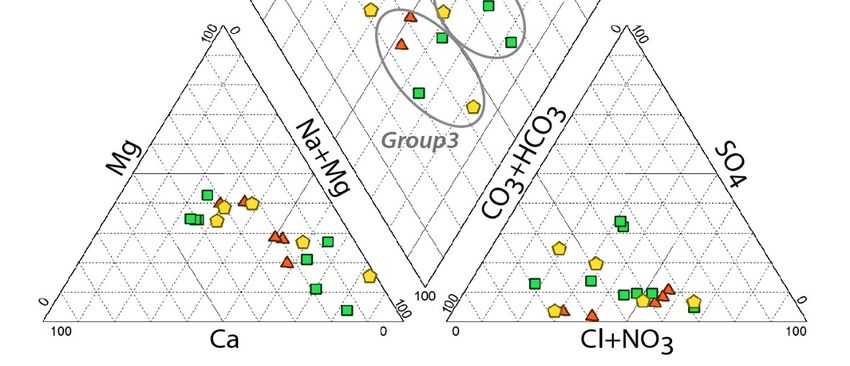
Geosciences 2021, 11, 263 7 of 22
The average annual precipitation has not exceeded 300 mm in about 65% of the
territory, located at less than 400 m altitude, while in the areas located at more than 500 m
altitude (Pico da Antónia and Malagueta), the total annual precipitation can reach more
than 700 mm [43]. Precipitation, though scarce, can occur in a torrential manner,
Geosciences 2021, 11, x FOR PEER REVIEW 7 of 22causing
floods. In addition, a marked irregularity during the year leads to long periods of drought,
with almost no precipitation. The periods of heavy rains are usually accompanied by a
large surface
drought, withrunoff
almostalong the slopes and
no precipitation. rivers (dry
The periods mostrains
of heavy of the
areyear because
usually there are no
accompa-
restraints
nied by a that
largeprevent the flow
surface runoff of water
along intoand
the slopes the rivers
sea). (dry most of the year because
thereInare
Santiago Island,
no restraints thatthe atmospheric
prevent the flowtemperature is also
of water into the sea).determined by a combination
of factors, such asIsland,
In Santiago the exposure of the reliefs
the atmospheric relativeisto
temperature thedetermined
also dominant by winds (N to NE), the
a combina-
altitude and thesuch
tion of factors, distance
as theto the sea.of the reliefs relative to the dominant winds (N to
exposure
NE), the altitude and the distance to the sea.
2.3. Land Use
2.3. Land Use
The authors of [44] presented the situation of agricultural production in the archipelago,
The authors
highlighting of [44] presented
the importance theactivity
of this situation
inof agricultural
Santiago production
Island, in the archi-
which occupies more than
pelago, highlighting the importance of this activity in Santiago Island,
50% of its surface area. More than 90% of the arable surface in Santiago is used which occupies
for rain-fed
more than 50% of its surface area. More than 90% of the arable surface in Santiago is used
agriculture, particularly staple crops (maize and beans), and about 5% is used for irrigated
for rain-fed agriculture, particularly staple crops (maize and beans), and about 5% is used
crops (sugarcane, fruits, vegetables, cassava and sweet potato) [45].
for irrigated crops (sugarcane, fruits, vegetables, cassava and sweet potato) [45].
According to the General Census of Agriculture [46], the land use types in Santiago
According to the General Census of Agriculture [46], the land use types in Santiago
Island
Islandhave
have been classifiedinto
been classified intofive
fiveclasses
classes(Figure
(Figure6),6), each
each oneone corresponding
corresponding to a to a specific
spe-
behavior towards
cific behavior soilsoil
towards erosion.
erosion.
Figure 6. Land use of Santiago Island (adapted [47,48]).
Figure 6. Land use of Santiago Island (adapted [47,48]).
Geosciences 2021, 11, 263                                                                                            8 of 22

                                  The five classes are described as follows [48]:
                            1.     Irrigation zone—low erosion rate;
                            2.     Rain-fed zone—rain-fed agricultural activities (essentially maize and beans);
                            3.     Bare soils;
                            4.     Forest zone (old trees)—low erosion rate except in cases of steep slopes. The vegetal
                                   cover generates organic matter and, also, a root mechanical action, which gives
                                   structure and cohesion to the soil;
                            5.     Arbored zone (recent arborization).

                            3. River Basins
                                  For the author of [49], the river basin can be defined as "the area drained by a given
                            river or by a fluvial system, functioning as an open system", where each of the elements,
                            materials and energies present in the system has its own function, and where these compo-
                            nents are structured and intrinsically related to each other.
                                  The hydrographic network, responsible for the drainage of a basin, has configurations
                            or spatial arrangements that reflect the geological structure and morphogenetic composition
                            of the basin area.
                                  Regarding the conservation of natural resources, the concept has been extended, with
                            a scope beyond hydrological aspects, involving knowledge of the biophysical structure
                            of the river basin, as well as changes in land use patterns and their environmental impli-
                            cations. In this sense, they emphasize the importance of using the concept of a basin as
                            analogous to that of an ecosystem, as a practical unit, both for study and for environmental
                            management [50].
                                  The hydrographic basins, due to the orographic conditions of Santiago Island and
                            the limited rainfall, play a central role in the water supply and in the development of
                            agricultural practices. The island’s population is heavily dependent on agriculture for
                            self-sustainability, and, therefore, as stated by [44], the sector plays a bacillary role in
                            economic development.
                                  The Santiago Island topography is characterized by a great density of deep valleys
                            (Section 2.1), starting from the highest zones towards the ocean, facilitating the transport of
                            the residues by erosion, which consequently causes difficulties in the development of the
                            vegetal cover.
                                  These structures are fed by the Pico da Antónia massif, which is the most important
                            drainage area, with a dense network of valleys to the east. In the same way, numerous
                            valleys cut Malagueta mountain; in its evolution, some of the headwaters of the drainage
                            network approach the scarp morphology (Figure 3). The headwaters of the basins con-
                            tiguous to Malagueta mountain are sectors of great rainfall; therefore, floods are frequent
                            during the rainy season, since the beds of these basins are relatively flat, increasing their
                            altitude very gently upstream.
                                  Santiago Island has five main hydrographic basins with different total precipitation
                            surfaces and volumes (Figure 7, Table 2).

                            Table 2. The main river basins of Santiago Island total area and precipitation volumes (adapted
                            from [29].

                                                              Basin Area
                                  River Basin                                           Precipitation Total Volume (hm3 )
                                                                (km2 )
                                     Tarrafal                     188                                  45
                                   Santa Cruz                     355                                 121
                                 Santa Catarina                   128                                  62
                                 S. João Batista                  155                                  47
                                      Praia                       179                                 33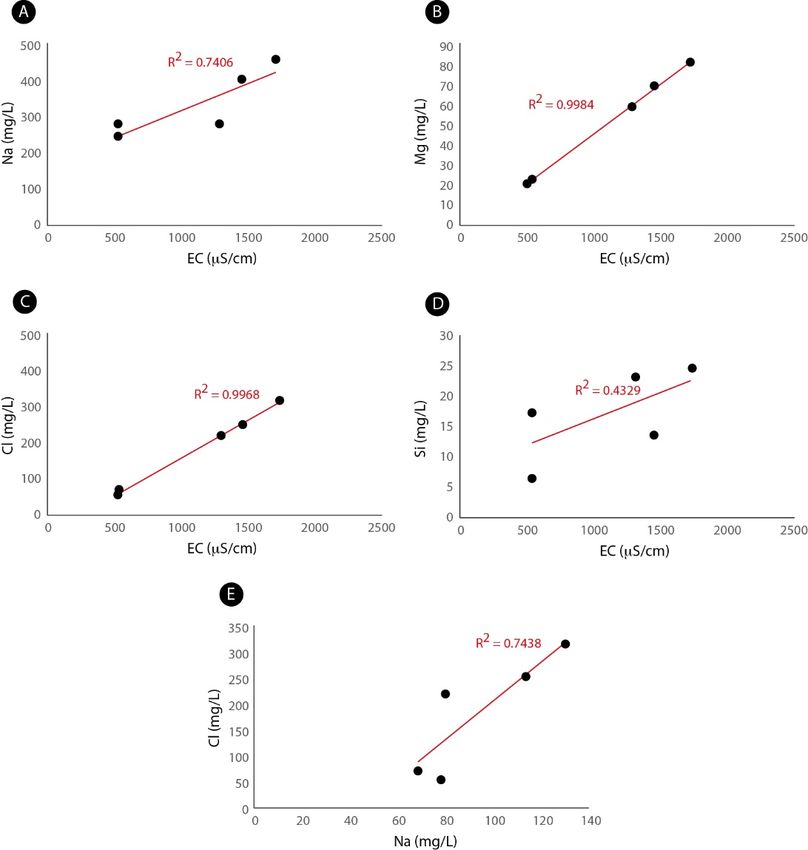
Geosciences 2021, 11, x FOR PEER REVIEW
      Geosciences 2021, 11, 263                                                                                               9 of 22

                                   Figure
                                  Figure      7. River
                                          7. River  basinsbasins
                                                           and the and  the mostsub-basins
                                                                   most important    important      sub-basins
                                                                                                (main              (main of
                                                                                                      agricultural valleys) agricultural
                                                                                                                              Santiago   vall
                                  Island (adapted from [24,29]). • Indicates the location of the meteorological stations with complete
                                   Island (adapted from [24,29]). • Indicates the location of the meteorological station
                                  series in the island.
                                   series in the island.
                                         Among these river basins, Santa Cruz is the one with the largest area (355 km2 ) and
                                  the largest total precipitation volume (121 hm3 ). It is known for its agricultural importance
                                   Table
                                  (e.g.,      2. The
                                         [51–53].       main
                                                   Within  thisriver
                                                                 basin, basins
                                                                        due to itsofgreater
                                                                                      Santiago     Islandpotential,
                                                                                             agricultural   total area   and sub-basins
                                                                                                                    the river precipitation vo
                                  offrom    [29]. Ribeira Seca and S. Domingos were selected for a more detailed analysis
                                      S. Miguel,
                                  (Figure 7; river sub-basins 1, 2 and 3).
                                                                                                  Basin Area
                                                    River Basin
                                  3.1. General Description    of the River Sub-Basins                                         Precipitation Tot
                                                                                                      (km2)
                                         The S. Miguel    sub-basin (14.4 km2 ) is limited, both in
                                                       Tarrafal                                          the north and in the south, by
                                                                                                       188                                    4
                                  slopes in the order
                                                    Santa   20◦ . In the interior, the width of the valley
                                                         of Cruz                                       355 varies between 500 m and          12
                                  1.5 km, narrowing
                                                  Santa to  the sea.
                                                         Catarina                                      128                                    6
                                         In this sub-basin, the Quaternary alluvium sediments are very shallow and thin,
                                                   S. João Batista                                     155                                    4
                                  except for the downstream locations, that is, near the shoreline. Together with the common
                                                        Praia                                          179                                    3
                                  basalt structures (more or less fractured), there are also pillow lava and greenish tuff layers.
                                  Agriculture activities are restricted to the areas near the coastline. It is agriculture of a "high
                                  level ofAmong         these
                                             intuition and  littleriver   basins,
                                                                   technical          Santa
                                                                             apparatus"        Cruz is the one with the largest area
                                                                                            [54].
                                         The sub-basin of Ribeira Seca—located on the east-central3part of Santiago Island
                                   the largest total precipitation volume (121 hm ). It is known for its a
                                  (Figures 2 and 7), 10 km north of the S. Domingos valley, near the village of Santa Cruz—is
                                   portance (e.g., [51–53]. Within this basin, due to its greater agricultural pot
                                   sub-basins of S. Miguel, Ribeira Seca and S. Domingos were selected for a
                                   analysis (Figure 7; river sub-basins 1, 2 and 3).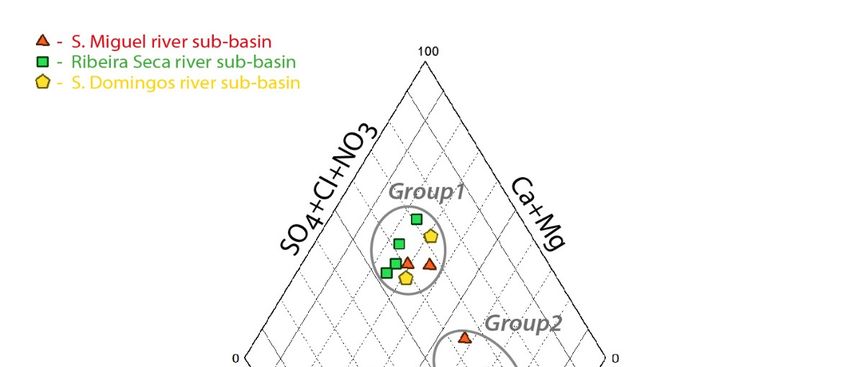
Geosciences 2021, 11, 263                                                                                           10 of 22

                            the largest sub-basin of the island and has the largest agricultural extension. According
                            to [55], it has a drainage area of about 72 km2 and represents four agro-climatic zones: semi-
                            arid (49%), arid (20%), sub-humid (20%) and humid (11%), based on altitude, vegetation
                            and relief. This sub-basin also has the highest rate of soil use, thus requiring more water for
                            irrigation. However, the dominant land use is rain-fed agriculture, particularly the staple
                            crops (maize and beans) and groundnut, occupying 83% of the area. The remaining area is
                            used for: irrigated crops (banana, sugarcane, fruits, vegetables, cassava and sweet potato)
                            at 5% (362 ha), and forest at 4% (251 ha). In addition, 1% of the area is rock outcrops, and
                            7% is built environments. Livestock is an important activity as most families depend on
                            animals, such as cows, goats, pigs and chickens that often graze freely [45].
                                 The soils, developed on a basaltic substrate, are mainly shallow and low in organic
                            matter (OM), generally with low to medium fertility [56,57] and medium to coarse texture,
                            and exhibit marked symptoms of degradation by erosion (i.e., rills and gullies). Deeper soils
                            with a higher OM content can be found on the plateaus of less steep slopes (“Achadas”). In
                            the valley bottoms, alluvial soils are predominant and used for irrigated agriculture.
                                 The S. Domingos stream valley is the southernmost of the surveyed sub-basins. The
                            surface area is 44.3 km2 including part of the Southern “Achadas” plateau, and it has an
                            extension of 16 km. In this sub-basin, the rainfall has a value close to the annual average of
                            Santiago Island, about 360 mm. This region depends on agricultural practices, although
                            green vegetable production is in decline, especially in the sector closest to the shoreline.
                            The work found in [58] indicated a cultivated area of 694 ha (dry: 594 ha; irrigated: 100 ha),
                            values that would not have changed significantly in the last decade [46].

                            3.2. Hydrochemistry and Water Quality
                                 The author of [29] pointed out the compositional variability of the groundwater in
                            Santiago Island that is dependent on the geological characteristics and residence time.
                            Besides geological control, it should be noted that other factors may influence the chemistry
                            of water, particularly anthropic activity that manifests, for example, in overexploitation of
                            water and soil.
                                 The scarcity and lack of a controlled public supply force populations to use water from
                            boreholes and dug wells without monitoring. Often, water points known for their lack of
                            quality are used for irrigation. These aspects justify the approach presented in this section
                            on the hydrochemical characteristics of wells located in the three sub-basins subjected to
                            higher anthropic pressure.

                            3.2.1. Methodological Approach
                                 The hydrochemical evolution and possible changes in water quality over time are
                            reviewed and discussed by comparing data from the bibliography, specifically the works
                            by [29,40], with a recent campaign conducted for the present study. Therefore, this analysis
                            comprehends two periods: summer of 2003 [29] and summer of 2016. For the recent
                            campaign, the pH, electrical conductivity (EC) and temperature (T) were measured in situ
                            with a portable meter, Thermo Scientific Orion. Dissolved major metals were obtained by
                            inductively coupled plasma optical spectroscopy (ICP-OES) after filtration with 0.45 µm
                            syringe filters and acidified until pH < 2 to assure the preservation of the samples. Anions
                            were determined by ionic chromatography with suppressed conductivity, while alkalinity
                            was analyzed by potentiometric titration. Samples were kept refrigerated (
, 11, x FOR PEER REVIEW 11 of 22
Figure 8 illustrates the distribution of the water points analyzed in the three
Geosciences 2021, 11, 263 11 of 22
sub-basins evaluated in the Santa Cruz basin. The blue circles represent points from the
work of [29], while the red circles are for the summer of 2016.
Figure Figure 8. Distribution
8. Distribution of sampling
of sampling points for hydrochemistry
points for hydrochemistry studyRibeira
study in S. Miguel, in S. Miguel,
Seca andRibeira Seca and
S. Domingos river
S. Domingos river sub-basins. *—the FT-39 borehole
sub-basins. *—the FT-39 borehole is coincident in both works. is coincident in both works.
3.2.2. Hydrochemical ClassificationClassification
3.2.2. Hydrochemical
Table 3 presentsTable 3 presentswater
the general the general water properties
properties in the river in the river sub-basins,
sub-basins, obtainedobtained
from from
campaigns held in the summer of 2003 [29] and
campaigns held in the summer of 2003 [29] and in the present work (summer 2016). in the present work (summer 2016).
In general, mineralization is lower in the samples from the S. Miguel sub-basin,
Table 3. Hydrochemistry in the most cultivated sub-basins of Santa Cruz river basin: T in ◦ C; EC in µS/cm; ions in mg/L;
which limit
DL—detection haveof electrical conductivities
the analytical method. Rows in between 525
gray are from and
[29]; the 1711
others μS/cm. Between
were obtained the two
in the summer of pe-
2016
riods,
(present work). an increasing trend can be observed in Ribeira Seca (with values above 975 μS/cm)
and S. Domingos, where the two highest values are recorded (1927 and 2110 μS/cm, re-
S. Miguel
spectively, in the samples FST-924 and PT-29). This behavior follows the general ten-
Samples T pH CE Na K Ca Mg Si Cl HCO3 SO4 NO3 NO2
51-201
dency
24.2
of the
7.2
parameters
527
Ca and8.9Na. The
77.9 27.2
same23.3
is observed
16.9
for sulfate,
56.7 220.0
with
9.1
generally
21.7Geosciences 2021, 11, 263 12 of 22
increasing trend can be observed in Ribeira Seca (with values above 975 µS/cm) and S.
Domingos, where the two highest values are recorded (1927 and 2110 µS/cm, respectively,
in the samples FST-924 and PT-29). This behavior follows the general tendency of the
parameters Ca and Na. The same is observed for sulfate, with generally lower values in S.
Miguel (4.6–82.8 mg/L), and higher values in Ribeira Seca (23.1–231 mg/L).
Nitrates and nitrites, typically associated with diffuse pollution phenomena, are
present in all sub-basins, but with varying patterns. In the sub-basin of S. Domingos, the
sample FST-924 stands out, with high concentrations of these anions. It should be noted
that the values established in the Cape Verdean legislation are 50 mg/L and 0.3 mg/L,
respectively, for nitrate and nitrite. Therefore, this well reveals the existence of a phe-
nomenon of organic contamination. This can be of fecal, agricultural or even industrial
origin, given its location in a heavily agricultural area (bananas, and sugar cane) and in the
vicinity of a cane distillery. Agriculture should also be controlling the water chemistry in
Ribeira Seca (the most cultivated sub-basin), as suggested by the systematic occurrence of
nitrate and nitrite.
In terms of hydrochemical classification, the previous work from [29] indicated
bicarbonate-sodium (HCO3 -Na) waters in the highest areas of the island, where the interme-
diate aquifer formations appear (Figure 4). The same author indicated magnesian-chloride
(Mg-Cl) or sodium-chloride (Na-Cl) classifications in the areas closest to the coast.
The results achieved in the present work with the most recent data (2016 summer
campaign) in these three sub-basins indicate a general trend that is close to that detected in
other works, namely, [40] for the whole Island, [59] for the Santa Cruz basin and [34] for
the S. Domingos sub-basin.
Thus, Piper’s diagram (Figure 9) suggests that waters of a mixed nature predominate
Geosciences 2021, 11, x FOR PEER REVIEW
(Group 1—Na+Ca+Mg-HCO3 +Cl, and Na+Ca+Mg-Cl; Group 2—Na-Cl waters; Group
3—all samples are Na-HCO3 ; the sample located out of groups is of Na+Ca+Mg-HCO3
facies).
9.Hydrochemistry
Figure 9.
Figure Hydrochemistry classification (Piper diagram)
classification (Piper of the S. Miguel,
diagram) Ribeira
of the Seca and Ribeira
S. Miguel, S. Domin-Seca and
gos riverriver
mingos sub-basins for summer
sub-basins of 2016. of 2016.
for summer
The hydrochemical processes that control the chemistry in these sub-basins
inferred from the relationships represented in Figures 10–12. These relationships p
the contribution of major ions to the mineralization (expressed through the EC). FGeosciences 2021, 11, 263 13 of 22
The author of [59] also showed this dispersion of facies in the valleys of S. Domingos,
Ribeira Seca and S. Miguel, with a predominance of mixed classifications. According to
this author, in S. Miguel, the waters are bicarbonate-sodium or sulfate or calcium-chloride
or magnesium. Similarly, in S. Domingos, the same author indicated bicarbonate-sodium
or sulfated or sodium-chloride waters. In the case of Ribeira Seca, the facies identified are
sulfated-sodium or, also, calcium-chloride or magnesium.
In the present study, Piper’s diagram (Figure 9) confirms this dispersion of clas-
sifications, not indicating a clear trend of differentiation between the three sub-basins.
Sodium-chloride waters occur in all three cases, corresponding to the water points closest
to the coast. In turn, the most bicarbonate sample was identified in the S. Domingos river
sub-basin, at the furthest point from the coast (55-555, Figure 8), suggesting a geological
control to the detriment of the marine one.
The hydrochemical processes that control the chemistry in these sub-basins can be
inferred from the relationships represented in Figures 10–12. These relationships propose
the contribution of major ions to the mineralization (expressed through the EC). For this
es 2021, 11, x FOR PEER REVIEW representation, the Na, Mg, Si, Cl, HCO3 and SO4 ions were selected in order to14 evaluate
of 22 the
type of signature: predominantly marine, geological (water–rock interaction) or anthropic.
Figure 10.
Figure 10. Relations Relations
between between
electrical electrical(EC)
conductivity conductivity
and major (EC) and
ions in themajor ionsriver
S. Miguel in the S. Miguel
sub-basin. (A)river
EC–Na;
sub-basin. (A) EC–Na; (B) EC–Mg;
(B) EC–Mg; (C) EC–Cl; (D) EC–Si; (E) Na–Cl.
(C) EC–Cl; (D) EC–Si; (E) Na–Cl.
In the Ribeira Seca river sub-basin (Figure 11), the correlations do not highlight spe-
cific mechanisms of hydrochemical control. The highest correlation is observed between
Na and Cl (R2 = 0.382) (Figure 11E), possibly indicating some marine contribution. The
low correlations between EC and Si and Si and HCO3 (Figure 11C,D) could suggest aGeosciences 2021, 11, 263 14 of 22
In the S. Miguel river sub-basin (Figure 10), there are high correlations between EC and
Na (R2 = 0.7406), EC and Mg (R2 = 0.9984) and EC and Cl (R2 = 0.9968). In turn, the EC–Si
correlation is lower (R2 = 0.4329). This pattern could be indicating a marine contribution
that could be associated with saline intrusion, or deposition and leaching of marine aerosols.
This signature is also recognized by the high Na–Cl correlation (R2 = 0.7438). Similar trends
were observed by [40], for samples from the main valleys of Santiago Island and, also,
by [7], in a study carried out in islands of the Azores Archipelago.
In the Ribeira Seca river sub-basin (Figure 11), the correlations do not highlight specific
mechanisms of hydrochemical control. The highest correlation is observed between Na
and Cl (R2 = 0.382) (Figure 11E), possibly indicating some marine contribution. The low
correlations between EC and Si and Si and HCO3 (Figure 11C,D) could suggest a reduced
influence of water–rock interaction processes. It should be noted that the EC measured here
021, 11, x FOR PEER REVIEW is higher than in the other two sub-basins. Additionally, the intense agricultural
15 of activity
22 in
this area may be responsible for this apparent anomaly.
Figure 11.Figure 11. between
Relations Relations between
electrical electrical conductivity
conductivity (EC) and major(EC)
ions and major
in the ions
Ribeira inriver
Seca the Ribeira Seca
sub-basin. (A)river
EC–Na;
sub-basin.
(B) EC–Cl; (C) EC–Si;(A)
(D)EC–Na;
Si–HC03 ;(B)
(E)EC–Cl;
Na–Cl. (C) EC–Si; (D) Si–HC03; (E) Na–Cl.
In the S. Domingos river sub-basin (Figure 12), the marine signature is not evident,
although there is a high EC–Na correlation (R2 = 0.7625). The low EC–Cl and Na–Cl cor-
relations seem to corroborate higher geological and/or anthropic contributions. In turn,
the bicarbonate ion appears here with a high correlation (EC–HCO3 of R2 = 0.7487), sug-
gesting the influence of phenomena of water–rock interaction associated with theGeosciences 2021, 11, 263 15 of 22
In the S. Domingos river sub-basin (Figure 12), the marine signature is not evident,
although there is a high EC–Na correlation (R2 = 0.7625). The low EC–Cl and Na–Cl
correlations seem to corroborate higher geological and/or anthropic contributions. In
turn, the bicarbonate ion appears here with a high correlation (EC–HCO3 of R2 = 0.7487),
suggesting the influence of phenomena of water–rock interaction associated with the
weathering of silicate volcanic rocks, with release of alkaline and alkaline earth metals
and production of alkalinity. As [60] and [7] stated, the Mg/Ca relationship may also help
clarify this predominance of geological control over the marine influence. In fact, in this
sub-basin, the ratio varies between 5 and 0.8, with the lowest values being near the coast
021, 11, x FOR PEER REVIEW (FT-81 and FT-40, Figure 8). The cited authors indicated that Mg/Ca ratios of22≥ 1, in the
16 of
context of volcanic rocks, are in agreement with the contribution from the parental rock.
Figure 12. Relations
Figure between electrical
12. Relations betweenconductivity (EC) and major
electrical conductivity ions
(EC) in the
and S. Domingos
major river
ions in the sub-basin. (A)
S. Domingos EC–Na;
river
(B) EC–Cl; (C) EC–HCO
sub-basin. ; (D) EC–SO
(A)3EC–Na; ; (E) Na–Cl.
(B) 4EC–Cl; (C) EC–HCO3; (D) EC–SO4; (E) Na–Cl.
The highest correlation is observed between EC and SO (R2 = 0.7859). Thus, in
4 Thus, in ad-
The highest correlation is observed between EC and SO4 (R2 = 0.7859).
addition to geological control, high sulfate and nitrate concentrations may indicate pol-
dition to geological control, high sulfate and nitrate concentrations may indicate pollu-
lution associated with agricultural and industrial activity, in agreement with the location
tion associated mentioned
with agricultural
above. and industrial activity, in agreement with the location
mentioned above.
3.2.3. Water Quality and Risk of Soil Salinization
The data presented in Table 3 can serve, in an expeditious manner, to evaluate the
evolution of water quality between the summer of 2003 and 2016. Figure 13 shows a set ofGeosciences 2021, 11, 263 16 of 22
3.2.3. Water Quality and Risk of Soil Salinization
The data presented in Table 3 can serve, in an expeditious manner, to evaluate the
OR PEER REVIEW evolution of water quality between the summer of 2003 and 2016. Figure 13 shows17 of 22
a set
of quality parameters, which aim to show the evolution over time and from upstream to
downstream, i.e., in order to detect differences with the proximity to the coastline.
Figure
Figure 13.13. Pattern
Pattern of temporal
of temporal and spatialand spatial
evolution evolution
of anion indicatorsofof anion indicators
water quality in the S.of water
Miguel (A),quality in the S.
Ribeira Seca
Miguel
(B) (A), Ribeira
and S. Domingos Secasub-basins.
(C) river (B) and TheS. Domingos
graphs show (C) river sub-basins.
the evolution from upstreamThe to graphs show
downstream, i.e.,the
fromevolution
the
valleys’ highest quotas
from upstream totodownstream,
the lowest and widest sections
i.e., from of the
the valleys, highest
valleys’ which endquotas
at the eastern
to thecoastline.
lowest and widest sec-
tions of the valleys, whichNitrates
end atand
thenitrites
eastern arecoastline.
analyzed here as potential indicators of agricultural and fecal
contamination. All samples analyzed in 2003 show nitrite values below the detection
limit of the
Nitrates and nitrites aremethod (therefore,
analyzed here they
asdopotential
not appearindicators
in the graphsof of Figure 13). On the
agricultural and
contrary, those analyzed in 2016 have concentrations above the legal limit (0.3 mg/L).
fecal contamination. All samples analyzed in 2003 show nitrite values below the detec-
The same situation applies to nitrate, sulfate and chloride, which generally occur with
tion limit of the method
higher (therefore,
concentrationsthey in thedo notsamples.
2016 appearThis in behavior
the graphs can beofseen
Figure 13). On
in sample the
FT-39,
which isin
contrary, those analyzed the2016
only well
have coincident in the two campaigns,
concentrations above thewithlegalthe limit
exception
(0.3ofmg/L).
nitrate that
The
is smoothly greater in the 2003 campaign. This assessment should be carefully analyzed,
same situation applies to nitrate, sulfate and chloride, which generally occur with higher
taking into account the small number of samples and the fact that, although close, they are
concentrations in the
not 2016 samples.
coincident This(except
water points behavior
FT-39,can
in thebe seen in
S. Miguel sample
river FT-39,
sub-basin). which is
Nevertheless,
the only well coincident in the two campaigns, with the exception of nitrateinthat
the pattern, visible in all three sub-basins, generally seems to indicate a decrease water is
quality between the two periods under consideration.
smoothly greater in the 2003 campaign. This assessment should be carefully analyzed,
The S. Miguel sub-basin reveals some oscillation in the spatial evolution of anthropic
taking into accountindicators,
the small number
specifically of and
nitrate samples and the
sulfate (Figure 13A).fact that,chloride
However, although close,
reveals they
a growing
are not coincident trend
water points
along (except
the valley, FT-39, to
from upstream indownstream.
the S. Miguel river
This could be sub-basin). Never-
confirming the marine
influence pointed out by other authors (e.g., [40,61]).
theless, the pattern, visible in all three sub-basins, generally seems to indicate a decrease
in water quality between the two periods under consideration.
The S. Miguel sub-basin reveals some oscillation in the spatial evolution of anthropic
indicators, specifically nitrate and sulfate (Figure 13A). However, chloride reveals a
growing trend along the valley, from upstream to downstream. This could be confirmingGeosciences 2021, 11, 263 17 of 22
The Ribeira Seca sub-basin (Figure 13B) is intensely cultivated in all its extensions,
although with great variation in intensity and in the more or less rudimentary type of
practices. This may explain the irregularity detected in the indicators, namely, nitrite and
sulfate, avoiding the observation of a clear pattern of spatial variation.
In the S. Domingos sub-basin (Figure 13C), the spatial behavior seems to be controlled
by the location of sample FST-924, which, as mentioned above, is located in the vicinity
Geosciences 2021, 11, x FOR PEER REVIEW 18 of 22
of an industrial plant and in a heavily farmed area. Thus, nitrite, nitrate and sulfate have
the highest concentrations upstream. On the other hand, chloride increases steadily with
proximity to the coastline, revealing the marine influence.
create unfavorable conditions
The water quality in such for root penetration
agriculture areas is and
a keywater
issue retention
for potentialcapacity. The au-
soil degradation,
namely,
thors of [63]by also
salinization.
pointed out According to [62],
that saline soilssalinization
have imbalancesmay not significantly
in nutrient influence
availability,
the soil texture. However,
thus interfering with fertility. the occurrence of superficial saline crustification processes
affects waterdiagram
The SAR and air(Figure
circulation, with consequences
14) suggests on productivity,
quality problems, since they with
in this case associated create
theunfavorable conditions
risk of salinization and forsodification
root penetration
causedand by water
the useretention
of this capacity.
water forThe authors
irrigation
of [63] also
purposes. The pointed
projectionoutinthat
this saline
diagramsoils
putshave imbalances
all the samples in nutrient
at high risk availability,
of salinization, thus
interfering
although withtofertility.
at low medium risk of sodium absorption, with the exception of one of the
samples The
fromSARthe diagram (Figure sub-basin
S. Domingos 14) suggests qualityinproblems,
(PT-29), agreement in with
this case
the associated
high sodium with
the risk of salinization and sodification caused by the use of this water
concentration obtained in this sample (Table 3). The samples with a lower risk of sodifi- for irrigation pur-
poses. The projection in this diagram puts all the samples at high
cation are located in the S. Miguel sub-basin, in concordance with what has already been risk of salinization,
althoughinatterms
described low toof medium risk of sodium absorption, with the exception of one of the
hydrochemistry.
samples
Saline from the S. (white
deposition Domingos sub-basinof(PT-29),
efflorescence sodium in agreement
chloride) and with the high
retraction crackssodium
are
concentration obtained in this sample (Table 3). The samples
recurrently observed in the irrigated fields of these river sub-basins (Figure 15). with a lower risk of sodifi-
cation
Withare located inirrigation
increasing the S. Miguel sub-basin,
practices, in concordance
salinization tends to with whatand
continue haseven
already been
inten-
described in terms of hydrochemistry.
sify, especially with the persistence of dry conditions.
Figure 14.14.
Figure Soil
Soilsalinization
salinizationand
andsodium
sodium absorption risk (SAR
absorption risk (SARdiagram)—S.
diagram)—S.Miguel,
Miguel,Ribeira
Ribeira Seca
Seca and
and S. Domingos river sub-basins.
S. Domingos river sub-basins.Geosciences 2021, 11, 263 18 of 22
Geosciences 2021, 11, x FOR PEER REVIEWSaline
deposition (white efflorescence of sodium chloride) and retraction cracks
19 are
of 22
recurrently observed in the irrigated fields of these river sub-basins (Figure 15).
Figure15.
Figure 15. Image
Image of
of deposition
deposition of
of salts
salts and
and retraction
retraction cracks
cracks in
in the
theground
ground(Ribeira
(RibeiraSeca
Secariver
river
sub-basin).
sub-basin).
4. Conclusions
With increasing irrigation practices, salinization tends to continue and even intensify,
especially with thestudy
The present persistence of dry conditions.
characterized three river sub-basins that are subject to agriculture
pressure in Santiago Island, which is facing recurrent droughts and increasing aridity.
4.Hydrochemistry
Conclusions and water quality were assessed through data obtained from wells used
The present
for drinking andstudy characterized
irrigation purposesthree
in the river sub-basins
region that areintensity
with a higher subject toofagriculture
agriculture
pressure
practices.in Santiago Island, which is facing recurrent droughts and increasing aridity.
Hydrochemistry
In general, and water quality
mineralization waswere
lower assessed
in the through
samplesdatafromobtained from wells
the S. Miguel used
sub-basin,
for drinking and irrigation purposes in the region with a higher intensity
which was indicated by the electrical conductivity, with lower values than those ob- of agriculture
practices.
served in Ribeira Seca and S. Domingos. This behavior followed the general tendency of
In general, mineralization
the parameters Ca and Na. The was lower
same wasin observed
the samples forfrom the generally
sulfate, S. Miguel with
sub-basin,
lower
which was indicated
concentrations by the electrical
in S. Miguel conductivity,
and higher with in
concentrations lower values
Ribeira than those observed
Seca.
in Ribeira Seca and
Nitrates and S. Domingos.
nitrites, This behavior
typically associated followed the general
with diffuse tendency
pollution, of the
were param-
present in
eters Ca and Na. The same was observed for sulfate, generally with lower
almost all river sub-basins (except the nitrite samples of the S. Miguel river sub-basin), concentrations
in S. with
but Miguel and higher
varying concentrations
patterns. in Ribeira
In S. Domingos, one ofSeca.
the samples (FST-924) stood out, indi-
Nitrates and nitrites, typically
cating the occurrence of organic pollution. associated with diffuse pollution, were present in
almostTheall hydrochemical
river sub-basinsclassification
(except the nitrite samples of
revealed dispersion,the S. not
Miguel river sub-basin),
indicating but
a clear differ-
with varying
entiation patterns.
between In S. Domingos,
the three sub-basins.one of the
Na-Cl samples
waters (FST-924)
occurred in allstood
cases,out, indicating
corresponding
the occurrence of organic pollution.
to the water points closest to the coastline. In turn, a bicarbonate-magnesium sample was
The hydrochemical
identified classification
in the S. Domingos revealed
sub-basin, dispersion,
at the furthestnot indicating
point from the a clear differenti-
coastline, sug-
ation between the three sub-basins. Na-Cl waters occurred
gesting a geological control to the detriment of the marine contribution.in all cases, corresponding to
The evolution of water quality was performed by comparing data from the bibliog-
raphy with results from a recent sampling campaign. This assessment, between 2003 and
2016, aimed to show the evolution over time and from upstream to downstream, i.e., inYou can also read