Identification of variation in nutritional practice in neonatal units in England and association with clinical outcomes using agnostic machine ...
←
→
Page content transcription
If your browser does not render page correctly, please read the page content below
www.nature.com/scientificreports
OPEN Identification of variation
in nutritional practice in neonatal
units in England and association
with clinical outcomes using
agnostic machine learning
Sam F. Greenbury1,2, Kayleigh Ougham3, Jinyi Wu1,2, Cheryl Battersby3, Chris Gale3,
Neena Modi3 & Elsa D. Angelini1,2*
We used agnostic, unsupervised machine learning to cluster a large clinical database of information on
infants admitted to neonatal units in England. Our aim was to obtain insights into nutritional practice,
an area of central importance in newborn care, utilising the UK National Neonatal Research Database
(NNRD). We performed clustering on time-series data of daily nutritional intakes for very preterm
infants born at a gestational age less than 32 weeks (n = 45,679) over a six-year period. This revealed
46 nutritional clusters heterogeneous in size, showing common interpretable clinical practices
alongside rarer approaches. Nutritional clusters with similar admission profiles revealed associations
between nutritional practice, geographical location and outcomes. We show how nutritional
subgroups may be regarded as distinct interventions and tested for associations with measurable
outcomes. We illustrate the potential for identifying relationships between nutritional practice and
outcomes with two examples, discharge weight and bronchopulmonary dysplasia (BPD). We identify
the well-known effect of formula milk on greater discharge weight as well as support for the plausible,
but insufficiently evidenced view that human milk is protective against BPD. Our framework highlights
the potential of agnostic machine learning approaches to deliver clinical practice insights and generate
hypotheses using routine data.
Neonatal care is a common, high-cost clinical service. In the UK and other high-income countries, around one in
seven newborn infants will be admitted to a neonatal u nit1,2. Within the National Health Service (NHS) in Eng-
land it is among the top three high-cost nationally commissioned services. Neonatal care encompasses a broad
range of conditions and clinical processes ranging from full intensive care for the most preterm and critically
unwell infants to minimal additional support. Length of stay for very preterm infants (gestational age < 32 weeks)
is high, and commonly over 100 days in infants born at < 28 weeks g estation3. Clinical care for very preterm
infants comprises multiple treatment components that vary on a daily or more frequent basis. Preterm birth is
responsible for around 40% of under-five deaths globally and can have life-long impact4,5. Describing the com-
plex, time varying, neonatal care practices is an essential first step in understanding and potentially influencing
short- and long-term outcomes.
Nutritional practice for preterm infants6 is challenging due to immature organ systems and multiple co-
morbidities, and varies greatly7 despite clinical guidelines, in large part because of an inadequate evidence-base8.
Many factors affect nutritional care9, and decisions involve clinicians, parents, nurses and other healthcare pro-
fessionals. Maternal milk is recommended as the optimal source of nutrition for very preterm infants8. There
is strong effort to ensure mothers delivering preterm are supported to express breast milk. In England 95% of
very preterm infants receive some maternal milk in the first 14 postnatal days10 and around 60% are receiving
maternal milk at discharge11. Nutritional practice is believed to influence important neonatal outcomes, though
strong evidence of causal relationships is lacking. Observational studies have examined the association between
1
NIHR Imperial Biomedical Research Centre, ITMAT Data Science Group, Imperial College London, London,
UK. 2Department of Metabolism, Digestion and Reproduction, Imperial College London, London, UK. 3Section of
Neonatal Medicine, School of Public Health, Imperial College London, Chelsea and Westminster Hospital Campus,
London, UK. *email: e.angelini@imperial.ac.uk
Scientific Reports | (2021) 11:7178 | https://doi.org/10.1038/s41598-021-85878-z 1
Vol.:(0123456789)www.nature.com/scientificreports/
nutritional practices and necrotising enterocolitis (NEC), an acquired inflammatory gastrointestinal d isease10 and
bronchopulmonary dysplasia (BPD), a chronic respiratory c ondition12, both major causes of preterm mortality
and morbidity. To our best knowledge, machine learning has not previously been used to investigate neonatal
nutritional practices.
The availability of large scale real-world data and the advent of machine learning techniques provide the
opportunity to augment traditional approaches for generating evidence and improving clinical p ractice13,14.
Recent studies indicate that the application of such approaches to clinical data at scale can help identify complex
patient characteristics most relevant for making a correct diagnosis15, recommending a treatment regimen15 or
deriving a prognostic m odel16. The use of machine learning to generate models mixing clinical variables and
treatment regimens offers the dual advantage of understanding diversity within common clinical profiles or
treatment practices, and enabling patient stratification to tailor further models such as risk s coring17–19, outcome
prediction20 or decision s upport21,22. Machine learning models are efficient at clustering23 based on the notion
of “patient similarity”24. In particular, probabilistic models are able to discover clusters and learn interpretable
parameters of an underlying generative model that explains the stratification. Traditional unsupervised models,
agnostic of any target end-point measure, have seldom been exploited for data-mining of electronic health
records (EHR)25–27. Unsupervised deep learning20,28,29 is rapidly developing to explore EHR, with methods such as
autoencoders being utilised to learn “deep patient” representations. While these can facilitate improved accuracy
in downstream supervised learning tasks (e.g. predicting mortality), such approaches can suffer from difficulty
in interpretability, vital for clinical value, due to the “black-box” nature of the learned representations30. In this
work, we focus on the application of a probabilistic unsupervised generative model, namely the Dirichlet Process
Gaussian Mixture Model (DPGMM)31,32, to simultaneously learn, within a large neonatal database of routine
clinical data, the number and composition of nutritional clusters, allowing the learned structure of the model
to be readily interpretable.
Using the DPGMM approach on data held in the UK National Neonatal Research Database (NNRD), we
encoded complex clinical records from very preterm infants to derive clusters that identify clinically compre-
hensible patterns of nutritional support (nutritional patterns) and associated outcomes. We evaluated our results
with respect to reproducibility, clinical plausibility, and utility.
Finally, to demonstrate the value of such an approach to inform future randomised evaluations or to inves-
tigate causal inference for associations not amenable to interventional studies, we used a recently introduced
deconfounding causal inference method to identify associations between patterns of nutritional support and
outcomes33,34.
Results
Results are reported over the population of very and extremely preterm infants (gestational age < 32 weeks at
birth) born in England between 01/01/2012 and 01/07/2018, comprising 45,679 infants (54% boys; 46% girls)
and 2,535,062 days of care, with a median length of stay (LoS) of 49 days. The following daily nutritional vari-
ables/components were studied, enteral: Maternal Milk (MM), pasteurised Human Donor Milk (HDM), Breast
Milk Fortifier (BMF) and Formula Milk (FM); and parenteral: Parenteral Nutrition (PN) and Glucose Electrolyte
solution (GE).
Descriptive statistics on the cohort of very preterm infants. The median (lower quartile, upper
quartile) gestational age (GA) and birth-weight z-score (BW z-score) were 29 (27, 30) weeks and − 0.16 (− 0.78,
0.36) standardised units respectively. Of the cohort, 8% (n = 3,630) received advanced resuscitation (chest com-
pressions or resuscitation drugs) at birth and 90% (n = 40,798) any antenatal steroids.
The median discharge postmenstrual age of the cohort was 36.7 weeks. In terms of outcome characteristics,
median (lower quartile, upper quartile), weight z-score at 36 weeks postmenstrual age (W36 z-score) and change
in weight z-score from birth to 36 weeks postmenstrual age (W36dz) were − 1.55 (− 2.19, − 0.94) and − 1.16
(− 1.63, − 0.73) respectively. Overall mortality was 8% (n = 3,825); 3% (n = 1,484)developed severe NEC and 27%
(n = 12,407) developed BPD (see Methods for the definitions used for NEC and BPD).
The proportion of infants who received each nutritional component on at least a single day shows great vari-
ability between GA groups (Table 1), except for GE where for each gestational age figures are over 90%. Across the
cohort, considering only enteral nutrition, 15.6% (n = 7,109) of infants were solely fed with MM, 3.3% (n = 1,492)
solely with FM, 49.7% (n = 22,684) with a mixture of MM and FM, and 27.4% (12,522) received some HDM. Of
the whole cohort, 4.1% (1,872) received no enteral nutrition during their stay. In the first two days of admission,
31.5% (n = 14,367) received MM, while in the final two days prior to discharge 53.7% (n = 24,509) received MM
on at least one of those days. Only 1.2% (n = 560) of infants did not receive any PN or GE; of these 82 were fed
solely with MM, 57 solely with FM and 421 with a combination. Overall, 45.3% (n = 20,688) of infants received
some BMF during their neonatal stay.
For the lowest gestational age group (GA = 22 weeks), it would be expected that the majority of deaths would
occur before BMF is commonly commenced; 80% of GA = 22 weeks infants that survived received BMF on at
least one day. As clinically expected, the oldest gestational age group (GA = 31 weeks) had the lowest use of HDM,
BMF and PN, and the highest use of FM in comparison with all other GA groups except GA = 22 weeks (Table 1).
The postmenstrual age at which a given nutritional component is administered was shown to vary across GA
groups (Fig. 1). The proportions of all enteral components decrease over time prior to 36 weeks postmenstrual
age, with the exception of FM, which increases.
Stratification of the population by discovered nutritional patterns. The unsupervised clustering
identified 46 nutritional patterns with distinct proportions of days for the administration of the six nutritional
Scientific Reports | (2021) 11:7178 | https://doi.org/10.1038/s41598-021-85878-z 2
Vol:.(1234567890)www.nature.com/scientificreports/
Proportion of infants having received each nutritional component on at least one
day during neonatal unit stay
Gestational age (number of infants) MM (%) HDM (%) BMF (%) FM (%) PN (%) GE (%) Survival (%)
22 (55) 47 20 22 22 76 95 27
23 (1,217) 72 27 39 43 88 95 45
24 (2,277) 84 34 53 59 94 97 65
25 (2,607) 89 35 62 68 96 96 79
26 (3,304) 92 36 63 71 96 96 86
27 (4,239) 93 35 61 76 97 95 92
28 (5,599) 94 32 57 76 96 95 93
29 (6,555) 94 30 48 77 92 93 97
30 (8,503) 93 24 39 79 72 93 98
31 (11,323) 91 18 27 82 51 94 98
Total (45,679) 91 27 45 76 80 94 92
Table 1. Receipt of each nutritional component stratified by gestational age. Proportions of infants who
received each component on at least one day are reported along with survival rates. Components are
abbreviated as MM: Maternal milk, HDM: Human Donor Milk, BMF: Breast Milk Fortifier, FM: Formula
Milk, PN: Parenteral Nutrition, GE: Glucose Electrolyte solution.
Figure 1. Time curves of the proportion of infants receiving a given nutritional component Time is expressed
as postmenstrual age in weeks. Curves are stratified and colour-coded by infant gestational age groups
(GA), computed on the set of infants still in care at a given postmenstrual age. The vertical grey dashed line
indicates 36 weeks postmenstrual age. In (a–f) we show the proportion of infants who are still in care at a given
postmenstrual age receiving each of the six components (MM: Maternal Milk, HDM: Human Donor Milk,
BMF: Breast Milk Fortifier, FM: Formula Milk, PN: Parenteral Nutrition, GE: Glucose Electrolyte solution).
We only considered GA > 22 weeks as, due to small sample size, values for GA = 22 weeks exhibited too much
variation for meaningful interpretation.
Scientific Reports | (2021) 11:7178 | https://doi.org/10.1038/s41598-021-85878-z 3
Vol.:(0123456789)www.nature.com/scientificreports/
Cluster rank
Property type Whole cohort 1 2 3 4 5 6 7 8 9 10
N 11,052 5,471 4,868 3,951 2,935 2,913 2,707 1,382 1,207 758
Cluster size Proportion 45,679 24% 12% 11% 9% 6% 6% 6% 3% 3% 2%
Cumulative proportion 24% 36% 47% 56% 62% 68% 74% 77% 80% 82%
North 30% 32% 27% 29% 36% 29% 27% 40% 14% 17% 26%
Midlands 27% 28% 30% 33% 36% 18% 27% 27% 10% 15% 37%
Geographical location variables
London 20% 19% 18% 17% 11% 22% 24% 16% 45% 36% 27%
South 23% 22% 25% 20% 18% 30% 23% 17% 32% 32% 11%
Birth Year 2015 2015 2015 2015 2015 2015 2014 2015 2015 2015 2015
Gestational Age (weeks) 29 30 29 29 28 29 31 25 30 28 28
BW z-score − 0.23 − 0.09 − 0.22 − 0.31 − 0.41 − 0.36 0.27 − 0.35 − 0.24 − 0.37 − 0.20
Resuscitation 8% 6% 8% 7% 9% 9% 2% 17% 5% 9% 12%
Admission variables Antenatal Steroids 90% 89% 93% 93% 91% 89% 91% 85% 93% 94% 88%
Sex (% girls) 46% 45% 46% 49% 47% 47% 43% 40% 47% 45% 40%
Apgar 1 min 6 7 6 6 6 6 8 4 7 6 6
Apgar 5 min 8 9 8 9 8 8 9 7 9 8 8
Apgar 10 min 9 9 9 9 9 9 10 8 9 9 9
Mortality 8% 1% 1% 1% 2% 1% 0% 76% 0% 0% 27%
Necrotising Enterocolitis (NEC) 3% 2% 0% 0% 3% 2% 0% 11% 0% 0% 34%
Bronchopulmonary Dysplasia
27% 20% 26% 30% 46% 36% 2% 11% 15% 36% 40%
(BPD)
Outcome variables
Maternal Milk at Discharge 54% 34% 99% 90% 27% 8% 93% 32% 89% 98% 30%
Length of Stay (days) 49 42 52 54 70 60 30 9 43 65 60
W36 z− score − 1.59 − 1.33 − 1.66 − 1.68 − 1.74 − 1.53 − 1.29 − 1.59 − 1.69 − 1.64 − 1.78
W36dz − 1.20 − 1.07 − 1.31 − 1.22 − 1.23 − 1.07 − 1.39 − 1.33 − 1.22 − 1.18 − 1.40
Maternal Milk 0.66 0.51 0.96 0.95 0.68 0.30 0.93 0.32 0.92 0.96 0.43
Human Donor Milk 0.06 0.00 0.00 0.00 0.00 0.24 0.00 0.00 0.22 0.06 0.00
Breast Milk Fortifier 0.14 0.00 0.30 0.35 0.22 0.00 0.00 0.00 0.00 0.44 0.00
Nutritional variables
Formula Milk 0.38 0.67 0.00 0.27 0.45 0.69 0.40 0.00 0.44 0.01 0.44
Parenteral Nutrition 0.21 0.17 0.18 0.13 0.20 0.19 0.00 0.74 0.14 0.14 0.59
Glucose Electrolyte 0.17 0.12 0.10 0.10 0.12 0.11 0.17 0.57 0.11 0.08 0.49
Table 2. Statistics on the within-cluster populations of the 10 most common nutritional patterns and the
whole cohort. Clusters are ranked according to population size (1 = largest cluster). All variables are reported as
median values, except for proportions which are means. Proportions are reported as integer values, therefore
0% corresponds to < 0.5% and the sum across the geographical location variables may not be exactly 100%.
Nutritional variables encode the nutritional patterns through the proportion of days a nutritional component
was given over the total time in care (between 0 and 1).
components (Table 2, Fig. 2), distinct temporal sequences of nutritional events (Fig. 2) and distinct character-
istics on their population (nutritional clusters) (Table 2, Supplementary Table S1). The proportion of infants in
each cluster is highly skewed, with 10 clusters covering 82% of the cohort (Table 1), and 24 clusters covering 95%
of the cohort.
The temporal nutritional sequences identified (Fig. 2) confirm the known practices of using PN immediately
after birth, and the trade-off between MM and FM (e.g. cluster 1). However, nutritional patterns in the 3 largest
clusters, covering over 47% of the population, show striking differences (Table 2). While 24% of infants received a
trade-off between FM and MM over their neonatal stay (cluster 1), the other 23% (clusters 2–3) received MM on
more than 95% of days, with BMF and FM introduced typically towards the end of stay in around half of cluster 3.
Cluster 43 (Supplementary Table S1) returned a clinically implausible nutritional pattern of high BMF use
without other enteral nutrition. Subsequent investigation found this cluster contained n = 28 infants hospitalised
in a single neonatal unit, consistent with erroneous data entry.
Comparing the average proportions of nutritional components in each of the 10 most common clusters
against the population average, we observe that MM is greater in six clusters, HDM in three clusters, BMF in
four clusters, FM in six clusters, and PN and GE in the same two clusters. Combining observations from Table 2
and Fig. 2, we summarize the nutritional clusters as follows:
Cluster 1 (n = 24%; N = 11,052; median GA = 30 weeks): Trade-off between MM and FM and minimal BMF
and HDM.
Cluster 2 (n = 12%; N = 5,471; median GA = 29 weeks): Large amounts of MM, with some BMF and minimal
FM and HDM.
Scientific Reports | (2021) 11:7178 | https://doi.org/10.1038/s41598-021-85878-z 4
Vol:.(1234567890)www.nature.com/scientificreports/
(a) (b)
MM = Maternal Milk
HDM = Human Donor Milk
BMF = Breast Milk Fortifier
FM = Formula Milk
PN = Parenteral Nutrition
GE = Glucose Electrolyte
solution
Figure 2. Composition of the 10 most common nutritional patterns ordered by size from largest to smallest.
Nutritional patterns are encoded as the proportion of days over total time in care a nutritional component was
given (0 to 1). (a) Histograms of proportion of infants receiving a nutritional component (one per column) over
a given proportion of days. Shading = one-dimensional histograms (11 bins-width = 0.1-including 0). Colour
intensity = density of infants fed with that proportion over time in care and is maximal if all infants fall into
a single bin. Cross (“x”) = mean proportion of days averaged across all infants in the cluster. (b) Timeline of
nutritional components administration over normalised LoS (20 equal bins), computed as average temporal
sequences of nutritional events over time in care. Maximal bin value (and colour intensity) attained if all infants
in the cluster received a particular nutritional component every day in that time bin.
Scientific Reports | (2021) 11:7178 | https://doi.org/10.1038/s41598-021-85878-z 5
Vol.:(0123456789)www.nature.com/scientificreports/
Cluster 3 (n = 11%; N = 4,868; median GA = 29 weeks): Similar to cluster 2, except for some use of FM, typi-
cally towards the end of time in care.
Cluster 4 (n = 9%; N = 3,951; median GA = 28 weeks): Large amounts of PN, with FM typically introduced
early during time in care, and minimal use of HDM.
Cluster 5 (n = 6%; N = 2,935; median GA = 29 weeks): Early feeding with HDM, low use of MM, and minimal
BMF.
Cluster 6 (n = 6%; N = 2,913; median GA = 31 weeks): Minimal PN, some GE, and FM more prevalent than
MM.
Cluster 7 (n = 6%; N = 2,707; median GA = 25 weeks): Prolonged PN and GE, combined with a low propor-
tion of MM.
Cluster 8 (n = 3%; N = 1,382; median GA = 30 weeks): Similar to cluster 5, with HDM typically introduced
early during time in care but with a higher proportion of MM.
Cluster 9 (n = 3%; N = 1,207; median GA = 28 weeks): Similar to clusters 2 and 3, with a large proportion of
days involving MM and BMF, but additionally with HDM introduced early during time in care.
Cluster 10 (n = 2%; N = 758; median GA = 28 weeks): Similar to cluster 7 but FM used in addition to MM.
We return to examine the relationship between nutritional cluster, geographical location and outcomes later.
Reproducibility of the stratification. Reproducibility over multiple runs of the unsupervised DPGMM
clustering algorithm on the whole cohort. Twenty independent runs of our model fit on the whole cohort
(n = 45,679 infants), led to the discovery of 43 to 51 nutritional clusters (Supplementary Table S2). The 46 nu-
tritional clusters evaluated in our results were selected from a run corresponding to an “intermediate” result.
Reproducibility of the discovered clusters was quantified using the F-measure35. Initially designed to compare
a proposed clustering of samples to a ground-truth stratification into classes, the F-measure is computed as a
weighted average over all clusters of two metrics: cluster purity (i.e. proportion of the predominant class label
within a cluster) and cluster completeness (i.e. proportion of the samples from the predominant class label that
are included in the cluster). It takes values between 0 (total disagreement) and 1 (perfect agreement) between the
proposed clustering and the ground-truth class labels. To examine the reproducibility of the stratifications across
the 20 runs, we arranged them in 10 pairs, randomly taking one clustering as the ground-truth class labels, and
we obtained a mean value of Ftotal = 0.82 ± 0.01 (Supplementary Table S2). Coverage of the population from the 10
dominant clusters was very stable (mean 81% ± 1%), and agreement for the clusters covering 80% of infants was
very high ( Ftotal = 0.85 ± 0.02). Qualitative comparison of nutrient proportions (Supplementary Fig. S1) showed
very high reproducibility in the largest clusters, while the smallest (rarer) ones showed some within-cluster
variability mostly within PN components.
Reproducibility over training on sub‑cohorts. We constructed two sub-cohorts by separating the infants born
in odd/even years (infants born in 2018 were excluded due to only half the year being included in the whole
cohort). These two sub-cohorts showed no significant differences for admission, geographical location and out-
come variables, as measured by Fisher’s Exact and Mann–Whitney U statistical tests (Supplementary Table S3).
Alternatively using the odd/even birth year sub-cohorts as training/validation sets for our stratification (clus-
tering) method, we checked that our generative model learned on training data can generate synthetic samples
statistically similar to the held-out validation data and is therefore representative. To do this we performed a
posterior predictive check36 which measures the probability (p value) of a test statistic (e.g. population mean,
variance, likelihood) for the synthetic data compared to the validation data. Average p value over 40 repetitions
for the likelihood test statistic was 0.56 ± 0.01, indicative of good generative capability.
Regarding reproducibility of assigning individual infants to nutritional clusters (i.e. stratification), utilizing
again the F-measure, we found a mean value of F total = 0.78 for repeated model fits on the same data (two runs
on the same sub-cohort), and F total = 0.76 for held-out data (a model fitted on the odd birth years and applied to
stratify the even birth years sub-cohort and vice versa). This demonstrates 1) reproducibility of our model over
multiple runs while reducing the training cohort size by a half and 2) reproducibility of clustering of held-out
data when using two statistically similar sub-cohorts.
Further, pairing clusters obtained from clustering the odd/even birth year sub-cohorts separately (using the
maximal F-measure for each pair), we found 94% of admission and outcome variables to have a non-significant
difference (p value > 0.05 with Bonferroni correction, across 555 tests), which indicates that our proposed strati-
fication into nutritional clusters did not generate significantly different aggregates over independent variables,
when trained on statistically similar sub-cohorts.
Discovering associations between nutritional practices, outcomes and geographical
location
To take further advantage of the cohort stratification into nutritional patterns, we attempted to minimize the
influence of admission characteristics before examining associations with geographical locations and outcomes.
To do this, we performed hierarchical clustering and principal component analysis (PCA) on the admission vari-
ables of the 24 most populated nutritional clusters that cover 95% of the population (Table 2 and Supplementary
Table S1). Admission and outcome variables (Fig. 3a) were defined by transforming cluster means as z-scores to
encode values as above or below whole-clusters “average”.
The hierarchical clustering dendrogram (Fig. 3a) and the PCA projection (Fig. 3b,c) are in high agreement
regarding nutritional clusters deemed “similar” according to their admission variables. Based on visual inspec-
tion, we identified 9 distinct admission groups (of variable sizes) of nutritional clusters.
Scientific Reports | (2021) 11:7178 | https://doi.org/10.1038/s41598-021-85878-z 6
Vol:.(1234567890)www.nature.com/scientificreports/
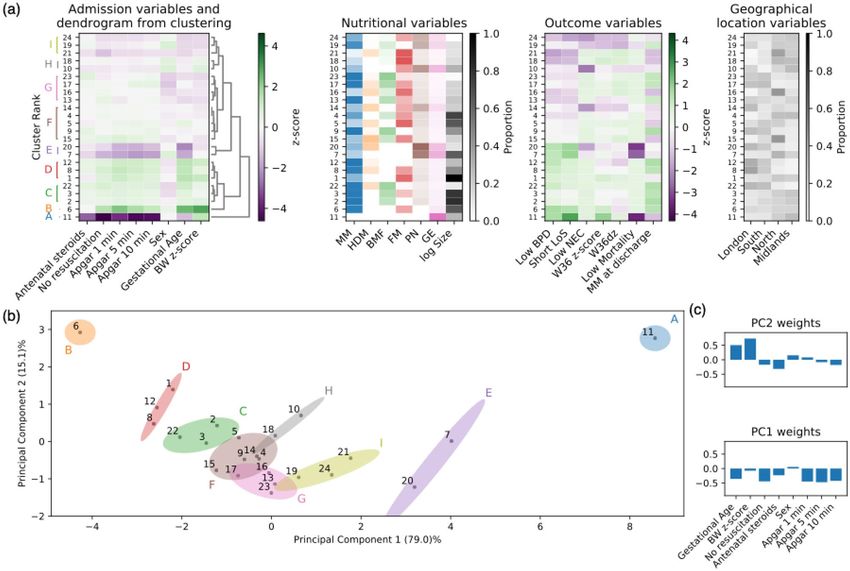
Figure 3. Aggregation of nutritional clusters based on admission variables identifies 9 admission groups to
further assess association with geographical location and outcome variables. Hierarchical clustering and PCA
performed on the 24 most populated nutritional clusters (covering 95% of the whole cohort) using admission
variables (shown in (a)) to characterize infants in each cluster. Nutritional clusters indexed according to size
rank. The 9 admission groups, defined by visual inspection, are encoded with letters A to I on the hierarchical
clustering dendrogram (a) and on the PCA projection plot (b). (a) Admission z-scores values (used for
clustering), along with outcome variables (z-scores), nutritional and geographical location variables (mean
proportions, Table 2). Colour coding for admission and outcome variables uses green for “favourable” and
purple for “unfavourable” values (e.g. a high z-score value is unfavourable for NEC while favourable for MM at
discharge). Feature columns in admission, outcome and geographical location variables are also reordered based
upon hierarchical clustering. (b) Projection of the nutritional clusters (plotted as points with cluster index as in
(a)) along the two main principal components returned by PCA (PC1 and PC2, explaining 94% of the variance).
Admission groups A to I from (a) are reproduced on the PCA plot with ellipses whose axes are based on the
covariances of the group’s coordinates along PC1 and PC2. (c) Contributions of individual admission variables
to the first two principal components (PC1 and PC2). PC1 is driven by gestational age, resuscitation and Apgar
scores, while PC2 is driven by gestational age and birth weight z-score.
We now further discuss some admission groups of specific clinical value. Admission groups A and B are two
outliers on the PCA projection plot (Fig. 3b), composed of two isolated nutritional clusters (respectively cluster 11
and 6), of relatively large size (respectively 2% and 6% of whole-cohort size) and with respectively unfavourable
and favourable admission variables. These clusters are also ones with highest and lowest mortality rates among
all clusters (95% and 0% respectively). Based on these observations, these nutritional clusters appear too different
from the other ones to further investigate cluster-based influence of nutritional patterns.
Regarding potential associations between nutritional patterns and geographical location, we identified two
admission groups of note: 1) Admission group C (clusters 2–3, 22) includes above-average gestational age
infants (GA = 29–30 weeks versus 29 weeks in the whole cohort), with high survival (mortality < 3%) and low
prevalence of NEC (< 1%). Clusters 2–3 are large, reflecting widely used nutritional practices, and differ only in
the use of FM, a well-known source of variation in infant nutrition. The small cluster 22 shows additional use of
HDM and is more frequent in London and South geographical locations (compared to whole cohort average).
This admission group indicates an opportunity to further investigate geographical factors in nutritional practices
related to use of HDM. 2) Admission group D (clusters 1, 8, 12) includes above-average gestational age infants
(GA = 30 weeks versus 29 weeks in the whole cohort), with favourable admission variables, high survival (mor-
tality < 2%) and low prevalence of NEC (< 3%). Cluster 1 is the largest, with minimal geographical location bias,
but with low MM at discharge (34% versus 54% whole cohort). In comparison, clusters (8, 12) have high MM at
Scientific Reports | (2021) 11:7178 | https://doi.org/10.1038/s41598-021-85878-z 7
Vol.:(0123456789)www.nature.com/scientificreports/
discharge (89%, 99%), and are more frequent in London and South geographical locations (compared to whole
cohort average). Furthermore, comparing clusters 12 versus 8, cluster 12 has less use of HDM (8% versus 27%)
and minimal use of FM (1% versus 44%). These observations indicate some opportunity to identify geographical
factors in nutritional practices and associated influence on MM at discharge.
Regarding the previously identified six nutritional clusters with high NEC prevalence, and where increased
use of PN was confirmed by clustering, clusters (7, 20) and (19, 24) fall within similar admission groups (E
and I respectively). NEC is a rare condition, hence challenging to study using conventional approaches such
as randomised controlled trials. These admission groups could be used in future work to eliminate admission
variables as drivers, and identify hypotheses relating to the effect of differences in nutritional practice on likeli-
hood of NEC.
Regarding the previously identified 15 nutritional clusters with high BPD prevalence, they predominantly
aggregate in admission groups F, G, H and I and have several identifiably different nutritional patterns. Among
those, in group F, cluster 9 is more frequent in London relative to clusters 4 and 16. These admission groups could
be used to eliminate admission variables as drivers, and identify hypotheses relating to the effect of differences
in geographical location and/or nutritional practice on likelihood of BPD in future work.
Exploring the association between nutritional regimen and weight gain and BPD
We further considered two scenarios to identify associations between nutritional practice and outcomes using
a recently introduced methodology to reduce the effect of confounders33,34,37,38. We selected infants with similar
admission variables (Fig. 3b), still in care at 36 weeks postmenstrual age, and alive at discharge.
As a first scenario, we verified if we could confirm the well-recognised relationship between the use of FM
and higher weight gain modelled using the weight z-score at 36 weeks postmenstrual age (W36 z-score). We used
nutritional clusters 13 and 16, which are in the same admission group G (Fig. 3b) but have distinct W36 z-score
values (− 1.87 versus − 1.53, and − 1.59 average for the whole cohort). Linear regression returned an adjusted
r2 = 0.46, showing that nearly half of the variation is explained by the model. Our results (Table 3a) identified
“Birth weight z-score” (BW z-score) as a significant covariate (coefficient = 0.72; p value < 0.001), indicating that
an infant born with BW z-score value of 1 unit more will have a W36 z-score value greater by 0.72. It also showed
a significant effect of the nutritional pattern (coefficient = −0.33; p value < 0.001) suggesting that belonging to
cluster 16 relative to cluster 13, independently contributes a difference of 0.33 to the W36 z-score. From the
nutritional patterns of these clusters we can further infer that more FM, along with less MM and less HDM is
associated with higher weight gain, in keeping with well-established clinical k nowledge7.
As a second scenario, we considered the relationship between nutritional patterns and BPD. We used nutri-
tional clusters 17 and 18 with similar admission variables, low NEC prevalence and very different BPD preva-
lence (36% versus 63%, and 27% average for the whole cohort). Logistic regression returned a pseudo r2 = 0.23,
illustrating a reasonable model fit. Our results (Table 3b) indicate a significant effect of nutritional pattern
(coefficient = −1.16; p value < 0.001) suggesting that belonging to cluster 17 is related to decreased BPD. From
inspecting the nutritional pattern of cluster 17, we observe a greater proportion of MM, HDM and BMF, while
cluster 18 has a greater proportion of FM. These results support the hypothesis that human milk may be protective
against BPD12. Geographical location was not identified as significant suggesting that the effect of the nutritional
pattern on both W36 and BPD is independent of the regional bias observed between the compared clusters.
Discussion
In this study, we deployed, for the first time, an agnostic generative unsupervised machine learning approach,
to describe and explore patterns of nutritional practice in very and extremely preterm infants across the entire
population of admissions to neonatal units in England over a six-year period. We used our approach to stratify
the population based upon nutritional components alone, without prior knowledge of clinical practice or vari-
ables relating to admission, discharge or geographical location. Using this agnostic approach, we identified well-
recognised common nutritional practices, as well as less common approaches. We were able to relate nutritional
practices to infant admission profiles. We also identified previously known, as well as novel, associations between
nutrition and outcomes. Our study provides a framework for data-driven approaches to investigate and generate
new hypotheses relating to variation in clinical practice and the impact on clinical outcomes.
Firstly, independent of clustering, we described the delivery of nutritional components to the cohort, and
variation by gestational age. This allowed the nature, timing and extent of each nutritional component to be
considered. We showed clinically plausible patterns, such as early use of PN and greater use of BMF among
low gestational age infants. We also found, as anticipated, that the most mature infants had lower use of HDM,
BMF and PN.
Secondly, the importance of identifying common, reproducible nutritional patterns as clusters is supported
by the high number of theoretically possible combinations (around 13.8 billion combinations if considering 6
distinct binary nutritional components over a median length of stay of 49 days). We encoded nutritional patterns
as the proportion of days each component was given over the entire length of stay and identified 46 clusters of
nutritional practice. Motivation for using DPGMM as the unsupervised clustering method came from the desire
to provide more precise and adaptable clustering than the scalable K-means and to be tractable across the whole
population so as to not require a classifier for predicting cluster membership from fitting to a smaller subset, as
required in other similar s tudies27. An advantage in utilising a Bayesian approach is that a predictive distribution
is freely available, naturally accounting for uncertainty in parameterisations through the approximation of the
full posterior distribution. The relatively large number of discovered nutritional patterns (n = 46) illustrates the
considerable variation in clinical practice. This notwithstanding, 10 large nutritional clusters explain nutritional
practice for 82% of the population. The NNRD is a source of “real-world” data (data derived from real-world as
Scientific Reports | (2021) 11:7178 | https://doi.org/10.1038/s41598-021-85878-z 8
Vol:.(1234567890)www.nature.com/scientificreports/
Coefficient 95% Confidence Interval p value
(a)
Intercept − 1.68 [− 1.74, − 1.62] < 0.001
BW z-score 0.72 [0.64, 0.79] < 0.001
Antenatal Steroids 0.15 [− 0.07, 0.37] 0.185
Apgar 1 min 0.00 [− 0.04, 0.05] 0.861
IMD decile − 0.01 [− 0.04, 0.02] 0.588
Smoking in Pregnancy 0.05 [− 0.09, 0.19] 0.504
Sex − 0.06 [− 0.18, 0.06] 0.301
Gestational Age 0.06 [0.01, 0.11] 0.017
Midlands and east − 0.09 [− 0.27, 0.1] 0.364
North − 0.09 [− 0.27, 0.09] 0.306
South 0.02 [− 0.16, 0.21] 0.796
Nutritional Treatment − 0.33 [− 0.46, − 0.2] < 0.001
Z1 0.03 [− 0.09, 0.15] 0.641
Z2 − 0.04 [− 0.16, 0.07] 0.482
Z3 0.00 [− 0.1, 0.11] 0.940
(b)
Intercept − 0.15 [− 0.36, 0.05] 0.143
BW z-score − 0.64 [− 0.92, − 0.37] < 0.001
Antenatal Steroids 0.27 [− 0.49, 1.03] 0.491
Apgar 1 min − 0.09 [− 0.24, 0.07] 0.263
IMD decile 0.00 [− 0.15, 0.15] 0.977
Smoking in Pregnancy 0.05 [− 0.48, 0.58] 0.862
Sex − 0.58 [− 1, − 0.15] 0.008
Gestational Age − 0.43 [− 0.58, − 0.28] < 0.001
Midlands and east 0.02 [− 0.62, 0.66] 0.941
North 0.38 [− 0.27, 1.02] 0.254
South 0.42 [− 0.19, 1.04] 0.176
Nutritional Treatment − 1.16 [− 1.67, − 0.65] < 0.001
Z1 − 0.26 [− 0.66, 0.15] 0.216
Z2 0.21 [− 0.19, 0.61] 0.309
Z3 − 0.10 [− 0.54, 0.34] 0.648
Table 3. Association between nutritional patterns and 2 clinical outcomes. Regression coefficients, 95%
confidence intervals and p values are reported for all tested covariates, and the three latent variables ( Z1, Z2
and Z3) of the factor model that facilitate deconfounding. We excluded infants with any missing values for the
studied variables and used London as the reference category for geographical location. (a) Linear regression
on weight z-score at 36 weeks postmenstrual age (W36 z-score), comparing clusters 13 (n = 371) and cluster
16 (n = 339). (b) Logistic regression on BPD, comparing cluster 17 (n = 376) to 18 (n = 283). Coefficients in
(a) measure effect on the outcome by a change of one unit in the corresponding covariate. Coefficients in
(b) measure change in log-odds ratio of the outcome by a change of one unit in the corresponding covariate.
“Nutritional Treatment” = binary covariate encoding inclusion in one cluster versus the other. Significant (p
< 0.05) covariates are highlighted in bold/italic if inducing a negative/positive effect on the outcomevariable
when the associated covariate is quantitatively positive.
opposed to experimental settings) that undergoes multiple levels of quality assurance. This notwithstanding, we
identified a cluster of infants from a single neonatal unit in which the use of BMF was documented without any
other enteral nutrition. This is clinically implausible, highly suggestive of a data recording error, highlighting
the additional utility of the unsupervised clustering approach for data quality assurance.
In unsupervised machine learning procedures such as this, there is no “true” number of nutritional clusters.
By using a Dirichlet process we let the data dictate the number of nutritional patterns rather than following the
common practice of constraining the number a priori. Our results regarding reproducibility confirmed that
the exact number of nutritional patterns does not matter, as variability only concerns small nutritional clusters
with few infants. The largest nutritional patterns have high reproducibility in terms of nutritional practices and
within-cluster population characteristics.
Thirdly, the nutritional clusters showed that nutritional practices differ with respect to geographical location.
Understanding the drivers of locational variation is an important area for future exploration. We confirmed
clinical plausibility by identifying known, well-recognised relationships such as a higher proportion of PN days
in infants with high mortality or NEC, lower PN in infants with more favourable admission characteristics and
outcomes, and the effect of FM on greater weight gain. We extended our analysis to identify a potentially positive
Scientific Reports | (2021) 11:7178 | https://doi.org/10.1038/s41598-021-85878-z 9
Vol.:(0123456789)www.nature.com/scientificreports/
impact of MM in reducing the risk of BPD, a matter of great interest clinically. In a recent meta-analysis12 involv-
ing predominantly observational data, Huang et al.suggested that MM might reduce the likelihood of BPD.
However, this is difficult to put to the stringent test of randomisation as it would be unethical to withhold MM
from preterm infants. Our results therefore provide tentative independent support for this hypothesis.
The strengths of our study include the use of a generative model with approximate inference making full use of
a Bayesian formulation to model the posterior distribution of multivariate Gaussians to describe the population.
This is in contrast to alternative approaches such as K-means or hierarchical clustering, which require the design
of a companion classification strategy such as Nearest Centroid27. In addition, the generative model allowed us
to perform posterior predictive checking as a rigorous means for assessing the model’s representation of reality
and its utility. Simple approaches such as K-means also struggle to capture complex heterogeneities in the data
due to the nature of the clustering optimisation which treats feature space as isotropic when identifying patterns
and therefore fails to identify covariances such as the anticorrelation between the use of MM and FM. A further
strength of our study was the use of a complete, whole population dataset containing records on every baby
admitted for NHS neonatal care in England over the defined time period. This eliminates a major limitation of
many observational and randomised studies, namely inclusion bias and lack of generalisability. Allowing a flex-
ible number of patterns to be learned and letting the data determine the number and cluster assignment leads to
the advantageous discovery of rare clusters populated with only few tens to hundreds of infants. These clusters
provide opportunity to identify unusual but potentially informative patterns and outliers. The deconfounding
framework utilised has two advantages for exploring associations: it is readily applicable and uses a testable model
fitting assumption that, if met, eliminates the possibility of unknown multi-cause confounders (unobserved
confounders which affect more than one of the variables considered to be potential causes).
This study has limitations that warrant consideration. These relate to our selection of observed variables, the
use of feeding patterns as representative of “treatment” and the extent to which we can reliably make causal infer-
ences from the identified associations, a significant challenge for all analyses using observational data. Regarding
the selection of observed variables, we did not use the variable hospital of care, although it is a possible baseline
determinant influencing both feeding and care practices. Our decision was based on the fact that infants often
move between neonatal units depending on their care needs (approximately 35% of babies moved in this study),
hence relating an outcome to a specific neonatal unit would be inappropriate. We therefore only used region of
care variables in our analyses.
Regarding the use of feeding patterns as representative of “treatment” we acknowledge that, from an epide-
miologic point of view, these could be considered “mediating variables” that transmit the effect of an antecedent
(e.g. geographical location) to a dependent variable (e.g. the outcome)39. Alternatively the strong likelihood of
multiple interactions between nutritional components could be construed as justification for our approach. This
topic merits further investigation.
We consider our findings associations, and not evidence of causality, but used a principled machine learn-
ing approach to reduce the presence of confounding. This could be strengthened in the future through the use
of more sophisticated predictive models, alternative factor model specification, incorporation of additional
covariates, and parallel use of other methods to elicit causal inferences, such as propensity score matching or
instrumental variable analysis40,41. Considerations around the timing of care practices could also be utilised given
the rich daily temporal records available in the NNRD.
In summary, our study demonstrates the potential of unsupervised machine learning applied to real-world
data to provide interpretable insights into variations in clinical care and their potential impact. Data-driven
discovery allows identification of variation within groups of infants with similar background characteristics.
Patient care could theoretically benefit from structured exploration through for example, combining detection of
non-random associations to identify possible disease determinants, and predictive modelling to uncover patient
pathways and interventions that might alter outcomes, especially in situations not amenable to randomised
evaluation. Future utility of machine learning on healthcare data will be enhanced by ensuring, as done in our
work, that models are reproducible, simple to understand and manipulate, and efficient at generating evidence
at a faster pace and lower cost than conventional approaches.
Materials and methods
Study design. We used the National Neonatal Research Database (NNRD)42, a mature ongoing longitudinal
registry that commenced in 2007 and that contains detailed clinical information extracted from the electronic
patient records of all admissions to neonatal units in England, Wales and Scotland43. Out of nearly one million
infants and 12 million daily records of care, we selected all very and extremely preterm infants, defined as born
below a gestational age of 32 weeks. To consider only the period of time for which there was full coverage across
all neonatal units in England (after 2012), and infants who had completed their time in care, we further restricted
the birth year range from January 2012 to July 2018. To study region-specific trends, we further excluded infants
who received care in more than a single region during their length of stay (Supplementary Fig. S2). For logical
consistency, episodic data and daily summary data needed to be converted into a single entry per infant, involv-
ing linking records from different neonatal units. Missing data was present in both episodic and daily summary
data (Supplementary Fig. S2). For episodic data, to obtain the appropriate value for variables considered con-
stant, we selected the last non-missing value (Last Observation Carried Forward approach) where the episodes
were ordered by anonymised admission time across episodes. For daily summary data, the curation process
reverts all entries to midnight of the day of data entry. We reset the clock of each infant’s trajectory (the multi-
variate time series of variables across the entire length of stay) to zero for the first entry and considered the time
from birth to this entry to calculate the age in days for that infant. We removed all day entries where there were
any missing data in the variables of interest. Entries marked with the same timestamp were merged by taking the
Scientific Reports | (2021) 11:7178 | https://doi.org/10.1038/s41598-021-85878-z 10
Vol:.(1234567890)www.nature.com/scientificreports/
union of events that occurred between the set of entries with matching timestamps. Such instances occur when
an infant is transferred to a different neonatal unit and records may be entered at each unit during that day. With
this procedure complete, we selected a single complete entry per day of nutritional events for n = 45,679 infants.
Weight z-scores were calculated using the LMS method of Cole and G reen44 using sex, gestational age, post-
45,46
natal age and birth weight .
We divided the variables of interest into four categories: (1) admission, (2) nutritional, (3) outcome, (4)
neonatal unit geographical location.
Admission variables: We considered the following variables as the primary representation of infant admis-
sion characteristics:
• Birth year (integer): the integer year in which the infant was born.
• Gestational age (GA; integer): the number of completed weeks of gestation at birth.
• Birth weight z-score (BW z-score; continuous): the birth weight of the infant adjusted for sex and gestational
age to produce a z-score.
• Resuscitation (binary): defined as 1 if cardiac compression and/or resuscitation drugs were used at birth, 0
otherwise.
• Antenatal steroids (binary): defined as 1 if any administration of steroids to the mother prior to birth, 0
otherwise.
• Sex (binary): defined as 0 for boys and 1 for girls (arbitrary dummy coding where the mean of this variable
over infants returns the proportion of females).
• Apgar scores at 1, 5 and 10 min (ordinal): summary health score between 0 and 10 over five categories
recorded for the infant at each indicated time from birth.
Additional admission variables:
• Index of Multiple Deprivation score (IMD decile; integer): the decile measuring the deprivation score for the
mother’s location of residence at the time of the infant’s birth, with 1 being the most deprived and 10 being
the least deprived47.
• Smoking in Pregnancy (binary): defined as 1 if mother confirmed smoking during pregnancy, 0 otherwise.
Nutritional variables: For each infant, nutrition is recorded in the NNRD daily summary tables using six
variables. For the enteral component these are Maternal Milk (MM), pasteurised Human Donor Milk (HDM),
Breast Milk Fortifier (BMF) and Formula milk (FM) and for the parenteral component, Parenteral Nutrition (PN)
and Glucose Electrolyte solution (GE). Each variable is recorded daily as having occurred or not (binary event).
If any of these nutritional events was missing in a single daily record, that record is excluded. We converted the
daily record of these six variables into a single vector per infant by counting the number of days on which each
nutritional variable was given and dividing this by the length of stay. By doing so, each variable is encoded as
a number between 0 and 1 representing the proportion of days an infant received this nutritional component.
Outcome variables: We considered the following seven outcomes, informed by those identified as important
by parents, patients, clinicians and r esearchers48, to define the outcome variables of each infant at discharge from
neonatal care:
• Mortality (binary): defined as 1 if death is entered as the discharge destination for the last non-missing epi-
sode of care ordered by discharge time, 0 otherwise.
• Necrotising enterocolitis (NEC; binary): defined as 1 if severe NEC occurred, 0 otherwise. As milder forms
of necrotising enterocolitis (NEC) are difficult to identify consistently and lack an agreed case-definition,
we restricted ourselves to evaluating severe NEC. In accordance with the definition developed by Battersby
et al.10, severe NEC is defined as NEC that required surgery or was confirmed at death (see Supplementary
Table S4 for how severe NEC is measured in the NNRD). NEC influences nutritional practice as treatment
involves a period (commonly 7–14 days) without enteral nutrition and with PN or GE. Infants with NEC
may also have difficulty in re-establishing enteral nutrition, hence requiring prolonged periods of PN.
• Bronchopulmonary dysplasia (BPD; binary): defined as 1 if BPD occurred, 0 otherwise. BPD is defined as
receiving any respiratory support or supplemental oxygen at a postmenstrual age of 36 weeks. Set to NA for
infants who died prior to 36 weeks postmenstrual age.
• Maternal milk at discharge (binary): defined as 1 if the infant received some MM on either of the last two
days of time in care, 0 otherwise.
• Length of Stay (LoS; integer): the difference (in days) between the maximum time and minimum time from
the daily summary table, representing an infant’s total time in care.
• Weight z-score at 36 weeks postmenstrual age (W36 z-score; continuous): weight at a postmenstrual age of
36 weeks converted to a z-score. Set to NA for infants who died prior to 36 weeks postmenstrual age.
• Change in weight z-score from birth to 36 weeks postmenstrual age (W36dz; continuous): the difference
between W36 z-score and BW z-score. Set to NA for infants who died prior to 36 weeks postmenstrual age.
Geographical location: binary mutually exclusive variables for four regions (North, Midlands, London,
South). The value is set to 1 for the region of the host neonatal care unit and 0 for the three other regions. We
used the following grouping of regions to define geographical locations as entered in the NNRD:
Scientific Reports | (2021) 11:7178 | https://doi.org/10.1038/s41598-021-85878-z 11
Vol.:(0123456789)www.nature.com/scientificreports/
• North: Cheshire, Lancashire, Cumbria, Northumberland, Durham, Tyne & Wear, and Yorkshire.
• Midlands: Leicestershire, Lincolnshire, Essex, Hertfordshire, Bedfordshire, Cambridgeshire, Norfolk, Suffolk,
Worcestershire, Birmingham, Warwickshire, Staffordshire, Shropshire and Nottinghamshire.
• London: South London, West London, North East and Central London.
• South: Kent, Surrey, Sussex, Cornwall, Somerset & Avon, Devon, Buckinghamshire, Berkshire and Dorset.
Model design for unsupervised clustering. We applied unsupervised clustering to the nutritional com-
ponents of the whole cohort aggregated in a N × L nutritional matrix Xnl, where each row corresponds to an
infant and each column corresponds to a nutritional variable. During the clustering process, infants are grouped
on the basis of having received a similar nutritional regimen during their neonatal unit stay. We intentionally
excluded any other characteristics (geographical location, admission or outcome).
We chose the Dirichlet Process Gaussian Mixture Model (DPGMM) to perform c lustering31,32. A GMM is
a generative model that fits a mixture of Gaussian distributions to the observed variables. Each cluster is rep-
resented by a Gaussian distribution parameterised by a vector of mean values and a covariance matrix describ-
ing correlations between variables. The “Bayesian” aspect of the model incorporates a prior on the mean and
covariance of the clusters and learns an approximate posterior over these parameters. The priors for the cluster’s
mean and covariance are centred on the mean and covariance of the entire dataset respectively. Using a “Dir-
ichlet Process” for the fitting procedure (in our case the posterior inference) optimizes the number of clusters
to use through the manipulation of an extra parameter called the weight concentration. This parameter controls
whether large numbers of evenly sized or small numbers of unevenly sized clusters better fit the data. With the
approximate Bayesian posterior inference, the model allows uncertainty in the estimated cluster shapes and
assignments to be taken into account. The output of the DPGMM algorithm returns a generative model, a set
of nutritional patterns, and probabilities for each infant as having each pattern. We defined our final nutritional
clusters by assigning each infant to the pattern with the highest probability.
The DPGMM has several advantages over simpler unsupervised clustering approaches such as K-means.
Firstly, the Dirichlet Process estimates the optimal number of clusters as part of the posterior inference procedure
whereas K-means requires an a priori estimate of the number of clusters to be identified. Secondly, using Gauss-
ian distributions assigns means and covariances between variables that can be straightforwardly interpreted. It
also enables complex covariance patterns between variables such as non-isotropy and anti-correlations, while
K-means is limited to isotropic covariance. Thirdly, as a generative model, it enables generation of synthetic data
and rigorous statistical interrogation of the quality of the model. Lastly, the Bayesian posterior implicitly allows
overlap between clusters and captures uncertainty of a sample’s cluster assignment, making the approach robust
to outliers while K-means favors large inter-cluster distances and is very sensitive to outliers.
The approximate inference involves initialisation with random parameter values, and joint optimization of
the number of clusters and their Gaussian distributions maximizing an objective called the evidence lower bound
(ELBO) that measures the quality of the approximate model fit. We stopped iterations when ELBO improve-
ment fell below a tolerance threshold. We set the tolerance to 0.001 but found our results to be insensitive to
this parameter. A “weight-concentration” parameter for the Dirichlet process controls our prior expectation for
a small or large number of clusters. We set this parameter to 1 0–5 but found our results to be insensitive to this
parameter in the range [10–5, 105]. All analyses were performed using Scikit-Learn49.
Model Evaluation. Reproducibility: Since there are no ground-truth clusters (i.e. the composition of
nutritional patterns and assignments of infants to clusters are not known a priori), we performed three surrogate
validation tests, as commonly done in unsupervised clustering50.
First, we measured reproducibility over repeated DPGMM model fits on the whole cohort using the F-meas-
ure35 to quantify clustering agreement between two runs. Using 20 runs with different random seed initialisations,
we performed 10 comparisons between distinct pairs.
Second, we measured reproducibility over sub-populations by splitting the whole cohort into a training and
validation set50. Here we split the infants into odd (2013, 2015, 2017) and even (2012, 2014, 2016) birth years
(excluding infants born in year 2018 as only half of the year is included in the cohort). Treating one cluster assign-
ment as “true” (model fitted on the training set) and the other one as “predicted” (model fitted on the validation
set), the infants with odd/even birth years are alternatively utilised in the roles of training or validation sets.
We measured clustering agreement with the F-measure, and the ability for the fitted models to predict cluster
assignment using posterior predictive check36, providing a measure of the quality of model fit.
Clinical plausibility: To evaluate the clinical plausibility of the discovered nutritional patterns, we compared
the nutrient proportions of the top 10 largest clusters and assessed whether these were clinically interpretable.
We also compared admission and outcome variables between nutritional clusters using Mann–Whitney U tests
on variables derived from continuous entries and Fisher’s Exact Test on variables derived from binary entries16.
Clinical utility: To assess clinical utility, we grouped nutritional clusters according to the primary admission
variables of the infants. We computed the mean admission variables within each individual nutritional cluster
and then standardised these values as z-scores. The z-score for a given variable for a given cluster was calculated
by subtracting the mean across all clusters and normalising by the standard deviation across all clusters for that
variable. We then performed hierarchical clustering of nutritional clusters51 using Euclidean distance and the
Ward’s method to minimise overall within-cluster variance during agglomeration. We also applied principal
component analysis (PCA) to the cluster z-scores to create a two-dimensional projection for interpreting and
visualising their similarity.
Scientific Reports | (2021) 11:7178 | https://doi.org/10.1038/s41598-021-85878-z 12
Vol:.(1234567890)You can also read