Il Progetto Mistral - Il Supercalcolo a supporto di enti pubblici, ricerca e privati per la creazione di un Portale Nazionale degli Open Data ...
←
→
Page content transcription
If your browser does not render page correctly, please read the page content below

4 Marzo 2020
                              Il Progetto Mistral - Il Supercalcolo a supporto di enti
                              pubblici, ricerca e privati per la creazione di un Portale
                              Nazionale degli Open Data Meteorologici.

Gabriella Scipione (CINECA)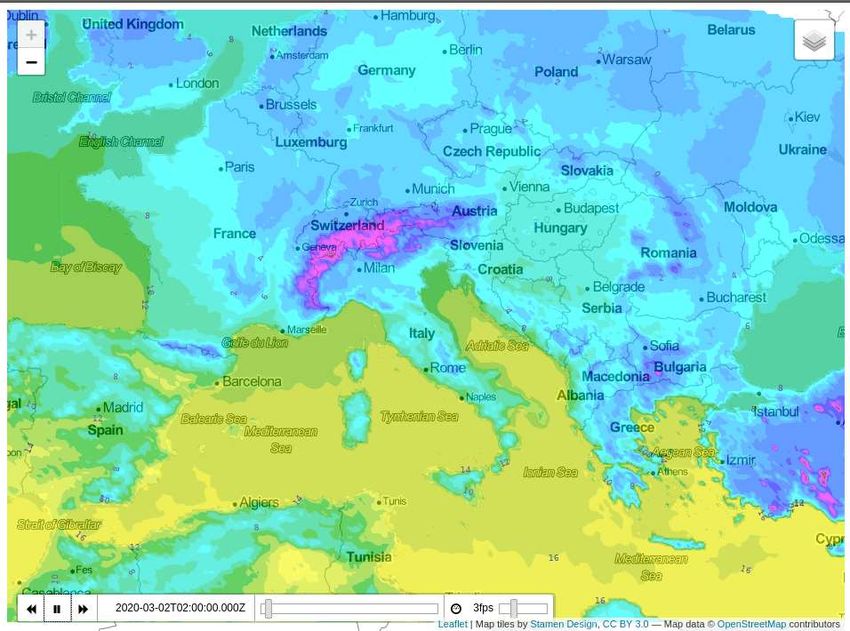
2                                          CINECA
                                                                                                    Gabriella Scipione
     Milano
                                                                                                    Data Management &
              Bologna                                                                               Analytics

        Roma
                                                 High Performance Computing
                                                    Innovation and Research Support
                                            High Performance Computing and Data Analytics
                                            Tier 0 National and European
                                            Scientific Visualization   an   Interactive   Virtual
                                            Environments
                                            Research and Development, education and training

    With the new Supercomputer
    MARCONI, Cineca ranks number 3
    in Europe and 19 in the world in the
    TOP500.org list of the most
    powerful computing facilities.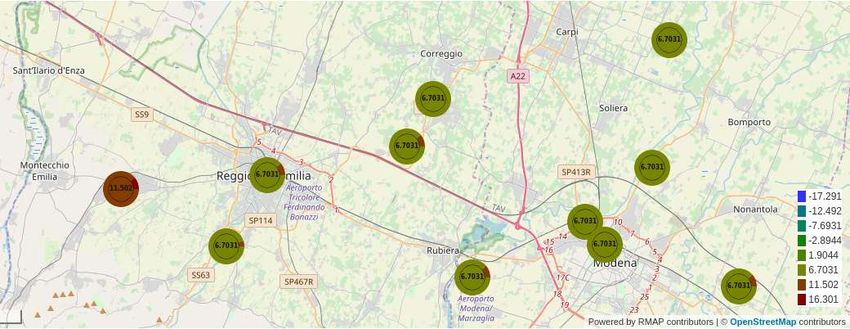
4   HPC can be used to solve scientific, industrial and societal challenges

            Source: EUROHPC
                              Cineca - SuperComputing Applications &
                                           Innovations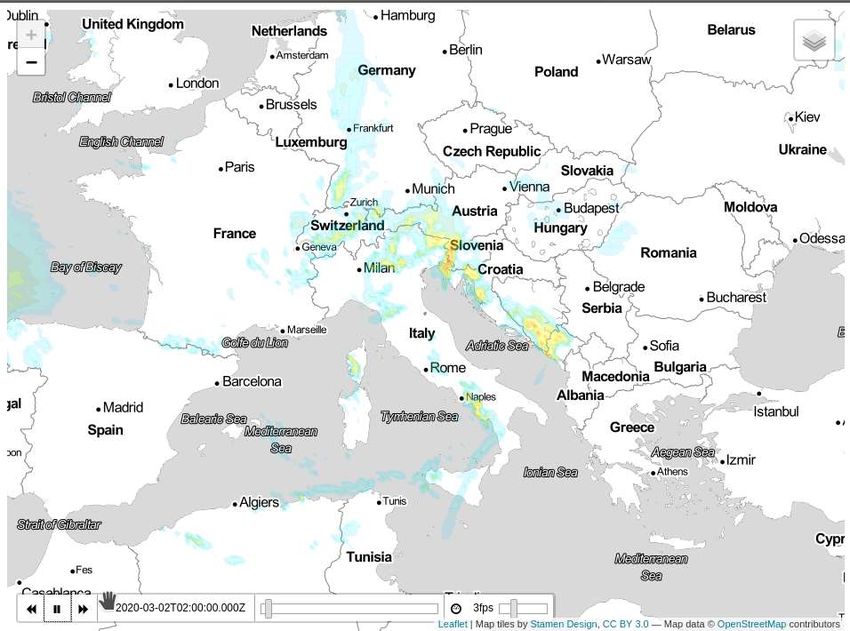
5 Why meteo requires HPC?
Improve forecast models (deterministic)
To run WEATHER FORECAST
Improve of the ensemble systems
To improve the resolution: an increase in
the resolution means an increase of the From 2.2 to less than 1 km
forecast quality
In post processing For more useful and usable forecast .
To have multilayer representation on
For Meteo data visualisation
maps of complex data
Cineca - SuperComputing Applications &
Innovations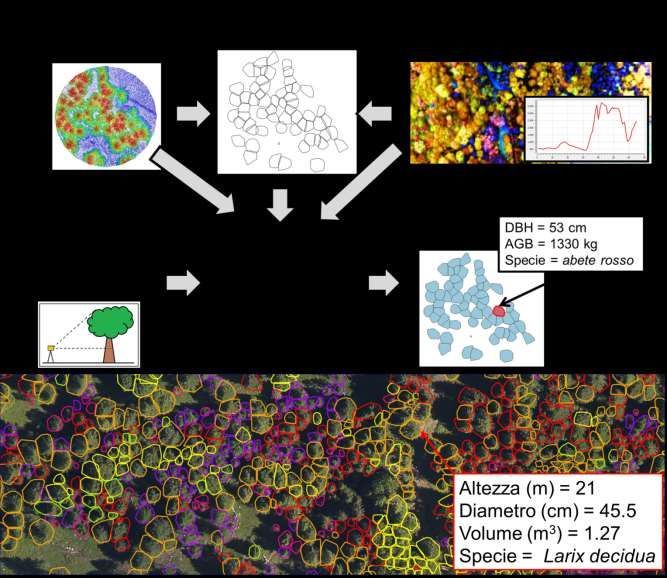
6 Connecting European Facilities - Telecom
METEO CLIMA-AGRICOLTURA
Gabriella Scipione MISTRAL HIGHLANDER
• CINECA, HPC Dep.
Meteo Italian HIGH performance computing
• Data Management & to support smart LAND
SupercompuTing portal
Analytics sERvices
Start: 1st of October 2018
Start: 1st of October 2019
Duration: 24 months
Duration: 36 months
Partners: Cineca, DPC, ARPAE,
ARPAP, ECMWF, Dedagroup Total costs: € 5,430,426.66
Total costs: € 2,342,242.5 Partners: Cineca, ArpaE, ArpaP,
CMCC, U.Della Tuscia, FEM,
Aim:: Weather Open data
ECMWF, CIA Agricoltori italiani,
portal
ART-ER
Cineca - SuperComputing Applications &
Innovations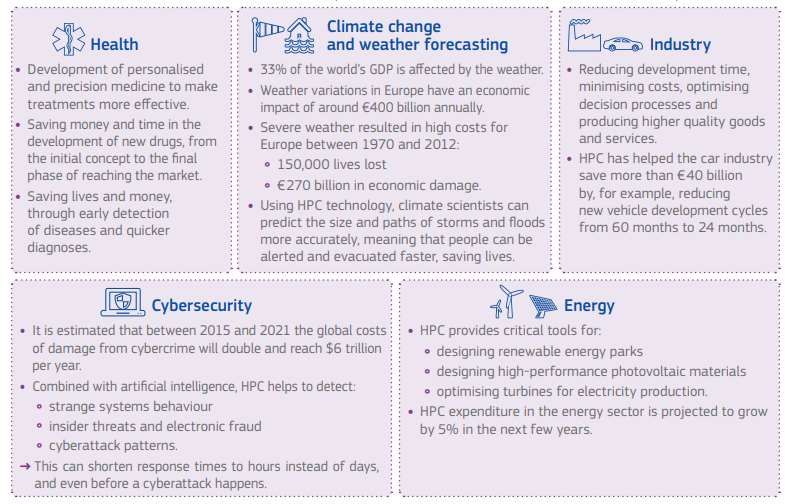
9   Italy: State of the Art

                         Cineca - SuperComputing Applications &
                                      Innovations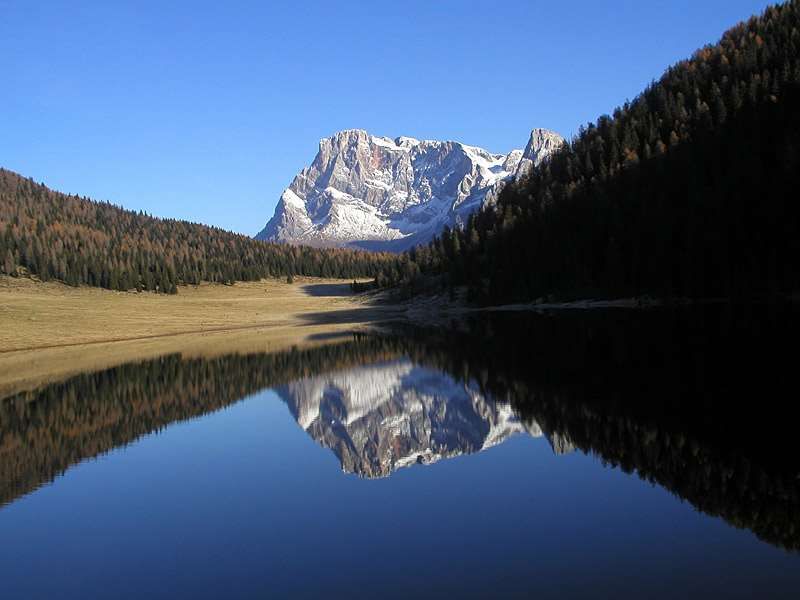
10   Mistral Data
         CINECA,
       DEDAGROUP,
      ARPAE, ECMWF
          harvest

        harmonize

         process

         visualise

          share

                     Cineca - SuperComputing Applications &
                                  Innovations
11                        Mistral Observational Data flow
Altre Regioni
Italiane

                                                                Dati
                                                     Centro
                                                   Funzionale
                                                   Regionale

                  Dati       RMAP           Dati
                                                                Dati

                         Dati e Servizi             RMAP
                                                                Dati

     Altri Enti
     privati e
     pubblici            Tutto il mondo
                            in base alla
                         licenza dei dati
12

          AUTORIZZAZIONE ALLA MESSA A DISPOSIZIONE DEI DATI OSSERVATIVI SULLA PIATTAFORMA MISTRAL

     La Regione
13
Il Consorzio MISTRAL provvederà senza oneri e costi per la Regione a raccogliere i dati direttamente da DPC
partner di progetto.
I dati saranno messi a disposizione del Portale MISTRAL con licenza Creative Commons Attribution 4.0
International (CC-BY 4.0), senza costi a carico del Consorzio MISTRAL.
L’ adozione di tale licenza viene indicata nelle Linee guida nazionali per la valorizzazione del patrimonio
informativo pubblico (https://docs.italia.it/italia/daf/lg-patrimonio-pubblico/it/bozza/index.html).
La Regione Demanda a MISTRAL la predisposizione di tutti i meccanismi di interoperabilità necessari per:
raccogliere i dati nella forma che sarà concordata dal team di progetto
integrarli nell’Archivio centrale di MISTRAL
renderli disponibili e riutilizzabili tramite la piattaforma MISTRAL come dati aperti secondo la Licenza
Creative Commons Attribution 4.0 International (CC-BY 4.0)
data
Il responsabile
Note
1 D.L. n. 195, 19 agosto 2005, “Attuazione della direttiva 2003/4/CE sull'accesso del pubblico all'informazione ambientale"
2 Direttiva 2007/2/CE del Parlamento Europeo e del Consiglio del 14 marzo 200719 The Observational Data flows
Nation-wide radar-derived products coming from DPC
Ground station BUFR data transmitted by Regions via AMQP channel
Ground station JSON data transmitted by Regions and non-profit Weather Associations via
AMQP channel
Ground station BUFR data exposed
by Regions on FTP server
Internal short- to long-term
repository data transfer20 Nation-wide radar-derived products from DPC 1. Download – done by means of public DPC’s WIDE APIS. Implemented with a polling process triggered on the base of each product nominal frequency and using a PostgreSQL DB to support retry and stop/ restart events. 2. Trasformation – GDAL utilities and libraries to transform file format from GeoTIFF to GRIB. The setting of «no data value» and recalculation of the parameter value due to change of unit of measurement are also performed. 3. Storage – the result GRIB file is stored into the Arkimet repository.
21           Radar Data Products available from DPC
               • Surface Rainfall Intensity [frequency: new data every 5min]
      SRI
               • Surface Rain Total, representing the accumulated rainfall in the last 1 hour by integrating radar network data with
     SRT1        data of the pluviometric stations on the ground [frequency: new data every 60min]
               • Surface Rain Total, representing the accumulated rainfall in the last 3 hours by integrating radar network data
     SRT3
                 with data of the pluviometric stations on the ground [frequency: new data every 60min]
               • Surface Rain Total, representing the accumulated rainfall in the last 6 hours by integrating radar network data
     SRT6
                 with data of the pluviometric stations on the ground [frequency: new data every 60min]
               • Surface Rain Total, representing the accumulated rainfall in the last 12 hours by integrating radar network data
     SRT12
                 with data of the pluviometric stations on the ground [frequency: new data every 60min]
               • Surface Rain Total, representing the accumulated rainfall in the last 24 hours by integrating radar network data
     SRT24
                 with data of the pluviometric stations on the ground [frequency: new data every 60min]
     VMI       • Vertical Maximum Intensity [frequency: new data every 5min]

     IR108     • Infrared satellite channel processed to obtain cloud cover [frequency: new data every 5min]

     TEMP      • Surface temperature from ground stations [frequency: new data every 60min]
               • Wind AMV Atmospheric Motion Vector. Vector data file representing wind intensity and direction at high altitude
     AMV
                 coming from satellite remote sensing [frequency: new data every 20min]
               • Vector data file representing the location of lightnings calculated with triangulation of the signals received by
      LTG
                 dedicated ground antennas of the LAMPINET[1] network [frequency: new data every 10min]
                • Heavy Rain Detection, map of important phenomena, classified according to a Severity Index; also displays their
      HRD
                  possible trajectory in the very short term [frequency: new data every 5min]
24 Data post processing
1. Derived Variables Forecast data. Observed data
Calculate derived products not present in the original dataset
(Wind direction, Wind Speed, Air Density, Dew point Temperature, Specific and
Relative Humidity, Snowfall)
2. Statistic Elaborations Forecast data Observed data
• Calculate statistics processes (ex. accumulations or averages, Max and Min) for
given products in a given time interval
3. Formt Conversion Observed data
• Convert the output data file in JSON format25
Data post processing
4. Geographical Elaborations
• Interpolation on a different grid using an uploaded
custom template file or writing the parameters of a
custom new grid
Forecast data
• Grid cropping
Forecast data
• Interpolation on geo-referenced points defined by a
custom uploaded file
Forecast data Observed data26
Weather Data Visualization
Observed data: requirements Forecast data: requirements
• Web service displaying • Web service displaying
observed data from all observed data from all
over Italy on a map over Italy on a map
• Interactive maps with the • Interactive maps with the
possibility to zoom and possibility to zoom and
pan pan
• Filtering data to display • Possibility to display vector
by reference time and images to have high
products resolution while zooming
• Filtering data by networks • Overlap different
(es. Regional networks or meteorological variable
MeteoNetwork) layers (multilayers)
• Map as interface to filter
and download sets of
observed dataWeather Observed Data Visualization (example taken
from RMAP of ArpaE)
27
Product values of a single station Time series (Meteogram)29 Weather Forecast Data Visualization
Requirements/ magics matplotlib plotly folium skinny
Tools
Temporal Slideshow no no Yes no Yes
Interactive Pan no no Yes Yes Yes
Multilayer no no no Yes Yes
Zoom no no Yes Yes Yes
File Size36 Vectorial graphs
37 Example Temp generated with Magics
38 Example Cumulated Precipitation with Magics
40   Italy Flash Flood (ECMWF)

         Workflow for 6-h precipitation forecast
          Global ECMWF ENS                                                 COSMO-2I EPS 2.2 km

                                                                               Variable
               ecPoint post-                                                  resolution
                processing                                                 neighbourhood
                                                                           post-processing
                                                            D
          ecPoint Rainfall 6-h                   IME WEIGHTE
                                                T
                                           LEAD- ENDING                    COSMO post-processed
                                                BL
          ecPoint Rainfall 6-h cropped
          and interpolated to COSMO
                      grid                 COSMO-2I EPS 2.2 km + ecPoint
                                           Rainfall post-processed blended                   In progress…
                                              for Italy and surroundings
                            Tested with                                                  VERIFICATION
                            12-h ecPoint       Skilful 6-h probabilistic
                                                        forecast
42
Case study of 21 October 2019: heavy precipitation over
Piedmont
observations
ecPoint rainfall COSMO-2I-EPS
blending
Both ecPoint rainfall and COSMO-2I-EPS struggle to predict
properly the locations possibly affected by heavy precipitation.
The best results are obtained by blending ecPoint rainfall and
COSMO-2I-EPS.
European Centre for
Medium-Range Weather
Forecasts43 Mistral Services: http://www.mistralportal.it/opendata/
Data Italy Flash
Catalogue Flood
Multimodel
Meteo Hub Forecast44 Mistral Services: http://www.mistralportal.it/opendata/
Data
Visualisation
RADAR &
REALTIME MAPS45 Mistral Meteo Hub
DEMO: Forecast Data Download46 Highlander
Integrazione di dati climatici,
Da previsioni a breve termine a proiezioni a osservazioni satellitari e dati IoT a
medio termine della variabilità climatica supporto della valutazione e gestione
(eventi estremi e relativi rischi climatici) per di ecosistemi
supportare la pianificazione e il decision
making su risorse e sistemi territoriali Previsioni e controlli sugli incendi
boschivi
Programmi di irrigazione
Gestione ambientale dei parchi
Servizio per previsione del fabbisogno naturali
idrico delle colture
Gestione integrata dei parassiti
Benessere degli animali
Cambiamenti nell'idoneità del terreno per la
vegetazione (foreste, colture)
Potenziale di incendio boschivo
Benessere degli animali e idoneità del
terreno per l'agricoltura
Benessere umano
Ciclo dell'acqua e sostenibilità degli usi
concorrentiPrevisioni stagionali del fabbisogno idrico di irrigazione (ARPAE)
47
RS Images from Sentinel 2,
Landsat 8 and Deimos-1 Early crop map
Soil map Input data
Criteria model
Output
Probabilistic downscaled
seasonal forecasts
Climate/Observed data
daily weather data Tmin, Tmax & Prec
Seasonal predictions
of irrigation water needs48
Controllo e Gestione del Parco Naturale
Paneveggio – Pale di San Martino
Fondazione E. MachFondazione E. Mach
52   Mistral e AGROMETEORE

              Grazie!
              Come possiamo collaborare?
You can also read


