Impact of global cooling on Early Cretaceous high pCO2 world during the Weissert Event - OceanRep
←
→
Page content transcription
If your browser does not render page correctly, please read the page content below
ARTICLE
                  https://doi.org/10.1038/s41467-021-25706-0                 OPEN

                  Impact of global cooling on Early Cretaceous high
                  pCO2 world during the Weissert Event
                  Liyenne Cavalheiro 1, Thomas Wagner 2 ✉, Sebastian Steinig3, Cinzia Bottini 1, Wolf Dummann4,8,
                  Onoriode Esegbue2,9, Gabriele Gambacorta5, Victor Giraldo-Gómez 1, Alexander Farnsworth 3,10,
                  Sascha Flögel6, Peter Hofmann4, Daniel J. Lunt 3, Janet Rethemeyer4, Stefano Torricelli7 & Elisabetta Erba                                                    1
1234567890():,;

                  The Weissert Event ~133 million years ago marked a profound global cooling that punctuated
                  the Early Cretaceous greenhouse. We present modelling, high-resolution bulk organic carbon
                  isotopes and chronostratigraphically calibrated sea surface temperature (SSTs) based on an
                  organic paleothermometer (the TEX86 proxy), which capture the Weissert Event in the semi-
                  enclosed Weddell Sea basin, offshore Antarctica (paleolatitude ~54 °S; paleowater depth
                  ~500 meters). We document a ~3–4 °C drop in SST coinciding with the Weissert cold end,
                  and converge the Weddell Sea data, climate simulations and available worldwide multi-proxy
                  based temperature data towards one unifying solution providing a best-fit between all lines of
                  evidence. The outcome confirms a 3.0 °C ( ±1.7 °C) global mean surface cooling across the
                  Weissert Event, which translates into a ~40% drop in atmospheric pCO2 over a period of
                  ~700 thousand years. Consistent with geologic evidence, this pCO2 drop favoured the
                  potential build-up of local polar ice.

                  1 Department of Earth Sciences Ardito Desio, University of Milan, Milan, Italy. 2 The Lyell Centre, Heriot–Watt University, Edinburgh, UK. 3 School of

                  Geographical Sciences, University of Bristol, Bristol, UK. 4 Institute of Geology and Mineralogy, University of Cologne, Cologne, Germany. 5 Eni S.p.A. Natural
                  Resources–Geology and Geophysics Research and Technological Innovation, San Donato Milanese, Milan, Italy. 6 GEOMAR Helmholtz Centre for Ocean
                  Research, Kiel, Germany. 7 Eni S.p.A. Natural Resources–Sedimentology, Stratigraphy and Petrography Department, San Donato Milanese, Milan, Italy.
                  8
                    Present address: Institute of Geosciences, Goethe-University Frankfurt, Frankfurt am Main, Germany. 9Present address: School of Natural and Environmental
                  Science, Newcastle University, Newcastle, UK. 10Present address: State Key Laboratory of Tibetan Plateau Earth System, Resources and Environment
                  (TPESRE), Institute of Tibetan Plateau Research, Chinese Academy of Sciences, Beijing 100101, China. ✉email: t.wagner@hw.ac.uk

                  NATURE COMMUNICATIONS | (2021)12:5411 | https://doi.org/10.1038/s41467-021-25706-0 | www.nature.com/naturecommunications                                     1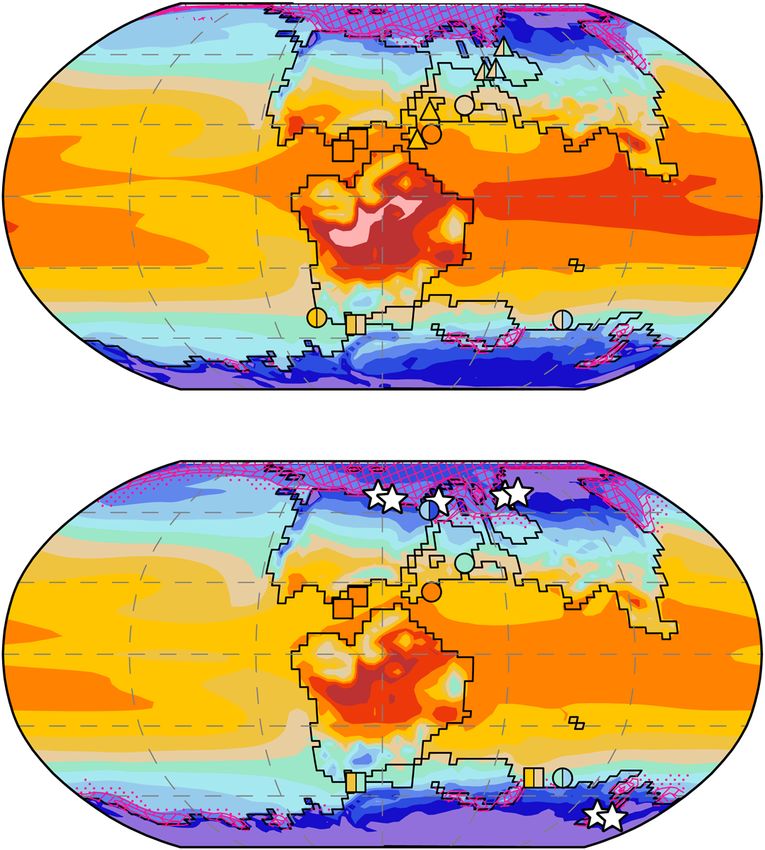
ARTICLE                                                                 NATURE COMMUNICATIONS | https://doi.org/10.1038/s41467-021-25706-0

T
       he greenhouse world of the Mesozoic–Paleogene is a pri-                particular, we assess uncertainties in absolute TEX86-derived
       mary target for understanding the behaviour of the Earth               temperatures and possible regional changes in the TEX86-SST
       system during periods of extreme warmth and its response               relation for young, restricted ocean basins24. The temperature
to recurrent episodes of short-term warming1–4 and cooling5–7,                data from all study sites are aligned against a refined chron-
including the possible build-up of polar ice8. The Late Valangi-              ological framework, defined by the Weissert CIE. By comparing
nian (Early Cretaceous) Weissert Event, calibrated in the upper-              this chronologically aligned multi-proxy ocean temperature
most part of magnetic chron CM12 through the upper part of                    database to global paleoclimate modelling results we present a
magnetic chron CM119 (~133.9–132.6 million years ago; updated                 best-fit approach to resolve the Weissert carbon-climate pertur-
chronological framework in this study) has large potential to shed            bation. It is important to note that this best fit approach does not
light on the climate-carbon-ice relationships at elevated but not             prefer any specific temperature calibration or location, however, it
very high atmospheric pCO2 levels (~500–1700 ppm10). The                      identifies techniques and study sites that are more consistent with
Weissert perturbation is globally documented in the sedimentary               available global observations and global modelling systematics
record by a positive (+1.5‰) carbon isotope excursion (CIE)                   than others. Based on this outcome we estimate the global mean
observed both in organic and inorganic records9. The Weissert                 surface temperatures and associated model pCO2 concentrations
CIE, like other Cretaceous climate perturbations5–7, is associated            for the different phases of the perturbation. This unified solution
with extended volcanism (Paraná-Etendeka Large Igneous                        is then used to explore the probability of ice build-up around
Province9), a carbonate crisis in pelagic and neritic environments,           Antarctica as a result of atmospheric CO2 drawdown during the
local to regional enhanced productivity, and oceanic dysoxia/                 Weissert Event.
anoxia that likely boosted marine organic carbon (Corg) burial, in
combination triggering atmospheric pCO2 drawdown and global
                                                                              Results
cooling9,11–16. However, there are only few proxy records6,15–18
                                                                              Weissert Event chrono- and chemostratigraphy at Site 692. We
that document the complete temperature evolution across the
                                                                              started by combining calcareous nannofossil data and chemos-
Weissert Event. Even less is known about absolute atmospheric
                                                                              tratigraphy (δ13Corg) to identify the Weissert Event based on its
pCO2 levels and the extent of transient polar ice buildup. Many
                                                                              biostratigraphically constrained positive CIE9 (Fig. 2, Supple-
temperature proxy records are inconsistent in their interpretation
                                                                              mentary Figs. 1 and 2 and ‘Methods’ section). Consistent with
due to contrasting ocean temperature reconstructions based on
                                                                              other study sites9,16,25, we find an average amplitude of about
TEX8617, oxygen isotopes16,18 and Mg/Ca palaeothermometers15,
                                                                              1.5‰ (~ −31.5 to −30‰) and identify the onset of the event (A
no systematic comparison with independent evidence, such as
                                                                              in Fig. 2), and two distinct maxima (B and C in Fig. 2), suggesting
climate model simulations, and a lack of alignment against uni-
                                                                              that the Weddell Sea record encompasses the full magnitude and
fied chronological frameworks. Furthermore, Valanginian strati-
                                                                              duration of the Weissert CIE. The onset of the event is placed at
graphic sections from the climatically sensitive sub-polar/polar
                                                                              the base of the positive CIE at ~90.5 mbsf (A in Fig. 2) and the
regions are particularly rare16,17,19,20, fostering the debate
                                                                              end at ~83.5 mbsf (top of the CIE plateau, C in Fig. 2) following
regarding whether the Weissert cooling led to sub-polar
                                                                              the original definition9. The recovery period, marking the return
glaciation8,19,21, as suggested by the occurrence of Late Valangi-
                                                                              of isotope trends towards pre-perturbation levels, follows point C
nian glendonites, dropstones, tillites, and ice-rafted debris both in
                                                                              in Fig. 2, the end of the Weissert perturbation.
sub-Arctic and sub-Antarctic regions (see16).
   Here we present high-resolution data from a ~14 metres long,
calcium carbonate-rich and finely laminated black shale section                Contrasting TEX86-derived temperatures across the Weissert
(78.61–93 metres below seafloor (mbsf); cores 113–692–10R and                  Event. Our TEX86 profile from Site 692 documents variable
113–692–12R) from Ocean Drilling Program (ODP) Site 692 (Leg                  values between 0.77 and 0.63 (Eq. 1 and ‘Methods’ section) over a
113)) in the Weddell Sea (East Antarctica)22. Sample material was             time period of approximately 750 kyr (Fig. 2). Independent of the
provided by GCR—Gulf Coast Repository Texas A&M Uni-                          choice of TEX86-SST calibration, the record shows the highest
versity, College Station, Texas, under request 067321IODP. Site               (warmest) TEX86 values in the Late Berriasian–Early Valanginian
692 was located in a semi-enclosed shelf basin with a paleowater              interval and during the initial warm phase of the Weissert Event
depth of ~500 m and a paleolatitude of ~54 °S22. The Valanginian              (~0.74 in A–B in Fig. 2). Two minima (coolest temperatures,
paleogeography with the location of ODP 692 is shown in Fig. 1.               ~0.66) in the TEX86 record coincide with the Weissert CIE end (C
The study section covers ~5 Myr of climate history from the Late              in Fig. 2) and the Valanginian/Hauterivian boundary, detached
Berriasian–Early Valanginian (~135 Myr; updated chronostrati-                 from the Weissert Event. The two cooling intervals are separated
graphy in Fig. 2) to the Early Hauterivian (~130.5 Myr). A total of           by a (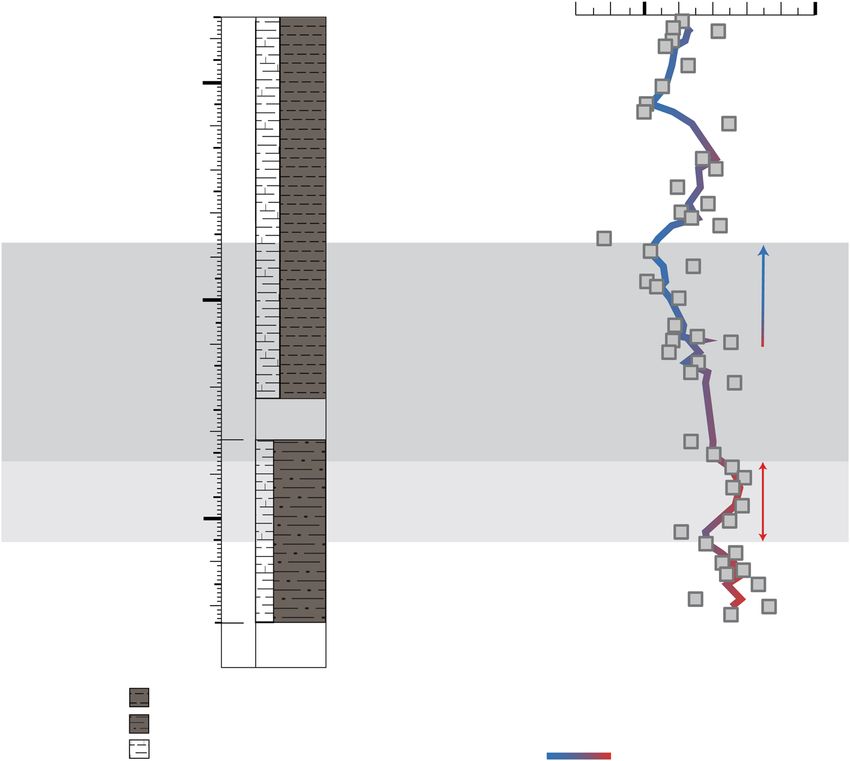
NATURE COMMUNICATIONS | https://doi.org/10.1038/s41467-021-25706-0                                                                                                 ARTICLE

                                                                                                                                                                           90°N

                                                                                22
                                                                                      22                               9        22
                                                                                                                           22
                                                                                                22                8
                                                                                                      17
                                                                                                        16   7                                                             60°

                                                                                       6 14
                          Glycerol Dialkyl                                              13
                          Glycerol Tetraether                                        11 19
                                                                                     5     12                                                                           30°
                          (TEX86)                                       2
                                                                 1 10
                          Clumped isotopes
                          (Δ47)
                 21       Oxygen isotopes                                                                                                                               0°
                          (δ18O)                                                                                                                                   20

                          Mg/Ca ratio
                          (belemnites)                                                                                                                                  30°S
                                                                                                                      3 18

                          Biological/geochemical            15
                                                                                                                                           22
                          cooling evidence                                  4
                                                                                                                                                22
                                                                                                                                                                        60°
                         Dropstones/glendonites
                         /tillites

                                                                                                                                                                        90°S
    180°W       150°        120°         90°        60°          30°            0°              30°              60°                 90°             120°   150°   180°E

Fig. 1 Paleogeographic reconstruction of the Valanginian–Early Hauterivian (~133 Myr). Paleogeographic map by C.R. Scotese, PALEOMAP project64
modified in this work to show the location of available Valanginian–Early Hauterivian multi-proxy-based temperature records (e.g. TEX86, oxygen carbonate
clumped isotopes, oxygen isotopes and belemnite Mg/Ca ratios) from Deep Sea Drilling Project/Ocean Drilling Project (DSDP/ODP) Sites and other
worldwide sections: (1) 534, (2) 603, and (3) 76617; (4) 692this study and 17; (5) Caravaca, (6) Speeton, (7) Izmha, (8) Yatria and (9) Boyarka20; (10) Proto
North Atlantic compilation16; (11) South East (SE) France compilation6, 18; (12) Northwestern Tethys compilation18; (13) Southern Boreal compilation18; (17)
Festningen and Janusfjellet19; (18) 76515; (19) Vocontian Trough compilation15. Biological and geochemical cooling evidence in sub-tropical oceans (blue
stars) from calcareous nannofossils at (20) Site 10499 and from steryl ethers at (21) Site 121333; (22) compilation of Late Valanginian geologic cooling
evidence in sub-polar regions (white stars) from dropstones, glendonites and tillites16. Red box symbols indicate TEX86 data, green triangles clumped
isotopes, turquoise circles oxygen isotopes, orange down-pointing triangles Mg/Ca ratio (belemnite).

and high TEX86 values across the perturbation (~0.9 and 0.93                           site. Moreover, a recent overview of oxygen isotopes on bulk
between the stratigraphic interval identifying the Weissert CIE).                      carbonate in the proto-North Atlantic and in the North-West and
However, the δ13Corg data from Site 766 do not unequivocally                           Southern Tethys16 also documents a cooling in both hemispheres
identify the CIE, and magnetostratigraphy17 suggests an age                            coinciding with the end of the Weissert Event. We note a strong
slightly younger than the end of the CIE (i.e., the base of this                       correlation of the cooling trend documented at Site 692 with the
record starts in the uppermost CM11 polarity chron, and thus it                        only other available detailed record in the Southern Hemisphere
sits slightly above the end of the Weissert Event; Fig. 3).                            at Site 765 (see ref. 16). The stratigraphic resolution of available
   We conclude that this study presents the first robust TEX86-                         Valanginian clumped isotope data20 impedes identification of the
based evidence of a cooling episode coinciding with the end of the                     Weissert CIE but according to biostratigraphy document average
Weissert CIE that contrasts the stable SSTs in the sub-tropical                        temperature values of the warm initial phase of the Weissert CIE
North Atlantic17. We will resolve this apparent contrast by                            and/or of the interval shortly preceding the onset of the pertur-
comparing the TEX86-based results with a global compilation of                         bation (Fig. 3). Within chronological uncertainties, we conclude
other independent temperature proxies in the following section.                        that the temperature trends at Site 692 are in agreement with
                                                                                       these independent global cooling signals. The absolute cooling of
Integrating global ocean temperatures and cooling evidence. In                         about 3–4 °C in the Weddell Sea is larger than for most low-to-
order to explore the global nature of the Weissert Event, we                           mid-latitude sites, which is consistent with the concept of polar
evaluate available upper ocean temperature reconstructions from                        amplification29, leading to a more pronounced high-latitude
other geochemical proxies, such as carbonate clumped isotopes20,                       temperature change. Finally, we consider indirect and geological
oxygen isotopes6,16,18,19,28 and belemnite Mg/Ca ratios15 posi-                        evidence supporting cooler conditions during the Early Cretac-
tioned in our revised and updated bio-chemostratigraphic fra-                          eous. Limited palynoflora data at Site 69230 suggest the presence
mework (Fig. 3). A summary table of all available temperature                          of a cool temperate forest on the Antarctic continent, with high
records encompassing the Weissert CIE is reported in Supple-                           moisture levels and strong seasonality with temperature below
mentary Table 1. Oxygen isotopes on belemnites and/or benthic                          freezing. From the analysis of a qualitative dataset30, we observe
foraminifera6,18, consistent with Mg/Ca measurements on                                that the sample at 84.95 mbsf yields the most diverse palynofloral
belemnites15, document a ~1–2 °C cooling at the end of the                             assemblage. Relying on previous work botanical affinities and
Weissert Event in South East France (~26 °N) and a cooling of up                       ecological preferences31, we postulate that this assemblage, which
to 4 °C in the southern and arctic part of the Boreal Realm                            comprises ferns, Lycopods, Pteridosperms and conifers, is
(~38–65 °N)18. Notably, our detailed stratigraphic re-analysis of                      expression of cooler and more humid climatic conditions com-
these datasets also indicates that the cooling coinciding with the                     pared to assemblages above and below. The occurrence of
end of the Weissert CIE is followed by an intermittent warming,                        Podocarpidites, a typical boreal floral element with broad tem-
and a second minor cooling period that continues in the earliest                       perature range but preference for cool and humid conditions32 is
Hauterivian (Fig. 3); a pattern also noted at the Weddell Sea study                    worth noting as this taxon is absent from samples above and

NATURE COMMUNICATIONS | (2021)12:5411 | https://doi.org/10.1038/s41467-021-25706-0 | www.nature.com/naturecommunications                                                          3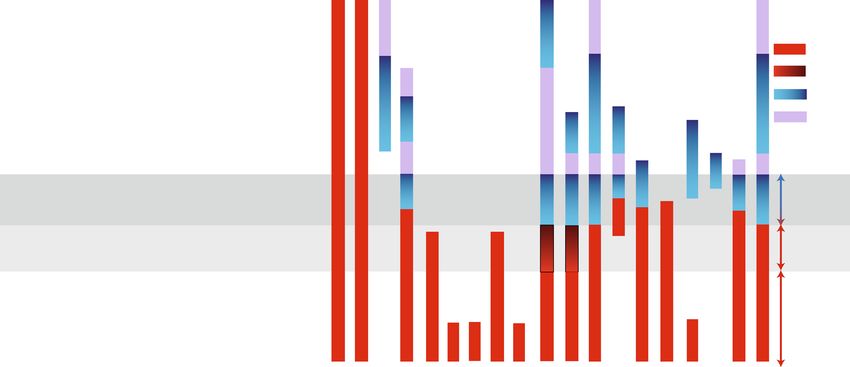
ARTICLE                                                                  NATURE COMMUNICATIONS | https://doi.org/10.1038/s41467-021-25706-0

Fig. 2 Carbon isotopes and sea surface temperatures (SSTs) of cores 10R and 12R at ODP Site 692. a Stage and calcareous nannofossil zonation (Boreal
Realm, BC65 zonation and Tethys, NC66 zonation). b Depth in metres below sea floor (mbsf), cores (12R and 10R), core recovery, and lithology. c Stable
carbon isotope record measured on bulk organic matter (δ13Corg with green circles and a black curve reporting the calculated three point moving average)
and identification of the Weissert positive carbon isotope excursion (CIE) segments (A, Weissert CIE onset; B, Weissert CIE first peak; C, Weissert CIE
end). d Organic TEX86 paleothermometry (grey boxes and a shaded red (warmer values)—blue (colder values) curve reporting the calculated three point
moving average) and the calibration to SSTs in degree °C showing (1) BAYSPAR and (2) restricted basin calibrations, representing maximum and minimum
temperature estimates based on TEX86, respectively.

below 84.95 mbsf. Interestingly, sample 84.95 mbsf is the closest              Event is consistent and argues for a global process, with fluc-
to TEX86 minimum (i.e., coolest temperature) recorded in this                  tuations in atmospheric pCO2 driving temperature.
study (at 83.74 mbsf) and coinciding with the Weissert Event end
(C in Fig. 2). Moreover, latest Valanginian Steryl ethers (ODP
1213, Shatsky Rise, Central Pacific33) and changes in calcareous                Absolute TEX86-derived sea surface temperatures. A variety of
nannofossil assemblages (ODP 1049, Nadezhda Basin, Western                     calibrations have been proposed to convert measured TEX86
Pacific11,34) have been reported in sub-tropical sites, suggesting              ratios to upper ocean temperatures (see ref. 27 and ‘Methods’).
biological evidence of cooler waters in these regions. Further-                The aim of this study is neither to discuss advantages and dis-
more, several findings of latest Valanginian glendonites, drop-                 advantages nor the ecological and statistical justification of indi-
stones, tillites deposits and ice-rafted debris both in the Arctic             vidual approaches, but rather to apply multiple calibrations to
and Antarctic sub-polar regions (>50 °N/S) (see ref. 16 compila-               generate a plausible range of absolute sea surface temperatures for
tion and locations in Fig. 1) are documented. However, the                     each site. We will then use our multi-proxy compilation and
supporting evidence from sub-polar regions21,35,36 has to be                   Valanginian climate model simulations to constrain this proxy
interpreted with caution due to large stratigraphic uncertainties              uncertainty and derive climatic implications by a best-fit
covering the Berriasian to the Early Valanginian, but not speci-               approach between all datasets.
fically the target period of the Weissert Event. Despite strati-                   In our analysis, the BAYSPAR model37,38 provides the upper
graphic and calibration uncertainties from all available geological            end estimate of absolute TEX86-derived ocean temperatures (i.e.,
and proxy evidence we note that the parallel temperature                       max-TEX86). We also report the outcomes from all calibrations in
response of both hemispheres centered around the Weissert                      the Supplementary Data Appendix. Applying the default
                                                                               BAYSPAR Deep-Time settings, SSTs in the Weddell Sea record

4                 NATURE COMMUNICATIONS | (2021)12:5411 | https://doi.org/10.1038/s41467-021-25706-0 | www.nature.com/naturecommunications
NATURE COMMUNICATIONS | https://doi.org/10.1038/s41467-021-25706-0 ARTICLE Fig. 3 Chronological framework of the Weissert Event and evolution of worldwide multi-proxy ocean temperature trends. a Chronostratigraphy of climate and carbon-cycle (Weissert) perturbation event and Paraná-Etendeka timing after (1)67, (2)68 and (3)69; numerical ages in Myr are based on boundary ages of polarity chrons57 revised in this study for the position of the Valanginian/Hauterivian boundary56. b Identification of the Weissert positive carbon isotope excursion (CIE) is based on the reference carbon isotope record measured on bulk carbonate (δ13Ccarb)25 calibrated in the Southern Alps in the uppermost part of magnetic chron CM12 (A, CIE onset) and in the upper part of magnetic chron CM11 (C, CIE end)9. c A detailed correlation to available global multi-proxy-based ocean temperature records is presented by coloured bars (e.g., red (relatively stable warm interval), graded red to darker red (warming interval), blue to darker blue (cooling interval), and lilac (minor warming interlude)), which graphically represent the reconstructed ocean temperature trends organized by type of proxy (e.g., TEX86, carbonate clumped isotopes, oxygen isotopes and Mg/ca ratio paleothermometry). Note that numbered section/site locations of the reported proxy compilation are shown in Fig. 1. decrease from ~30 °C (warm A–B interval in Fig. 2) to a Sea also represents a highly restricted depositional environment, minimum of ~25.6 °C at the cold CIE end (C in Fig. 2). although with different climate conditions16,17,30, i.e., arid and Importantly, results for the logarithmic TEX86H calibration39 warm versus humid and rather cool, respectively. Importantly, a (Supplementary Data Appendix) are similar to the BAYSPAR consistent warm bias in TEX86-SSTs has also been found in method for the Weddell Sea TEX86 range of 0.63 to 0.77. We Pleistocene sapropels from the Mediterranean Sea43, a highly compare these results to published Valanginian BAYSPAR- stratified depositional environment more comparable to the derived SSTs27 (Supplementary Table 1). At Site 766, the Valanginian Weddell Sea (Supplementary ‘Anomalous GDGT temperatures calculated from the 8 lowermost data points distributions’ section). We also find similarities in the i-GDGT (~25 °C27) possibly represent the coolest temperatures at the distributions of Site 692 and present-day samples from the end of the Weissert Event (see Fig. 3). The stable BAYSPAR SSTs Mediterranean Sea (Supplementary Fig. 4). Our benthic for- in the subtropical proto-North Atlantic exceed 40 °C27 across the aminiferal data from Site 692 further indicate an intermediate- perturbation. These high surface temperatures seem irreconcil- deep basin with an outer neritic to upper bathyal paleowater able with Cretaceous climate model results20,24, and foster the depth up to 500 m (Supplementary ‘Benthic foraminifera’ debate about the maximum heat stress tolerated by Cretaceous section). Such a paleowater depth would allow enhanced plants and mammals40. contribution of deeper water Thaumarchaeota communities An alternative explanation for these high TEX86 ratios may producing the distinct i-GDGT distribution recorded in the come from a distinct sedimentary isoprenoid-GDGT (i-GDGT) sediments. Moreover, we document a high GDGT-2/GDGT-3 distribution leading to a different TEX86-temperature relation in ratio >5 (on average 5.7; Supplementary Data Appendix) in the young and restricted Mesozoic ocean basins24. It is important to study samples, which also corroborates a contribution from note that Site 766 offshore Australia represents an open marine Archaea living in the deeper water column44. Further supporting setting with unrestricted connection to the Early Cretaceous evidence for a restricted Early Cretaceous Weddell Basin with ocean41. In contrast, proto-North Atlantic Sites 534 and 603 persistent ocean stratification comes from plate-tectonic recon- represent more restricted settings in a young and evolving ocean structions that show early stages of basin evolution with closed or basin. As recently proposed24, these special environmental limited ocean gateways22 and very high TOC concentrations conditions might have enhanced the contribution of i-GDGTs (range 3.2–12.5%; Supplementary Data Appendix) in black shales from deep-dwelling Thaumarchaeota populations, similar to at Site 692. observations from the modern Mediterranean and Red Sea42 For Sites 603, 534, and 692, the restricted basin calibration that lead to a regional warm bias in TEX86-derived temperatures. accounting for the regional TEX86-temperature relation42 (Eq. 2) Like the proto-North Atlantic, Site 692 in the emerging Weddell yields overall ~6–14 °C cooler SSTs compared to the BAYSPAR NATURE COMMUNICATIONS | (2021)12:5411 | https://doi.org/10.1038/s41467-021-25706-0 | www.nature.com/naturecommunications 5
ARTICLE NATURE COMMUNICATIONS | https://doi.org/10.1038/s41467-021-25706-0
a Weissert warm interval results. Even though the exact ecological justification for the
TEX86 BAYSPAR distinct i-GDGT distributions remains uncertain24, we interpret
40 TEX86 restricted the results as a possible lower end estimate (i.e., min-TEX86) of
δ18O
Δ47 absolute SSTs in these restricted environments. Notably, a recent
upper ocean temperature [°C]
30
692B
BAYSPAR
scaled Val. SST Mg/Ca study has also demonstrated that semi-enclosed basins document
calibration
systematically offset from zonal mean temperatures, and are
692B restr. modern
unusually warm and seasonal compared to the majority of open
basin calibration SST
20 model summer
mean
ocean locations situated at the same latitudes, especially in the
model annual
mean higher latitudes45. We next validate the possible temperature
GMST CO2 RMSE range against our multi-proxy compilation and independent
10 min TEX86: 21.3 °C 1181 ppm 3.9 °C
max TEX86: 25.5 °C 2554 ppm 7.3 °C
climate model results.
only TEX86: 21.7 °C 1267 ppm 0.8 °C In summary, absolute temperatures for the Weddell Sea
only δ18O: 20.7 °C 1062 ppm 5.0 °C
0 only Δ47: 21.5 °C 1233 ppm 3.7 °C
decrease from ~22.7/30 °C (min-/max-TEX86) for the Weissert
warm interval to a minimum of ~20.1/25.6 °C (min-/max-
b Weissert cold end
TEX86) at the cold CIE end. It is important to note that while
40 absolute temperature reconstructions change significantly with
the applied calibration model, the relative cooling of ~3–4 °C
observed at Site 692 is similar for all calibrations.
upper ocean temperature [°C]
30 scaled Val. SST
Global mean surface temperature and pCO2 estimates. We
modern
SST
20
estimate the global mean surface temperature (GMST) evolution
across the Weissert Event by comparing our proxy compilation
10 GMST CO2 RMSE (Fig. 3; Supplementary Table 1) with model-simulated SSTs. This
min TEX86: 18.3 °C 682 ppm 3.1 °C
max TEX86: 24.4 °C 2084 ppm 9.7 °C
approach assumes that the global mean surface temperature
only TEX86: 20.6 °C 1040 ppm 0.5 °C scales linearly with local SSTs and that this scaling factor can be
0 only δ18O: 16.1 °C 448 ppm 2.1 °C
estimated from two model simulations at ×2 and ×4 preindustrial
c Temperature and pCO2 change atmospheric pCO2 concentrations (e.g., 560 and 1120 ppm)46.
This approach allows us to derive an independent GMST estimate
for each proxy site via a single transfer function (Supplementary
upper ocean temperature change [°C]
0 Equation 3). We then calculate average GMSTs across all sites for
both the Weissert warm interval between the Weissert CIE onset
-2 to the first peak CIE (warm A–B interval in Fig. 3) and the cold
Weissert CIE end (C in Fig. 3). We further use the associated
standard errors across all proxy sites as a measure of overall
-4
consistency between different proxy techniques and the model
ΔGMST ΔCO2 RMSE
results.
-6 min TEX86: -3.0 °C -42% 1.3 °C Combining our multi-proxy compilation, the lower-end
max TEX86: -1.1 °C -18% 1.7 °C
only TEX86: -1.1 °C -18% 1.0 °C
estimates of TEX86-derived SSTs (min-TEX86), and annual mean
only δ18O: -4.7 °C -58% 2.5 °C model temperatures we estimate GMSTs of 24.4 °C (±1.8 °C) and
-8
90°S 60°S 30°S 0° 30°N 60°N 90°N
21.5 °C (±1.6 °C) for the Weissert warm interval and cold CIE
end, respectively (Supplementary Table 2). Assuming a linear
Fig. 4 Best-fit model-proxy comparison of upper ocean temperatures and climate sensitivity this indicates a model-derived atmospheric
model CO2 estimates. Estimates of global mean surface temperatures pCO2 concentration above 2000 ppm for the Weissert warm
(GMSTs) and associated model CO2 levels are calculated for the whole interval (Supplementary Fig. 6 and Equation 6). Even though
dataset as well as for three different subsampling experiments including these estimates depend on the climate sensitivity of the model,
only single proxy techniques (only-TEX86, only-δ18O and only-Δ47). In with higher climate sensitivity resulting in lower CO2 values and
addition, TEX86-derived temperatures are calculated from either the vice-versa, they clearly exceed the plausible range of available
calibration for modern deep, restricted basins (min-TEX86) or the Valanginian pCO2 reconstructions (~500–1700 ppm;10). These
BAYSPAR calibration (max-TEX86) for DSDP/ODP sites 534, 603 and 692. high pCO2 estimates are related to very warm GMSTs derived
Error bars document 90% confidence intervals for the TEX86 calibration from mid to high latitude sites of both hemispheres (Supple-
and uncertainties for other proxies as reported in Supplementary Table 1. a mentary Fig. 5). High-latitude proxy reconstructions significantly
Model SSTs are linearly scaled to the best-fit CO2 estimate of 1181 ppm warmer than climate model temperatures are a long-standing
during the Weissert warm interval (see Supplementary Equation 5). Root- challenge for the model-data comparison of past greenhouse
mean-square-error (RMSE) between scaled model temperatures and local climates, including the Valanginian20. A potential reason for this
proxy data are discussed in the Supplementary ‘Global mean surface mismatch is a strong seasonality in available sunlight and food
temperature and pCO2 estimates’ section. Shading around the zonal mean web dynamics, which has the potential to skew higher latitude
shows the range of annual mean SSTs at each latitude, for modern70 (grey) proxy reconstructions towards seasonal rather than annual mean
and Valanginian (red and blue). Dashed symbols represent simulated temperatures (e.g., refs. 47–49). We explore this hypothesis by
annual (summer) mean SSTs at low (high) latitude proxy locations for the repeating the analysis with simulated warmest 3-month mean
derived mean CO2 concentrations. Black bars show the difference between instead of annual mean temperatures for mid to high latitude sites
the warmest 3-months and annual mean temperature for high-latitude poleward of 45 °. The assumption of a summer bias in high-
sites. b Model SSTs linearly scaled to the mean CO2 estimates of 682 ppm latitude proxy reconstructions reduces absolute GMST estimates
during the Weissert cold end. c Model temperature and pCO2 change from to 21.3 °C (±1.2 °C) for the Weissert warm interval and 18.3 °C
the Weissert warm interval to Weissert cold end. (±1.1 °C) for the Weissert cold end, a reduction of about 3 °C for
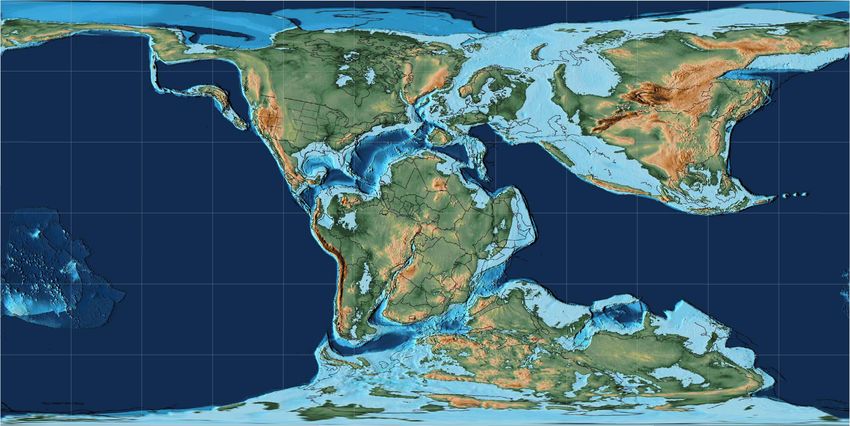
6 NATURE COMMUNICATIONS | (2021)12:5411 | https://doi.org/10.1038/s41467-021-25706-0 | www.nature.com/naturecommunicationsNATURE COMMUNICATIONS | https://doi.org/10.1038/s41467-021-25706-0 ARTICLE Fig. 5 Simulated and reconstructed annual mean surface temperatures and cooling across the Weissert Event. a Model fields combine surface air temperatures over land with sea surface temperatures (SSTs) over the ocean and are linearly scaled to the calculated mean pCO2 estimates of 1181 ppm during the Weissert warm interval (Supplementary Equation 5). Pink contours show associated maximum monthly mean sea ice concentrations. Symbols represent available proxy information. High-latitude sites (poleward of 45 °) also show approximated annual mean temperatures where the model- estimated difference between summer and annual mean values is subtracted from the original proxy temperatures to correct for a possible seasonal warm bias and to facilitate the model-data comparison. b Annual mean surface temperatures during the Weissert cold end scaled to the mean pCO2 estimate of 682 ppm. c Estimated surface cooling from the Weissert warm interval to the Weissert cold end, i.e. panel a minus b, with an associated pCO2 drop of ~40%. both periods (Supplementary Table 2). The reduced standard of independent pCO2 reconstructions10. Our results indicate a errors compared to the annual mean analysis document an drop in GMST of 3.0 °C (±1.7 °C) towards the Weissert CIE end overall more consistent distribution in simulated and recon- (Fig. 4c). This global cooling and the corresponding ~40% structed surface temperatures. Associated pCO2 concentrations reduction in pCO2 is independent of any seasonal bias under this assumption are ~1180 ppm (940–1480 ppm) and assumption (Supplementary Fig. 6), and in good agreement with ~680 ppm (550–840 ppm) for the Weissert warm interval and proxy estimates from carbon isotopes on terrestrial plant cold CIE end, respectively (Fig. 4), and therefore within the range records13. NATURE COMMUNICATIONS | (2021)12:5411 | https://doi.org/10.1038/s41467-021-25706-0 | www.nature.com/naturecommunications 7
ARTICLE                                                                  NATURE COMMUNICATIONS | https://doi.org/10.1038/s41467-021-25706-0

   We further repeat our analysis for four different variations of the         global sea level changes and variations in ocean water salinity in
proxy data to assess the sensitivity of our results to the selected proxy      high-latitude basins from oxygen isotopes (see ref. 16).
techniques and temperature calibrations. The max-TEX86 data-set
(BAYSPAR) increases local proxy temperatures by ~6–14 °C in the                Discussion
proto-Weddell Sea and proto-North Atlantic sites and therefore                 Our findings from geological evidence, proxy records and climate
overall GMST estimates (Supplementary Table 2). The corresponding              model simulations provide a calibrated context of global climate
model pCO2 concentration of more than 2500 ppm for the Weissert                perturbation for the ~2 million years history of the Early Cretaceous
warm interval by far exceeds the upper end of available reconstruc-            Weissert Event. This study documents the first TEX86-based evidence
tions and results in overall higher root-mean-square-errors in the             of a relevant cooling episode coinciding with the end of the Weissert
model-data comparison (Fig. 4). The increased standard errors of the           perturbation in the sub-polar proto-Weddell Sea. The observed
mean for max-TEX86 compared to min-TEX86 (Supplementary                        cooling (3–4 °C) is consistent with global signals based on different
Table 2) indicate an overall worse fit between BAYSPAR-derived                  types of SST proxies that overall document a more pronounced
GMST estimates and those based on other proxy methods. We,                     temperature response in the most climate sensitive high-latitude
therefore, observe that the highest degree of consistency between              regions (polar amplification). This outcome not only contributes to
model temperatures and our proxy compilation is achieved by                    the long-lasting discussion about the potential for polar ice during
application of a regional TEX86 calibration for restricted Mesozoic            greenhouse conditions but also offers a strategy to investigate other
ocean basins for selected sites in combination with a seasonal warm            periods with comparable temperature-pCO2 boundary conditions
bias in high-latitude SST proxies. Only this specific combination               and inconsistent proxy reconstructions. The strength of the presented
permits a model-data congruence within the plausible range of pCO2             best-fit approach between modelling and multi-proxy data compi-
reconstructions for the Valanginian10,50,51 and will be further                lation is that it is largely decoupled from uncertainties and limitations
discussed in the next section.                                                 of individual proxy estimates and other constraints (chronology,
                                                                               paleobathymetry and paleolatitude). Instead, the approach statisti-
                                                                               cally identifies one solution where all available data and model
High-latitude cooling and ice formation during the end of the                  configurations converge towards a single (most) plausible scenario.
Weissert Event. The cold Weissert CIE end is associated with a                 The described strategy implies that the best-solution approach can be
drop in the GMST of 3.0 °C (±1.7 °C) compared to the Weissert                  adapted as new evidence and understanding emerges, without being
warm interval, but the modelling results indicate large contrasts              skewed or biased by individual observations. The ongoing discussion
in the regional cooling patterns (Fig. 5c). Minimum cooling of                 on SST estimates from GDGT-based TEX86 paleothermometry is one
1–2 °C is simulated for the subtropics, while it exceeds 6 °C in               area where a consensus cannot easily be reached, leading to incon-
polar, continental regions. The reduced sensitivity of proto-Arctic            sistent and often opposing interpretations. We propose that moving
Ocean temperatures can be explained by already near-freezing                   away from such individual observations and discussions towards
temperatures during the Weissert warm onset (Fig. 5a). The                     more integrated solutions, as shown in this study, bear large potential
model supports the possibility for seasonal sea ice formation in               to better recognize large scale inter-relationships and quantify climate
the Arctic and around Antarctica for both Weissert pCO2 sce-                   and environmental change back in time, setting further constraints
narios. The seasonal sea ice coverage however expands during the               for projecting the future.
cool end of the event, with largest increases around the Arctic.
The latitudes of maximum simulated cooling and sea ice exten-
                                                                               Methods
sion (~50–70 ° in both hemispheres) coincide with the location of              Calcareous nannofossils and benthic foraminifera. A total of 69 samples were
upper Valanginian dropstones, glendonites and tillites16 (Fig. 5c),            investigated for calcareous nannofossils; samples were prepared using the simple
indicating cooler surface waters, sea ice and drifting ice condi-              smear slide technique and examined under polarising light microscope, at ×1250
tions. We quantify net snow mass accumulation rates as a first-                 magnification. Notably, we adopt a revised56 timescale57 for the position of the
                                                                               Valanginian/Hauterivian boundary relative to polarity chrons (Supplementary
order approximation for the potential of ice formation on Ant-                 calcareous nannofossils section and Supplementary Fig. 1). Samples for benthic
arctica (Supplementary Fig. 7). The total snow mass surviving the              foraminifera analysis were disaggregated in hydrogen peroxide (H2O2), washed
Antarctic summer increases by ~58% in the ×2 pCO2 simulation                   under tap water over >63 μm mesh and dry sieved. All residues of the size-fraction
(~cold Weissert CIE end) compared to the ×4 pCO2 results                       >63 μm were picked, identified, counted, and permanently stored in Plummer
                                                                               slides for benthic foraminifera (Supplementary ‘Benthic foraminifera’ section).
(~warm Weissert interval). Areas of potential land ice formation
are restricted to southern and western coastal, high-elevation
(>2000 m) regions. Previous modelling results support a pCO2                   Carbon isotope and TOC analysis. Bulk dried and ground samples (N = 81, avg.
                                                                               resolution ~25–50 kyr) were analyzed for bulk organic stable carbon isotope ratios
threshold for the onset of Antarctic glaciation between ×2 to ×4               (δ13Corg) and TOC at Iso-Analytical, Crewe Cheshire UK, by a Europa Scientific
pre-industrial levels for the Early Cretaceous52 and the                       Elemental Analyser–Isotope Ratio Mass Spectrometry (EA–IRMS). Weighed
Cenozoic53, even though absolute numbers depend on the climate                 powdered samples were acidified with 2 M hydrochloric acid, mixed, left for 24 h,
model54. Within model and paleogeographic uncertainties, our                   then washed and oven dried at 60 °C. Weighed samples were loaded into an
                                                                               autosampler. The temperature of the furnace was held at 1000 °C, reaching up
simulations support small scale continental glaciation during the              ~1700 °C in the region of the sample. Repeat analysis on check samples (e.g., IA-
Valanginian, consistent with geological observations. Moreover,                R005 and IA-R006) and the reference material used during δ13C analysis (e.g., IA-
calcareous nannofossil data from Site 692 (this study) confirm                  R001-Iso-Analytical standard wheat flour), ensure standard deviation
NATURE COMMUNICATIONS | https://doi.org/10.1038/s41467-021-25706-0 ARTICLE
v/v), and MeOH as subsequent eluents. The MeOH-fraction containing the paleopositions (Supplementary ‘Global mean surface temperature and pCO2
GDGTs was dissolved in hexane/isopropanol (95:5, v/v) and 20 μL of C46 GDGT estimates’ section and Supplementary Tables 1 and 2).
tetraether idol lipid standard was added prior to filtering through 0.45 mm Teflon
filters. Samples were analysed at the University of Cologne using an Agilent 1290
Infinity ultra high permormance liquid chromatography (HPLC) paired with an Data availability
Agilent GDGT 6460 Triple Quadrupole MS system. Published chromatographic The TEX86 and stable carbon isotopes data and the complete calcareous nannofossil
conditions were applied58 in selected ion monitoring mode, following previous range chart generated in this study are provided in the Supplementary Source data
work for GDGTs identification23,26. Peak areas were integrated and calibrated file. Source data are provided with this paper.
against the internal C46 standard. The TEX86 index (Eq. 1) was calculated as
originally defined23: Received: 8 January 2021; Accepted: 12 August 2021;
½GDGT 2 þ ½GDGT 3 þ ½Cren'
TEX86 ¼ ð1Þ
½GDGT 1 þ ½GDGT 2 þ ½GDGT 3 þ ½Cren'
We note that our high-resolution record from Site 692 is consistent with 5 available
published sample data for the study stratigraphic interval from same site location17.
Repeat analysis of an in-house standard and the application of published analytical
techniques23,26 suggest that the analytical error associated with TEX86 analysis is well
References
1. Wagner, T. et al. Rapid warming and salinity changes of Cretaceous surface
below the observed variable TEX86 range (0.77–0.63) and the mean TEX86 decrease
waters in the subtropical North Atlantic. Geology 36, 203 (2008).
from the Weissert warmest interval (~0.74 between A and B in Fig. 2) to the Weissert
2. Jenkyns, H. C., Schouten-Huibers, L., Schouten, S. & Sinninghe Damsté, J. S.
cold end (~0.66 in C in Fig. 2) documented at Site 692. Therefore, the highest error
uncertainty in SST estimates comes calibration errors themselves (see also ref. 27). Warm Middle Jurassic–Early Cretaceous high-latitude sea-surface
temperatures from the Southern Ocean. Clim. Past 8, 215–226 (2012).
3. Bottini, C. & Erba, E. Mid-Cretaceous paleoenvironmental changes in the
TEX86 calibration. Based on a published compilation of Cretaceous TEX86 data western Tethys. Clim. Past 14, 1147–1163 (2018).
and calibration methods27, we present in our Supplementary Data Appendix all 4. Klages, J. P. et al. Temperate rainforests near the South Pole during peak
temperature results based on different calibrations for the Valanginian sites (60317, Cretaceous warmth. Nature 580, 81–86 (2020).
53417, 766;17 and 69217 and this study), including the BAYSPAR calibration model 5. McAnena, A. et al. Atlantic cooling associated with a marine biotic crisis
that reports in the main text the upper end TEX86 estimates max-TEX86 calculated during the mid-Cretaceous period. Nat. Geosci. 6, 558–561 (2013).
in our analysis. Notably, following a recent study24 it was further applied a regional 6. Bodin, S., Meissner, P., Janssen, N. M. M., Steuber, T. & Mutterlose, J. Large
calibration, based on a deep-water TEXH86 dataset for deep restricted modern igneous provinces and organic carbon burial: Controls on global temperature
basins42 (Eq. 2), to the restricted Sites 534 and 603, and 692. and continental weathering during the Early Cretaceous. Glob. Planet. Change
ð2Þ 133, 238–253 (2015).
86 Deep restricted basin SST ð CÞ ¼ 56:3 x ðTEX86 Þ þ 30:2; ± 1 C
TEXH H
7. Bottini, C. et al. Climate variability and ocean fertility during the Aptian Stage.
Clim 11, 383–402 (2015).
Glycerol dialkyl glycerol tetraethers screening. A strict GDGT screening pro- 8. Miller, K. G. Broken greenhouse windows. Nat. Geosci. 2, 465–466 (2009).
cedure was applied (see ref. 27) to rule out secondary effects, such as thermal 9. Erba, E., Bartolini, A. & Larson, R. L. Valanginian Weissert oceanic anoxic
alteration, overprint by terrestrial input, and methanogenesis. To this end, we event. Geology 32, 149 (2004).
verified that the following indices are within the boundaries deemed to represent 10. Foster, G. L., Royer, D. L. & Lunt, D. J. Future climate forcing potentially without
suitable organic matter for TEX86-based SST reconstructions: a Methane Index precedent in the last 420 million years. Nat. Commun. 8, 14845 (2017).
(MI) < 0.5, GDGT-0 percentage >67% and the crenarchaeol index (fCren’:Cren’ + 11. Weissert, H. & Erba, E. Volcanism, CO2 and palaeoclimate: a Late
Cren) < 0.25. The laminated sediments and high TOC values (3.2–12.5%) in the
Jurassic–Early Cretaceous carbon and oxygen isotope record. J. Geol. Soc. 161,
analysed samples indicate deoxygenated bottom waters in the restricted Weddell 695–702 (2004).
Sea basin. To test for possible physiological controls on TEX86 we calculated the 12. Erba, E. & Tremolada, F. Nannofossil carbonate fluxes during the Early
Ring Index (ΔRI)59 during our initial quality screening. This measure is explicitly Cretaceous: Phytoplankton response to nutrification episodes, atmospheric
designed to identify whether TEX86 samples might be significantly influenced by CO2, and anoxia. Paleoceanogr 19, PA1008 (2004).
non-temperature factors, like low dissolved oxygen levels. Importantly all TEX86 13. Gröcke, D. et al. The Upper Valanginian (Early Cretaceous) positive
samples show |ΔRI| values well below the threshold of 0.3 (maximum of 0.16) and carbon–isotope event recorded in terrestrial plants. Earth Planet. Sci. Lett. 240,
therefore indicate an overall dominant control of environmental temperature on 495–509 (2005).
measured TEX86. Note that the branched and isoprenonoid tetrather (BIT) index 14. Bornemann, A. & Mutterlose, J. Calcareous Nannofossil and δ13C records
was not calculated in our samples because the concentrations of branched GDGTs from the Early Cretaceous of the Western Atlantic Ocean: Evidence for
were below detection limit. We thus assume the BIT index to be 0 or very low for enhanced fertilization across the Berriasian-Valanginian transition. Palaios 23,
all investigated samples as shown in previous work at this site17. Further details in 821–832 (2008).
Supplementary ‘Organic matter quality and thermal maturation’ section. 15. Price, G. D. et al. A high-resolution Belemnite geochemical analysis of early
Cretaceous (Valanginian–Hauterivian) environmental and climatic
Climate model simulations. Climate model simulations are based on published perturbations. Geochem. Geophys. Geosyst. 19, 3832–3843 (2018).
work46 and were performed with the coupled atmosphere-ocean-vegetation climate 16. Charbonnier, G. et al. A global palaeoclimatic reconstruction for the
model HadCM3BL-M2.1aD60. The model uses a horizontal resolution of 3.75 ° in Valanginian based on clay mineralogical and geochemical data. Earth-Sci. Rev.
longitude by 2.5 ° in latitude with 19 vertical levels in the atmosphere and 20 ocean 202, 103092 (2020).
depth levels. Two simulations employing a Valanginian (~138 Myr) paleogeography61 17. Littler, K., Robinson, S. A., Bown, P. R., Nederbragt, A. J. & Pancost, R. D.
at ×2 and ×4 pre-industrial atmospheric CO2 concentrations (e.g., 560 and 1120 ppm) High sea-surface temperatures during the Early Cretaceous Epoch. Nat.
build the foundation for the model-data comparison. Atmospheric CO2 levels during Geosci. 4, 169–172 (2011).
the Valanginian–Hauterivian are currently not well constrained but were probably 18. Meissner, P., Mutterlose, J. & Bodin, S. Latitudinal temperature trends in the
lower than during the peak greenhouse conditions of the mid-Cretaceous10,50, and most northern hemisphere during the Early Cretaceous (Valanginian–Hauterivian).
likely between ×2 to ×4 preindustrial level10,50,51. The general circulation model is Palaeogeogr. Palaeoclimatol. Palaeoecol. 424, 17–39 (2015).
coupled to the dynamic global vegetation model TRIFFID via the land surface scheme 19. Price, G. D. & Nunn, E. V. Valanginian isotope variation in glendonites and
MOSES 2.1. Orbital parameters are set to present-day values, but with a reduced solar belemnites from Arctic Svalbard: transient glacial temperatures during the
constant of 1349.1 W/m2 following published work62. Cretaceous greenhouse. Geology 38, 251–254 (2010).
The ×4 simulation is initialized with a globally homogeneous salinity of 35 ppt 20. Price, G. D., Bajnai, D. & Fiebig, J. Carbonate clumped isotope evidence for
and an idealized zonal mean ocean temperature profile that changes with latitudinal seawater temperature gradients and the oxygen isotope
latitude61. The ×2 simulation is branched off at model year 422 and both composition of Early Cretaceous seas. Palaeogeogr. Palaeoclimatol. Palaeoecol.
integrations are continued for a further 10,000 years. Remaining model 552, 109777 (2020).
temperature drifts in both simulations are very small with radiation imbalances at 21. Alley, N. F., Hore, S. B. & Frakes, L. A. Glaciations at high-latitude Southern
the top of the atmosphere over the last 100 yearsARTICLE NATURE COMMUNICATIONS | https://doi.org/10.1038/s41467-021-25706-0
tool for reconstructing ancient sea water temperatures? Earth Planet. Sci. Lett. 52. Ladant, J.-B. & Donnadieu, Y. Palaeogeographic regulation of glacial events
204, 265–274 (2002). during the Cretaceous supergreenhouse. Nat. Commun. 7, 12771 (2016).
24. Steinig, S. et al. Evidence for a regional warm bias in the Early Cretaceous 53. DeConto, R. M. & Pollard, D. Rapid Cenozoic glaciation of Antarctica induced
TEX86 record. Earth Planet. Sci. Lett. 539, 116184 (2020). by declining atmospheric CO2. Nature 421, 245–249 (2003).
25. Sprovieri, M., Coccioni, R., Lirer, F., Pelosi, N. & Lozar, F. Orbital tuning of a 54. Gasson, E. et al. Uncertainties in the modelled CO2 threshold for Antarctic
lower Cretaceous composite record (Maiolica Formation, central Italy). glaciation. Clim 10, 451–466 (2014).
Paleoceanogr 21, PA4212 (2006). 55. Mutterlose, J. Lower Cretaceous nannofossil biostratigraphy off northwestern
26. Schouten, S., Forster, A., Panoto, F. E. & Sinninghe Damsté, J. S. Towards Australia (Leg 123). In Proc. ODP, Sci. Res. Vol. 123 (eds et al.) 343–368
calibration of the TEX86 palaeothermometer for tropical sea surface temperatures (Ocean Drilling Project, 1992).
in ancient greenhouse worlds. Org. Geochem. 38, 1537–1546 (2007). 56. Ogg, J. G., Ogg, G. M., & Gradstein, F. M. A Concise Geologic Time Scale
27. O’Brien, C. L. et al. Cretaceous sea-surface temperature evolution: Constraints (Elsevier, Amsterdam, 2016).
from TEX86 and planktonic foraminiferal oxygen isotopes. Earth Sci. Rev. 57. Malinverno, A., Hildebrandt, J., Tominaga, M. & Channell, J. E. T.
172, 224–247 (2017). M-sequence geomagnetic polarity time scale (MHTC12) that steadies global
28. Gómez Dacal, A. R. et al. Evidence of warm seas in high latitudes of southern spreading rates and incorporates astrochronology constraints. J. Geophys. Res.
South America during the Early Cretaceous. Cretac. Res. 95, 8–20 (2019). 117, B6 (2012).
29. Stuecker, M. F. et al. Polar amplification dominated by local forcing and 58. Hopmans, E. C., Schouten, S. & Sinninghe Damsté, J. S. The effect of
feedbacks. Nat. Clim. Change 8, 1076–1081 (2018). improved chromatography on GDGT-based palaeoproxies. Org. Geochem. 93,
30. Mohr B. A. R. Early Cretaceous palynomorphs from ODP Sites 692 and 693, 1–6 (2016).
the Weddell Sea, Antarctica. In Proc. ODP Sci. Res. Vol. 113 (eds et al.) 325- 59. Zhang, Y. G., Pagani, M. & Wang, Z. Ring Index: A new strategy to evaluate
351 (Ocean Drilling Program, 1990). the integrity of TEX 86 paleothermometry: quality control for TEX 86
31. Kujau, A. et al. Reconstructing Valanginian (Early Cretaceous) mid-latitude temperatures. Paleoceanography 31, 220–232 (2016).
vegetation and climate dynamics based on spore-pollen assemblages. Rev. 60. Valdes, P. J. et al. The BRIDGE HadCM3 family of climate models:
Palaeobot. Palynol. 197, 50–69 (2013). HadCM3@Bristol v1.0. Geosci. Model Dev. 10, 3715–3743 (2017).
32. Hochuli, P. A. & Kelts, K. Palynology of Middle Cretaceous black clay facies 61. Lunt, D. J. et al. Palaeogeographic controls on climate and proxy
from DSDP sites 417 and 418 of the western North Atlantic. In Initial Reports interpretation. Clim. Past 12, 1181–1198 (2016).
DSDP. Vol. 51 (eds Donnelly et al.) 897–935 (Deep Sea Drilling Project, 1980). 62. Gough, D. O. Solar interior structure and luminosity variations. Sol. Phys. 74,
33. Brassell, S. C. Steryl ethers in a Valanginian claystone: molecular evidence for 21–34 (1981).
cooler waters in the central Pacific during the Early Cretaceous? Palaeogeogr. 63. Inglis, G. N. et al. Global mean surface temperature and climate sensitivity of
Palaeoclimatol. Palaeoecol. 282, 45–57 (2009). the early Eocene Climatic Optimum (EECO), Paleocene–Eocene Thermal
34. Kessels, K., Mutterlose, J. & Michalzik, D. Early Cretaceous (Valanginian – Maximum (PETM), and latest Paleocene. Clim. Past 16, 1953–1968 (2020).
Hauterivian) calcareous nannofossils and isotopes of the northern 64. Scotese, C. R. Map Folio 29, Early Cretaceous (Hauterivian, 132.0 Ma), https://
hemisphere: proxies for the understanding of Cretaceous climate. Lethaia 39, doi.org/10.13140/2.1.1284.1768 (2013).
157–172 (2006). 65. Bown, P. R., Rutledge, D. C., Crux, J. A. & Gallagher, L. T. Early Cretaceous.
35. Vickers, M. L. et al. The duration and magnitude of Cretaceous cool events: In Calcareous Nannofossil Biostratigraphy (ed Bown, P. R.) 86–131(Chapman
Evidence from the northern high latitudes. GSA Bull. 131, 1979–1994 (2019). and Hall, Cambridge, 1998).
36. Rogov, M. et al. Database of global glendonite and ikaite records throughout 66. Bralower, T. J., Leckie, R. M., Sliter, W. V., & Thierstein, H. R. An integrated
the Phanerozoic. Earth Syst. Sci. Data 13, 343–356 (2021). Cretaceous microfossil biostratigraphy. In Geochronology, Time Scales and Global
37. Tierney, J. E. & Tingley, M. P. A TEX86 surface sediment database and Stratigraphic Correlation (eds Berggren W. A., Kent D. V., Aubry M.-P. &
extended Bayesian calibration. Sci. Data 2, 150029 (2015). Hardenbol J.) Vol. 54, 65–79 (Spec. Publ. Soc. Econ. Paleontol. Mineral., 1995).
38. Tierney, J. E. & Tingley, M. P. A Bayesian, spatially-varying calibration model 67. Thiede, D. S. & Vasconcelos, P. M. Paraná flood basalts: rapid extrusion
for the TEX86 proxy. Geochim. Cosmochim. Ac. 127, 83–106 (2014). hypothesis confirmed by new 40Ar/39Ar results. Geology 38, 747–750 (2010).
39. Kim, J. –H. et al. New indices and calibrations derived from the distribution of 68. Janasi, V., de, A., de Freitas, V. A. & Heaman, L. H. The onset of flood basalt
crenarchaeal isoprenoid tetraether lipids: Implications for past sea surface volcanism, Northern Paraná Basin, Brazil: A precise U–Pb baddeleyite/zircon
temperature reconstructions. Geochim. Cosmochim. Ac. 74, 4639–4654 (2010). age for a Chapecó-type dacite. Earth Planet. Sci. Lett. 302, 147–153 (2011).
40. Hay, W. W. & Floegel, S. New thoughts about the Cretaceous climate and 69. Dodd, S. C., Mac Niocaill, C. & Muxworthy, A. R. Long duration (>4 Ma) and
oceans. Earth-Sci. Rev. 115, 262–272 (2012). steady-state volcanic activity in the early Cretaceous Paraná–Etendeka Large
41. Holbourn, A. E. L. & Kaminski, M. A. Valanginian to Barremian Benthic Igneous Province: New palaeomagnetic data from Namibia. Earth Planet. Sci.
Foraminifera from ODP Site 766 (Leg 123, Indian Ocean). Micropal 41, 197 Lett. 414, 16–29 (2015).
(1995). 70. Rayner, N. A. Global analyses of sea surface temperature, sea ice, and night
42. Kim, J. –H. et al. Influence of deep-water derived isoprenoid tetraether lipids marine air temperature since the late nineteenth century. J. Geophys. Res. 108,
on the TEX86H paleothermometer in the Mediterranean Sea. Geochim. 4407 (2003).
Cosmochim. Ac 150, 125–141 (2015).
43. Polik, C. A., Elling, F. J. & Pearson, A. Impacts of Paleoecology on the TEX86
sea surface temperature proxy in the Pliocene‐Pleistocene Mediterranean Sea. Acknowledgements
Paleoceanogr. Palaeoclimatol. 33, 1472–1489 (2018). We thank the ODP repository teams in Bremen and Kochi for providing sample material for
44. Taylor, K. W. R., Huber, M., Hollis, C. J., Hernandez-Sanchez, M. T. & Pancost, this project. We also thank Eni Spa for financial support and permission to publish this study.
R. D. Re-evaluating modern and Palaeogene GDGT distributions: Implications The project has strongly benefitted from technical support by M. Pegoraro in Milan and D.
for SST reconstructions. Glob. Planet. Change 108, 158–174 (2013). Warok in Cologne. Funding was provided by Erasmus+ Traineeship scholarship to LC, the
45. Judd, E. J., Bhattacharya, T. & Ivany, L. C. A dynamical framework for Milano group benefited of the fund PRIN 2017RX9XXXY awarded to E.E. and Eni SpA
interpreting ancient sea surface temperatures. Geophys. Res. Lett. 47, Research & Development provided financial support for research to E.E. and T.W. The
e2020GL089044 (2020). authors also acknowledge the financial support from the University of Milan through the APC
46. Farnsworth, A. et al. Climate sensitivity on geological timescales controlled by initiative and from the Italian Ministry of University (MUR) through the project “Diparti-
nonlinear feedbacks and ocean circulation. Geophys. Res. Lett. 46, 9880–9889 menti di Eccellenza 2018–2022, Le Geoscienze per la Società: Risorse e loro evoluzione”.
(2019).
47. Bijl, P. K. et al. Early Palaeogene temperature evolution of the southwest
Pacific Ocean. Nature 461, 776–779 (2009). Author contributions
48. Price, G. D. & Passey, B. H. Dynamic polar climates in a greenhouse world: L.C. conducted all isotopic and molecular geochemical analyses and led the writing of the
evidence from clumped isotope thermometry of Early Cretaceous belemnites. study. T.W. conceptualized the study, established the data-model synergies, and co-led
Geology 41, 923–926 (2013). the writing, in close partnership with E.E. C.B., G.G. and V.G.-G. conducted chronos-
49. Super, J. R. et al. Late Cretaceous climate in the Canadian Arctic: multi-proxy tratigraphic and paleoenvironmental analyses, led by E.E. D.L. and A.F. provided all
constraints from Devon Island. Palaeogeogr. Palaeoclimatol. Palaeoecol. 504, 1–22 climate model simulations, S.S. performed the model-data comparison and led the
(2018). writing of the modelling part. S.F. contributed to the model-data comparison. The
50. Wang, Y. et al. Paleo-CO2 variation trends and the Cretaceous greenhouse biomarker work and TEX86 analyses conducted by L.C. were supported by W.D., J.R.,
climate. Earth-Sci. Rev. 129, 136–147 (2014). P.H. and O.E. S.T. contributed to the revision and discussion of palynology data available
51. Jing, D. & Bainian, S. Early Cretaceous atmospheric CO2 estimates based on at ODP site 692. All co-authors contributed to the writing of the manuscript.
stomatal index of Pseudofrenelopsis papillosa (Cheirolepidiaceae) from
southeast China. Cretac. Res. 85, 232–242 (2018).
Competing interests
The authors declare no competing interests.
10 NATURE COMMUNICATIONS | (2021)12:5411 | https://doi.org/10.1038/s41467-021-25706-0 | www.nature.com/naturecommunicationsYou can also read