Importance of erythrocyte deformability for the alignment of malaria parasite upon invasion - bioRxiv
←
→
Page content transcription
If your browser does not render page correctly, please read the page content below
bioRxiv preprint first posted online Apr. 17, 2019; doi: http://dx.doi.org/10.1101/611269. The copyright holder for this preprint
   (which was not peer-reviewed) is the author/funder, who has granted bioRxiv a license to display the preprint in perpetuity.
                                     It is made available under a CC-BY 4.0 International license.

Manuscript submitted to Biophysical Journal
Article

Importance of erythrocyte deformability for the
alignment of malaria parasite upon invasion
S. Hillringhaus, G. Gompper, D. A. Fedosov

ABSTRACT Invasion of erythrocytes by merozoites is an essential step for the survival and progression of malaria parasites.
In order to invade red blood cells (RBCs), parasites have to adhere with their apex to the RBC membrane. Since a random
adhesion contact between the parasite and membrane would be too inefficient, it has been hypothesized that merozoites are
able to actively re-orient toward apex-membrane alignment. This is supported by several experimental observations which show
that merozoites frequently induce considerable membrane deformations before the invasion process. Even though a positive
correlation between RBC membrane deformation and successful invasion is established, the role of RBC mechanics and its
deformation in the alignment process remains elusive. Using a mechanically realistic model of a deformable RBC, we investigate
numerically the importance of RBC deformability for merozoite alignment. Adhesion between the parasite and RBC membrane
is modeled by an attractive potential which might be inhomogeneous, mimicking possible adhesion gradients at the surface
of a parasite. Our results show that RBC membrane deformations are crucial for successful merozoite alignment, and require
strengths comparable to adhesion forces measured experimentally. Adhesion gradients along the parasite body further improve
its alignment. Finally, an increased membrane rigidity is found to result in poor merozoite alignment, which can be a possible
reason for the reduction in the invasion of RBCs in several blood diseases associated with membrane stiffening.

STATEMENT OF SIGNIFICANCE                                                 INTRODUCTION
Plasmodium parasites invade erythrocytes during the pro-                  Malaria remains one of the most devastating diseases in the
gression of malaria. To start invasion, the parasites have to             world, especially in African and South Asian regions, claiming
re-orient themselves such that their apex establishes a direct            over 400 000 lives per year (1). This motivates significant
contact with erythrocyte membrane. The re-orientation (or                 research efforts directed toward understanding various aspects
alignment) process is often associated with strong membrane               and stages of malaria infection (2–4). Malaria is caused by
deformations, which are believed to be induced by the parasite            a unicellular parasite from the genus Plasmodium which is
and are positively correlated with its alignment. We employ               transmitted to humans through a mosquito bite. Five different
a mechanically realistic erythrocyte model to investigate the             types of malaria parasites are known to infect humans. Among
interplay of membrane deformations and merozoite alignment                them, Plasmodium falciparum causes most severe cases of
during parasite adhesion to an erythrocyte. Our model clearly             the infection. During the blood stage of malaria, merozoites
demonstrates that erythrocyte membrane deformations are a                 invade red blood cells (RBCs) and asexually reproduce inside
key component of successful parasite alignment, since the                 them. The invasion of RBCs by merozoites is a critical step in
re-orientation of parasites at rigidified membranes is generally          their survival (3–5), since inside RBCs the parasites remain
poor. Therefore, our results suggest a possible mechanism for             invisible to the host’s immune system. As a result, this step in
the reduction in erythrocyte invasion in several blood diseases           malaria has attracted considerable scientific interest, because
associated with membrane stiffening.                                      it can reveal potential targets for antimalarial drugs (3).
                                                                               Merozoites possess an egg-like shape with an average
                                                                          diameter of about 1 µm (6). Their apex contains all required
                                                                          machinery to invade RBCs (7). However, in order to start
                                                                          the invasion process, parasites have to establish first a direct
                                                                          contact between their apex and RBC membrane (5, 7). For
                                                                          this purpose, merozoites have a surface coat with a number of
                                                                          embedded proteins which can bind to RBC membrane (7–9).
                                                                          The first contact between the merozoite and RBC can be
                                                                          considered to occur with a random orientation. However, such
                                                                          random parasite adhesion is unreliable for the establishment
                                                                          of the direct apex-RBC contact, because after about three
                                                                          minutes, parasites become non-viable and are not able to
                                                                          invade RBCs anymore (10). Therefore, it is hypothesized that

                                                                                                    Manuscript submitted to Biophysical Journal   1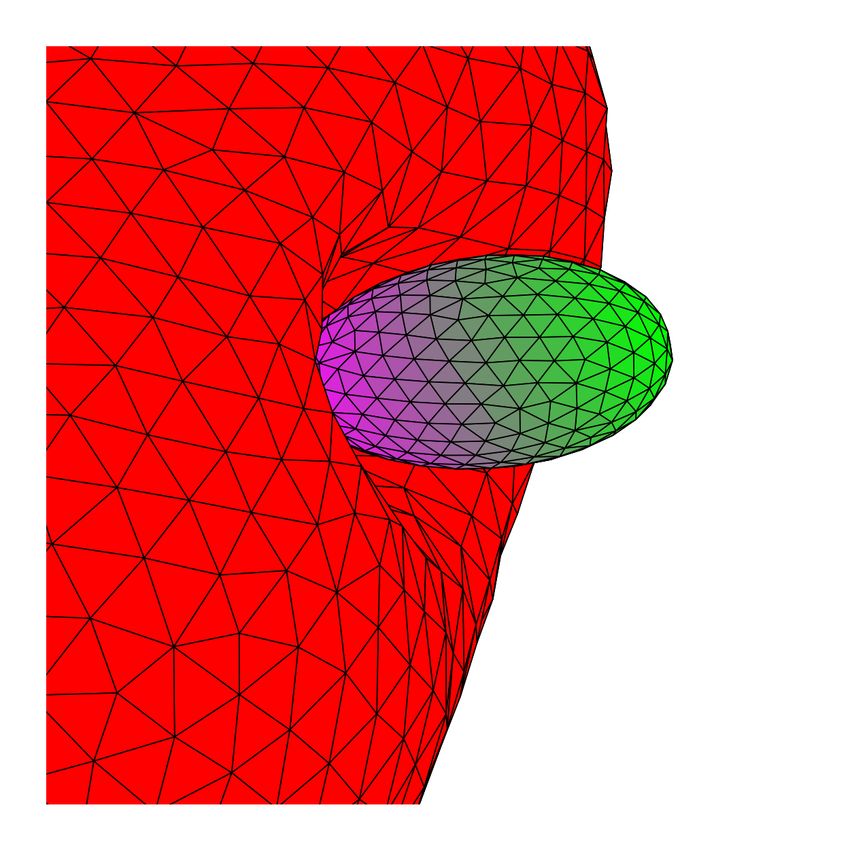
bioRxiv preprint first posted online Apr. 17, 2019; doi: http://dx.doi.org/10.1101/611269. The copyright holder for this preprint
(which was not peer-reviewed) is the author/funder, who has granted bioRxiv a license to display the preprint in perpetuity.
                                  It is made available under a CC-BY 4.0 International license.

 Hillringhaus et al.

 merozoites are able to actively align their apex toward the                 such gradients facilitate better alignment. However, strong
 RBC membrane (11). This alignment or pre-invasion stage                     adhesion gradients lead to a well-controlled, directed and fast
 occurs within the range of 2 s to 50 s (11–13), which is fast               re-orientation of the parasite with a nearly perfect alignment,
 enough to proceed to RBC invasion afterwards.                               while in experiments (18), parasite re-orientation is more
      Even though the alignment process has been observed in                 erratic and slow. This result suggests that merozoites should
 a number of experiments (12–15), the mechanisms that lead                   not have strong adhesion gradients at their surface. Finally, the
 to a successful parasite alignment are still under discussion.              quality of the presented adhesion model to explain merozoite
 One proposition is that the parasite re-orientation is guided by            alignment is discussed.
 a gradient of adhesive agonists along the parasite’s body, such
 that their density increases toward the apex (6). This propo-               METHODS & MODELS
 sition is based on some evidence for the release of adhesive
 agonists from the parasite’s apex during invasion (3, 16, 17).              To investigate adhesion interactions between a RBC and a
 An interesting feature which is frequently observed in the                  parasite, we employ models of cells with membranes having
 pre-invasion stage is RBC membrane deformations of various                  bending and stretching elasticity, which are embedded into a
 intensity (12–15). In fact, a recent experimental study (18) has            fluid represented by the dissipative particle dynamics (DPD)
 suggested that a positive correlation between the magnitude of              method (22, 23).
 membrane deformations and the efficiency of RBC invasion
 exists. Interestingly, such membrane deformations subside                   Red blood cell and parasite models
 right after the alignment is achieved and the merozoite starts              The RBC membrane is described by a triangulated network
 initiating cell invasion. This suggests that the parasite may               model with Nrbc vertices that are distributed at the membrane
 actively trigger membrane deformation in order to facilitate                surface of the cell. These vertices are connected by NS springs
 alignment. It has been hypothesized that the parasite may                   and form NT triangles. Mechanical properties of the RBC are
 mediate RBC membrane properties by changing local con-                      described by the potential energy
 centration of calcium (Ca2+ ) ions (11, 19). However, recent
 experiments (20) provide evidence against this hypothesis,                                     Erbc = Ebend + Esp + Earea + Evol .                (1)
 because RBC deformations are also observed in the absence
 of Ca2+ and calcium release by the parasite starts only at the              Here, the term Ebend represents the bending resistance of the
 invasion stage.                                                             lipid bilayer with a bending rigidity κ. Esp models the elasticity
      At present, several questions regarding possible mech-                 of the spectrin network that is attached to the cytoplasmic side
 anisms for the parasite alignment remain unanswered. Do                     of the RBC membrane. Lastly, Earea and Evol constrain the
 parasites actively induce RBC membrane deformations or                      area and volume of RBC membrane, mimicking incompress-
 do they result from passive parasite adhesion? Is an adhe-                  ibility of the lipid bilayer and cell’s cytosol, respectively. The
 sion gradient along the parasite’s body required for successful             elasticity of a RBC is characterized by a Young’s modulus
 alignment? How do membrane deformations aid parasite align-                 Y and a shear modulus µ. This model has been verified to
 ment? Are they necessary for a proper alignment? In order to                properly reproduce RBC mechanics (24, 25) and membrane
 address these questions, we perform simulations of parasite                 fluctuations (26).
 adhesion to a RBC membrane (21). In particular, we focus                         Similar to the RBC, the parasite is modeled by Npara
 on the so-called passive compliance hypothesis (20) which                   vertices distributed on its surface, see Fig. 1 A. The egg-like
 assumes that observed membrane deformations simply result                   shape and the size of a merozoite are approximated by (6)
 from the parasite adhesion to the RBC. Parasite-membrane                                               2
 adhesion is modeled by an attractive potential, whose local

                                                                                      rx2 + ry2 + rz2        = Ra rx3 + (Ra − Rb )rx ry2 + rz2 ,   (2)
 strengths are adapted to represent different adhesion inten-
 sities and gradients. Our results show that the parasite-RBC                where Ra = 1 µm and Rb = 0.7 µm. The parasite is much less
 adhesion interactions produce membrane deformations of var-                 deformable than the RBC, as no deformations of parasite body
 ious intensity. Both the required interaction strength (10) and             are visible from different experimental observations (10, 18).
 the deformation intensity match experimental observations                   Therefore, it is considered to be a rigid body, whose dynamics
 (12–15, 18). In further agreement with experiments (18), we                 can be described by one equation for force and one equation
 find that membrane deformations significantly aid parasite                  for torque, which act on the parasite’s center of mass (27).
 alignment, since the parasite becomes partially wrapped by
 the RBC membrane, making a contact between the apex
 and RBC much more likely. Furthermore, simulations of                       RBC-parasite adhesion interaction
 parasite adhesion to a rigidified RBC show poor parasite                    The parasite and the RBC membrane interact through a
 alignment, indicating that RBC deformation is a key aspect                  Lennard-Jones (LJ) potential, which includes both repulsive
 for the successful alignment of a merozoite. Simulations with               and attractive parts. The pairwise interaction energy between
 an adhesion gradient along the parasite’s body confirm that                 one membrane vertex at rrbc and one parasite vertex at rpara

 2 Manuscript submitted to Biophysical Journal
bioRxiv preprint first posted online Apr. 17, 2019; doi: http://dx.doi.org/10.1101/611269. The copyright holder for this preprint
(which was not peer-reviewed) is the author/funder, who has granted bioRxiv a license to display the preprint in perpetuity.
It is made available under a CC-BY 4.0 International license.
Alignment of malaria parasite
(A) (B) (C)
Figure 1: Parasite model and its adhesion interaction with RBC membrane. (A) The parasite is modeled by Npara vertices that
form an egg-like shape given by Eq. 2. Motion of the parasite is modeled by rigid body dynamics. (B) The interaction for
each parasite vertex depends on its relative position with respect to the parasite head (or apex), described by the dot product
n · rpara − rm in Eq. 5. Here, 2n is a directional vector from the parasite back (rx /Ra = 1) to the head (rx /Ra = 0). (C)
Function ξ describing a position-dependent density of adhesive proteins for various exponents a. ξ rpara in Eq. 5 is chosen in
such way that the interaction for a = 1 increases linearly along the parasite’s directional vector. Higher powers of a lead to
interactions which are strongly localized around the parasite head.
separated by the distance r = rpara − rrbc is given by in n-direction. Clearly, the exponent a can significantly shift
the density of agonists toward the apex, as shown in Fig. 1 C.
σ 12 σ 6
U r, rpara = 4 rpara
− , r ≤ rcut , In the discrete representation of the parasite in Fig. 1
r r A, each vertex corresponds to a small area Ac containing
(3) Ac ρ rpara agonists. Under the assumption that the interaction
strength for each agonist is 1 , we can define rpara as
where σ is the characteristic length of repulsive interaction
a a
and rcut is the cutoff radius for the√adhesion potential. The rpara = Ac ρa 1 ξ rpara + 0 = a ξ rpara + 0 ,
6
potential is repulsive below rtrans = 2σ and attractive above. (6)
Note that the interaction strength rpara may depend on
a position rpara at the parasite surface. The total interaction where 0 represents an additional position-independent inter-
energy is obtained by summing over all RBC-parasite vertex action between the RBC membrane and the parasite. In all
pairs. simulations, 0 is set to zero.
The dependence of rpara allows the control of interac-
tions between the RBC membrane and parasite locally. For Hydrodynamic Interactions
example, interaction gradients at the parasite surface can be
The RBC and parasite are embedded in a Newtonian fluid,
introduced. To represent a gradient in adhesive agonists at the
which is modeled by a particle-based hydrodynamics method,
surface of the parasite, we define the surface density by
dissipative particle dynamics (DPD) (22, 23). In short, the
ρ rpara = ρa ξ rpara
a
, (4) fluid environment is represented by a collection of fluid
particles, which interact through three pairwise forces. Thus,
where ρa is the density coefficient and a is an exponent. The the total force between particles i and j is given by
function ξ rpara defines the distribution of agonists with
Fi j = FC
i j + Fi j + Fi j ,
D R
(7)
respect to the position rpara at the parasite surface and is given
by
where FC i j , Fi j , and Fi j are conservative, dissipative, and ran-
D R
n · rpara − rm
1 dom forces, respectively. The conservative force determines
ξ rpara = + , (5) static pressure in the fluid and controls its compressibility. FD
2n · n 2
governs fluid viscosity η, which depends on several simulation
where rm marks the mid point of the cylindrical symmetric axis. parameters and is evaluated using a reverse-Poiseuille flow
The vector n is the directional vector of the parasite, pointing setup (28, 29). Finally, FR describes thermal fluctuations,
from rm towards its apex, see Fig. 1 B. For a = 1, the surface such that the pair of dissipative and random forces serves as
density of agonists decreases linearly with increasing distance a thermostat, maintaining a desired equilibrium temperature.
Manuscript submitted to Biophysical Journal 3bioRxiv preprint first posted online Apr. 17, 2019; doi: http://dx.doi.org/10.1101/611269. The copyright holder for this preprint
(which was not peer-reviewed) is the author/funder, who has granted bioRxiv a license to display the preprint in perpetuity.
It is made available under a CC-BY 4.0 International license.
Hillringhaus et al.
No-slip boundary conditions at the surface of the parasite and defined by an effective RBC diameter D0 = A0 /π, where
p
RBC membrane are enforced by an appropriate choice of the A0 is the RBC membrane area. The basic energy scale is k B T,
dissipative interaction between fluid particles and suspended where k B is the Boltzmann constant and T is temperature.
cells (24). Finally, the time scale τ corresponds to a RBC relaxation
time defined as τ = ηD03 /κ. For average properties of a
Parameter Simulation value Physical value healthy RBC with D0 = 6.5 µm and κ = 3 × 10⁻¹⁹ J and for
the fluid viscosity η = 1 mPa s, we obtain τ ≈ 0.92 s. All
A0 133.5 133.5 × 10⁻¹² m2 simulations were performed on the supercomputer JURECA
D0 6.5 6.5 × 10⁻⁶ m (30) at Forschungszentrum Jülich. To obtain reliable averages
of quantities of interest, all presented data points are averaged
k BT 0.01 4.282 × 10⁻²¹ J over about 10 statistically independent simulations.
τ 725.8 0.92 s
η 70 kB Tτ/D30 1 × 10⁻³ Pa s RESULTS
κ 70 kB T 3.0 × 10⁻¹⁹ J Adhesion-induced membrane deformations
As a result of adhesion interactions between the parasite and
Y 1.82 × 105 kB T/D20 1.89 × 10⁻⁵ N m−1
RBC, the membrane can strongly deform (see Fig. 2 and
Npara 310 Movies S1-S2), depending on the interaction strength. RBC
deformation is quantified by the deformation energy ∆Erbc
Nrbc 3000 defined as
σ 0.15 0.15 µm deform equil
∆Erbc = Erbc − Erbc , (8)
rcut 0.4 0.4 µm
equil
where Erbc is the membrane energy for a biconcave RBC
shape in equilibrium. Figure 3 presents membrane deforma-
Table 1: Overview of main parameters in simulation p and tion energy as a function of the interaction strength a for
physical units. The effective RBC diameter D0 = A0 /π
different exponents a. The deformation energy increases with
with A0 being the membrane area, the thermal energy kBT,
increasing a and strong deformations are induced by a partial
and the characteristic RBC relaxation time τ = ηD03 /κ are
wrapping of the parasite by the membrane in order to maxi-
selected as length, energy, and time scales. κ is the membrane
mize the area of contact. Note that the adhesion between the
bending rigidity, Y is the Young’s modulus, and η is the fluid’s
parasite and RBC membrane results in a stable configuration
dynamic viscosity. The number of vertices for the parasite
after a very fast re-orientation, which does not change over
Npara and RBC Nrbc are kept same in all simulations. σ and
time. The deformation energies are computed after this sta-
rcut are parameters of the LJ potential. The RBC properties
tionary configuration is reached. The data in Fig. 3 are for side
correspond to average characteristics of a healthy RBC.
contact. The results for top contact have a very similar depen-
dence on a and deviate by maximum 10 % from the values in
Fig. 3. This is also consistent with the visual observations of
RBC deformation in Fig. 2, showing membrane deformations
of a similar degree for the both cases of RBC-parasite contact.
Simulation setup To characterize RBC deformations, a discrete deformation
The simulation setup consists of one RBC and a parasite index Id was introduced in experiments (18). This index
suspended in a fluid. The simulated domain assumes periodic divides membrane deformations into four categories and is
boundary conditions in all directions. The parasite is initially assigned based on the visual inspection of RBC deformations.
placed within the interaction range of the RBC, so that it can These categories are summarized in Table 2. In addition, we
immediately adhere to the membrane. The initial orientation also associate the deformation indices with different ranges of
of the parasite is chosen such that the apex of the parasite deformation energy (see Table 2), using our simulation results.
is pointing away from the membrane, i.e. with its back to The RBC-parasite configurations in Fig. 2 are representative
the RBC, the most unfavorable orientation for binding. Two examples of different index categories.
different positions are investigated, parasite adhesion at the ∆Erbc represents a deformation energy where all contri-
rim (or side) and at the highest point of the RBC membrane butions are lumped together. Figure 4 shows different con-
(see Fig. 2). For convenience, RBC center of mass is fixed by tributions to ∆Erbc for the case of a = 0 as a function of
a harmonic spring, so that the cell does not diffuse away. the interaction strength a . The main contributions to the
Table 1 summarizes the main simulation parameters. To deformation energy correspond to bending elasticity of the
relate parameters in simulation and physical units, we define lipid bilayer and shear elasticity of the spectrin network. Con-
basic length, energy, and time scales. The length scale is tributions from the area- and volume-conservation constraints
4 Manuscript submitted to Biophysical JournalbioRxiv preprint first posted online Apr. 17, 2019; doi: http://dx.doi.org/10.1101/611269. The copyright holder for this preprint
(which was not peer-reviewed) is the author/funder, who has granted bioRxiv a license to display the preprint in perpetuity.
It is made available under a CC-BY 4.0 International license.
Alignment of malaria parasite
3000 a = 0
Deformation Index Id
a = 1 3
a = 2
∆E/kBT
2000
a = 3
2
1000
1
0 0
0 5 10 15
a/kBT
Figure 3: Deformation energy Erbc and deformation index
Id as a function of the interaction strength a for different
exponents a. The shown values are for side contact between
the parasite and RBC membrane. The lines for top contact are
similar with a deviation up to 10 % from the shown results.
The dashed lines indicate ranges of assigned deformation
indices, see Table 2.
Id Visible deformations ∆Erbc /kBT
0 No visible deformations [0, 150)
1 Small and local deformations [150, 800)
2 Partial wrapping of the parasite, [800, 2000)
local deformations.
3 Wrapping of the parasite, RBC ≥ 2000
shape is globally deformed
Table 2: Definition of the deformation index Id , which is
determined by a visual inspection of RBC membrane defor-
mations (18). Connecting visual membrane deformations to
the computed deformation energy ∆Erbc allows us to define
deformation energy ranges, which describe well different
deformation indices.
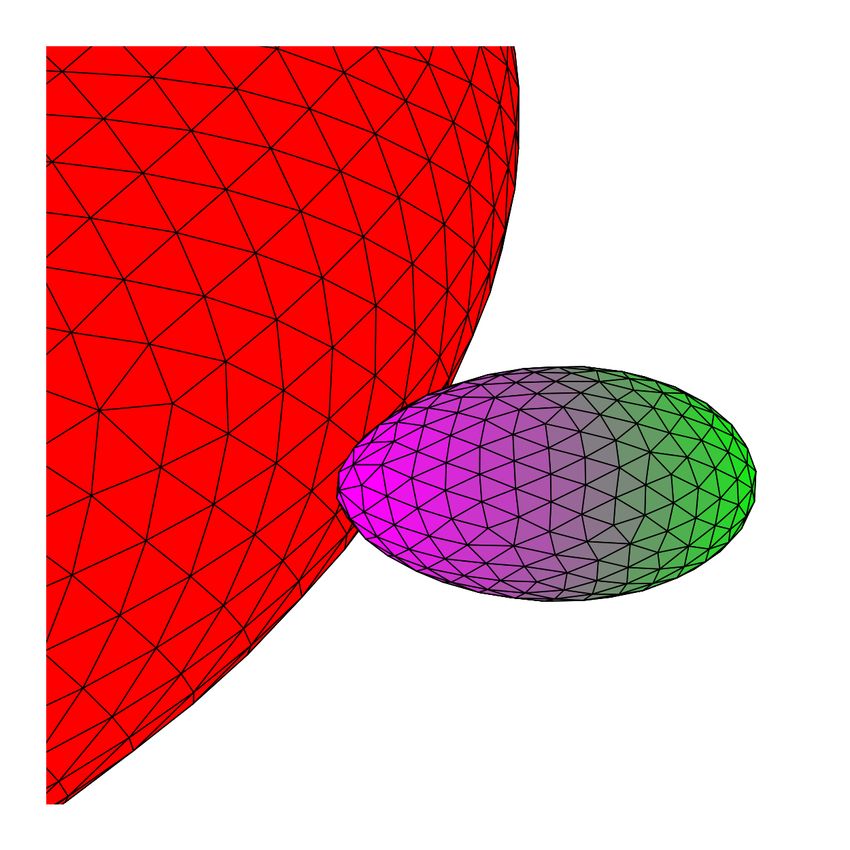
Figure 2: Snapshots of deformed RBCs due to parasite ad-
hesion, including side (left column) and top (right column)
contacts. Depending on the interaction strength the parasite
induces membrane deformations of various intensity. These ∆Ebend dominates over ∆Estretch . For large RBC deformations
deformations are classified visually by a deformation index with Id = 2 or 3, the stretching energy contribution ∆Estretch
Id (see Table 2) and quantified by the deformation energy becomes dominant, pointing to significant stretching of the
Erbc shown in Fig. 3. Due to the interaction strength and spectrin network. Note that for a > 0, the results for different
partial wrapping of the parasite by the membrane, the para- contributions to ∆Erbc are similar to the case a = 0.
site re-orients itself toward a configuration with a minimum
total energy and shows no significant motion afterwards, see Parasite adhesion force
Movies S1-S2. Here, a = 0 (homogeneous adhesion).
As shown above, strong enough adhesion interactions between
parasite and RBC lead to strong membrane deformations,
similar to experimental observations (18). Interaction strength
are very small and can be neglected. For small membrane of spent merozoites has been measured in experiments by
deformations (i.e. for Id = 1), the bending energy contribution attaching a merozoite to two RBCs with the parasite in the
Manuscript submitted to Biophysical Journal 5bioRxiv preprint first posted online Apr. 17, 2019; doi: http://dx.doi.org/10.1101/611269. The copyright holder for this preprint
(which was not peer-reviewed) is the author/funder, who has granted bioRxiv a license to display the preprint in perpetuity.
It is made available under a CC-BY 4.0 International license.
Hillringhaus et al.
∆Erbc
(A)
3000
Deformation Index Id
∆Ebend 3
∆Estretch
∆E/kBT
2000
2
1000
(B)
1
0 0
0 2 4 6 8 10
a/kBT
Figure 4: Different contributions to the deformation energy,
including bending elasticity of the lipid bilayer and shear elas-
ticity of the spectrin network, as a function of the interaction
strength a . Small membrane deformations primarily corre-
spond to membrane bending characterized by ∆Ebend , while
at large deformations, the contribution of stretching energy
∆Estretch dominates. Here, a = 0 (homogeneous adhesion). (C)
middle (10). This is possible because spent parasites have lost
their ability to invade RBCs, but still adhere to them. The
elongation of one RBC pulled away by optical tweezers is
used to quantify the force required for rupturing RBC-parasite
adhesion contact. Experimental detachment forces are in the
range of 10 pN to 40 pN (10).
We perform simulations mimicking these experiments
to quantify adhesion forces for different interaction models
and strengths. The corresponding simulation setup is shown
schematically in Fig. 5 A. A parasite is adhered with its
head (or apex) to a RBC that is pulled away with a constant Figure 5: (A) Schematic illustration of a simulation to de-
velocity v (see Movie S3). The second RBC in the experi- termine the detachment force Fad . A parasite, whose center
mental setup is replaced by a harmonic spring with a spring of mass is tethered by a harmonic spring, is adhered to a
constant k D02 /kBT = 211 250 ( 20 pN µm−1 ), which tethers RBC. The RBC is pulled away with a constant velocity v at
the parasite’s center of mass to its initial position. The pulling a rim position opposite to the parasite (see Movie S3). (B)
velocity is applied to a membrane rim position opposite to Fad is measured through the elongation ∆L of the harmonic
the parasite and is chosen such that the strain rate for RBC spring tethering the parasite, when it detaches from the RBC,
deformation remains close to γÛ = γ/τ = ∆D/(Dr τ) ∼ 0.11/τ i.e. the maximum measured force. Applied strain γ for RBC
( 0.1 s−1 ), where Dr is the diameter of a RBC at rest and deformation corresponds to a nearly constant strain rate of
∆D is the elongation of this diameter as a result of the applied γÛ ≈ 0.11. (C) Fad as a function of the interaction strength a
strain γ (see Fig. 5 B). Detachment force is then measured for different values of a. The adhesion force increases for all
as a maximum force Fad = k∆Lmax on the harmonic spring values of a with increasing the interaction strength.
tethering the parasite, as shown in Fig. 5 B. Here, ∆Lmax is the
spring elongation at the time when the connection between
the parasite and RBC ruptures.
Figure 5 C presents detachment forces as a function of parasite and RBC (see Fig. 1 C). The detachment forces from
the interaction strength a for different values of the exponent simulations in Fig. 5 C can be compared to experimentally
a. Fad increases non-linearly with increasing a , because measured forces (10), e.g. Fad D0 /kBT = 60×103 corresponds
larger interaction strengths lead to a stronger wrapping (i.e. to Fad 40 pN. Therefore, Fad in Fig. 1 C is smaller than 45 pN
a larger interaction area) of the parasite by RBC membrane. for all shown cases, so that the range of employed adhesion
The curve for a = 0 represents the steepest increase in Fad , strengths realistically represents interactions between the
as it corresponds to the strongest interaction between the parasite and the RBC membrane.
6 Manuscript submitted to Biophysical JournalbioRxiv preprint first posted online Apr. 17, 2019; doi: http://dx.doi.org/10.1101/611269. The copyright holder for this preprint
(which was not peer-reviewed) is the author/funder, who has granted bioRxiv a license to display the preprint in perpetuity.
It is made available under a CC-BY 4.0 International license.
Alignment of malaria parasite
(A)
ni
2n
θ
d
(B)
Figure 6: A sketch illustrating the measurement of a head
distance dhead and alignment angle θ. dhead is calculated as the
distance between the parasite head and the closest membrane
vertex (yellow color). θ is determined as the angle between
the directional vector n of the parasite and the normal of a
triangular face (green arrow) whose center is closest to the
parasite head. The alignment angle is calculated only if the
head of the parasite is within a certain interaction range with
the membrane, as indicated by the blue circle.
Figure 7: (A) Average head distance dhead and (B) average
alignment angle θ for different interaction strengths a and ex-
ponents a. The dashed line in plot (A) represents the minimum
Parasite alignment possible distance σ of the repulsive LJ interaction. An opti-
mal parasite alignment corresponds to small values of dhead
For a successful RBC invasion, the parasite needs to align its
and an alignment angle close to π. The both characteristics
apex (or head) toward cell membrane. Experiments indicate
show a positive correlation between the parasite alignment
that the parasite head has to be in close proximity to the mem-
and the interaction strength (or equivalently the level of RBC
brane surface and a successful invasion strongly correlates
deformation).
with a perpendicular alignment of the parasite toward RBC
membrane (5, 8). Therefore, we introduce the head distance
dhead and alignment angle θ, illustrated in Fig. 6, which allow
the quantification of parasite alignment required for RBC
invasion. dhead is defined as the distance between the para- LJ interaction. The alignment angle θ in Fig. 7 B increases with
site head rhead and a membrane vertex ri that minimizes the increasing interaction strength. Thus, both characteristics show
distance dhead = mini |rhead − ri |. θ is measured between the a positive correlation of parasite alignment with interaction
directional vector n of the parasite and the normal vector ni of strength a or equivalently with RBC deformation. This is
a triangular face whose center is closest to the parasite head, mainly due to the fact that a larger a value leads to a stronger
as sketched in Fig. 6. With these definitions, an optimal align- wrapping of the parasite by the RBC membrane, bringing the
ment is achieved for small values of dhead and an alignment parasite head closer to the membrane surface. In addition, an
angle θ ∼ π. Note, that this optimal value of θ may not be interaction gradient along the parasite’s body for a > 0 aids the
reached even for a perfect perpendicular alignment, since only alignment, since such gradients favor parasite adhesion with
the closest triangle is used to calculate θ and this triangle may an orientation of its head toward RBC membrane. The effect
not lie directly in front of the apex. Therefore, every angle of interaction gradient on the parasite alignment can be clearly
θ ≥ 0.8π is considered to correspond to good alignment. seen in Fig. 7, where both alignment properties are better for
Figure 7 shows the two alignment characteristics as a a > 0 in comparison to the case of a = 0. For instance, values
function of the interaction strength a for different exponents of θ for a = 0 in Fig. 7 B do not closely approach π even for
a. For all adhesion models, the values of dhead in Fig. 7 A large a values. Nevertheless, all models show good parasite
decrease with increasing a and closely approach the minimum alignment properties for interaction strengths a /k B T & 5,
possible distance represented by the repulsive range σ of the which correspond to small levels of membrane deformations
Manuscript submitted to Biophysical Journal 7bioRxiv preprint first posted online Apr. 17, 2019; doi: http://dx.doi.org/10.1101/611269. The copyright holder for this preprint
(which was not peer-reviewed) is the author/funder, who has granted bioRxiv a license to display the preprint in perpetuity.
It is made available under a CC-BY 4.0 International license.
Hillringhaus et al.
(Id ≥ 1), as shown in Fig. 3. ×103
a=0
50
0.10 a=1
a = 0
40
FadD0/kBT
a = 1
0.08
a = 2 30
talign /τ
0.06 a = 3
20
0.04 10
0.02 0
5 10 15 20
a/kBT
0 5 10 15
a/kBT
Figure 9: Adhesive force Fad of the parasite to a rigid RBC
Figure 8: Average alignment time as a function of the interac- for different interaction strengths a and values of a. Fad
tion strength a for different exponents of a. All models result for a rigid RBC grows slower with increasing a than that
in alignment times talign /τ
1. for a deformable RBC in Fig. 5 C, and has a nearly linear
dependence on the interaction strength, as for rigid cell the
adhesion area is independent of a .
Another important aspect of the parasite alignment is the
average time required for this process. Experimental observa-
tions indicate that parasite alignment generally occurs within dhead and θ remain nearly constant independently of a . This
a time range between a few seconds and one minute (18). Fig- means that the quality of parasite alignment is not influenced
ure 8 shows average alignment times for different interaction by the interaction strength and remains rather poor. This is due
strengths a and values of a measured in the simulations. The to the inability of the parasite to deform the RBC membrane,
alignment time corresponds to a time difference between the so that it positions itself sideways on the membrane (i.e. its
moments the parasite starts to interact with the membrane directional vector is nearly perpendicular to membrane normal
and when it reaches its stationary adhesion configuration. for a = 0, see Fig. 11, C), as this configuration represents a
The simulated alignment times in Fig. 8 are similar for all maximum adhesion energy. The case of a = 1 shows a better
interaction models and are generally much smaller than 1.1 τ alignment in comparison to a = 0, since interaction gradient
( 1 s). This means that the alignment times in simulations facilitates the re-orientation of parasite head toward the RBC
are about two orders of magnitude smaller than those found membrane. However, both interaction models for parasite
experimentally (18). adhesion to a rigid RBC yield worse alignment results than
those for deformable RBCs. This can be seen in Figure 11,
Rigid RBC membrane which shows conformations of the parasite adhered to rigid
and flexible membranes. For a = 1, the parasite has a good
To investigate the effect of membrane deformations on the alignment for both membrane rigidities, since the interaction
parasite alignment, simulations are performed with stiffened gradient (marked by color at the parasite surface) brings the
RBCs. Here, the bending rigidity and the Young’s modulus parasite’s head close to the membrane (see Figs. 11 B, D).
of RBC membrane are increased by two orders of magnitude For a = 0, the energetically favorable adhesion configuration
in comparison to a healthy cell, so that the membrane can is a sideways positioning of the parasite with θ ≈ 0.5π (see
be considered rigid. As a result, the parasite does not induce Figs. 11 A, C and Movies S4-S5), which represents poor align-
deformations for all studied interaction strengths. Figure 9 ment. However, in case of a deformable RBC, the parasite can
shows the adhesion force Fad as a function of a for a = 0 and become partially wrapped by the RBC membrane, making
a = 1. Fad has a linear dependence on the interaction strength the membrane-apex contact probable.
for both values of a. This is due to the fact that interaction
area between the parasite and RBC is independent of a and
remains constant, as the parasite cannot deform the RBC DISCUSSION AND CONCLUSIONS
membrane. The detachment force can still reach magnitudes Our simulation results support the passive compliance hy-
of up to 40 pN for large enough a values. Fad is also similar pothesis (20), which states that the alignment of merozoites
for both interaction models. arises from mechanical adhesion interactions between the
Figure 10 presents the head distance dhead and the align- parasite and RBC and induced membrane deformations. Here,
ment angle θ for a parasite adhering to a rigid RBC. Both both bending and stretching properties of the RBC membrane
8 Manuscript submitted to Biophysical JournalbioRxiv preprint first posted online Apr. 17, 2019; doi: http://dx.doi.org/10.1101/611269. The copyright holder for this preprint
(which was not peer-reviewed) is the author/funder, who has granted bioRxiv a license to display the preprint in perpetuity.
It is made available under a CC-BY 4.0 International license.
Alignment of malaria parasite
(A)
(A) (B)
(B)
(C) (D)
Figure 11: Comparison of parasite alignment at flexible RBCs
(A, B) and rigid RBCs (C, D) for a = 0 (A, C) and a = 1
(B, D), where the interaction gradient is marked by a color
code on the parasite surface (purple = maximal interaction
strength, green = minimal interaction strength). For flexible
Figure 10: Alignment characteristics given by (A) head dis- RBCs, the observed alignment is better than for the rigid
tance dhead and (B) alignment angle θ for the parasite interact- membrane, since the parasite can become partially wrapped
ing with a rigid RBC. Both characteristics are independent of by the flexible cell membrane (see Movies S4-S5). For a = 1,
the interaction strength a and generally show a poor parasite the alignment is good in both cases, since a configuration with
alignment. the parasite’s head toward the membrane minimizes the total
energy.
contribute to the resistance against parasite-induced deforma-
tions. For small local deformations, bending energy domi- interactions, which do not induce significant membrane defor-
nates, while strong membrane deformations lead to significant mations, an equilibrium adhesion configuration corresponds
stretching of the RBC spectrin network. More importantly, the to the parasite lying on its side due to the parasite’s egg-like
adhesion forces required for such deformations are within the geometry. This configuration makes a contact between the
range of experimentally measured forces 10 pN to 40 pN (10). parasite head and the membrane unlikely. Therefore, strong
The detachment force increases super-linearly with elevated membrane deformations serve as a hallmark of efficient para-
interaction strength, because the parasite becomes strongly site alignment followed by RBC invasion. This result compares
wrapped by RBC membrane, resulting in a significant increase favorably with recent experiments (18), where RBC defor-
of the interaction area. Thus, an increase in the interaction mations characterized by a deformation index were found to
strength quickly leads to a very stable parasite-membrane ad- correlate positively with the parasite invasion frequency.
hesion. Both, the level of deformations and the adhesion forces Furthermore, parasite models with an adhesion gradient
well reproduce experimentally observed behavior (10, 18). along the parasite body show that such gradients facilitate a
Analysis of parasite alignment characteristics such as the better alignment, as they introduce stronger adhesion inter-
head distance dhead and the alignment angle θ shows that actions toward the parasite’s head. Strong enough adhesion
stronger membrane deformations lead to a better parasite gradients result in a perfect parasite alignment, which is gen-
alignment for all considered interaction models. The primary erally not observed in experiments. In addition, the existence
reason for the good alignment due to strong parasite-RBC of adhesive gradients leads to very fast parasite alignment
interactions is that the parasite gets partially wrapped by RBC in a sub-second regime. The main reason for this quick re-
membrane, facilitating a contact between the membrane and orientation due to adhesion gradients is that they lead to a
the parasite head. For instance, in case of weak adhesion well-controlled, directed and fast motion of the parasite toward
Manuscript submitted to Biophysical Journal 9bioRxiv preprint first posted online Apr. 17, 2019; doi: http://dx.doi.org/10.1101/611269. The copyright holder for this preprint
(which was not peer-reviewed) is the author/funder, who has granted bioRxiv a license to display the preprint in perpetuity.
It is made available under a CC-BY 4.0 International license.
Hillringhaus et al.
perfect alignment by maximizing the interaction area. A com- AUTHOR CONTRIBUTIONS
parison with experimental observations in Ref. (18) shows S.H. performed simulations and analyzed the computational
that the alignment in our simulations is about two orders of results; G.G. and D.A.F. designed the research project; all
magnitude faster and that the real motion of the parasite at authors interpreted the results and wrote the manuscript.
RBC membrane is often much more erratic than the parasite
motion modeled with an interaction gradient. These results
suggest that there should not be strong permanent adhesion ACKNOWLEDGMENTS
gradients along the parasite body, since they lead to very fast We would like to thank Virgilio L. Lew and Pietro Cicuta
re-orientation times and suppress diffusive parasite behavior. from the University of Cambridge for insightful and fruitful
The importance of RBC membrane deformations for the discussions. S.H. acknowledges support by the International
parasite alignment is further emphasized by the simulations Helmholtz Research School of Biophysics and Soft Mat-
of parasite adhesion to rigid RBCs. These simulations show ter (IHRS BioSoft). D.A.F. acknowledges funding by the
that there is no correlation between the adhesion strength and Alexander von Humboldt Foundation. We also gratefully ac-
the quality of parasite alignment. Furthermore, the alignment knowledge the computing time granted through JARA-HPC
quality for the parasite interaction with a rigid RBC is quite on the supercomputer JURECA (30) at Forschungszentrum
poor in comparison to a deformable membrane. This is due Jülich.
to the fact that the minimum energy for parasite adhesion
to a rigid surface corresponds to a configuration, where the
REFERENCES
parasite lies on its side because of its egg-like shape. This ad-
hesion configuration is independent of the interaction strength 1. Organisation, W. H., 2018. World malaria report 2018.
and represents a poor alignment. Addition of the interaction https://www.who.int/malaria/publications/
gradient along the parasite’s body improves the parasite align- world-malaria-report-2018/en/.
ment on a rigid RBC, but does not make it perfect as in the
2. Miller, L. H., D. I. Baruch, K. Marsh, and O. K. Doumbo,
case for a deformable membrane. An increased rigidity of
2002. The pathogenic basis of malaria. Nature 415:673–
the RBC membrane is relevant for several blood diseases and
679.
disorders such as sickle-cell anemia (31), thalassemia (32),
and stomatocytosis (33). For example, the invasion efficiency 3. Cowman, A. F., D. Berry, and J. Baum, 2012. The cellular
of merozoites is reduced for sickle cell and thalassemic RBCs and molecular basis for malaria parasite invasion of the
(34). Our simulation study suggests that a poor parasite align- human red blood cell. J. Cell Biol. 198:961–971.
ment due to RBC membrane stiffening can contribute to the
reduction in the invasion of RBCs by merozoites. 4. White, N. J., S. Pukrittayakamee, T. T. Hien, M. A. Faiz,
Even though the parasite adhesion model with a fixed O. A. Mokuolu, and A. M. Dondorp, 2014. Malaria.
interaction potential reproduces certain aspects of the parasite Lancet 383:723–735.
alignment, it does not capture frequently-observed erratic
dynamics of a merozoite at a RBC membrane. The fixed inter- 5. Koch, M., and J. Baum, 2016. The mechanics of malaria
action potential leads to a stationary adhesion configuration, parasite invasion of the human erythrocyte - towards a
where the parasite does not exhibit significant motion. This reassessment of the host cell contribution. Cell. Microbiol.
model captures the behavior of spent or inactive parasites, but 18:319–329.
it fails to describe parasites which are still fit for RBC invasion
and show much more vivid dynamics. One possible reason for 6. Dasgupta, S., T. Auth, N. Gov, T. J. Satchwell, E. Hanssen,
this model behavior can be the activity of the parasite agonists. E. S. Zuccala, D. T. Riglar, A. M. Toye, T. Betz, J. Baum,
The fixed interaction potential mimics a situation where the and G. Gompper, 2014. Membrane-wrapping contribu-
density of adhesive agonists at the parasite surface is large tions to malaria parasite invasion of the human erythro-
enough to allow an averaged description. A more realistic cyte. Biophys. J. 107:43–54.
approach for the parasite adhesion would be an explicit rep-
7. Cowman, A. F., and B. S. Crabb, 2006. Invasion of red
resentation of the discrete nature of binding agonists, which
blood cells by malaria parasites. Cell 124:755–766.
can be modeled by the formation and dissociation of discrete
bonds between the parasite and the RBC membrane. Such a 8. Bannister, L. H., G. H. Mitchell, G. A. Butcher, E. D.
model is likely to lead to a more dynamic parasite adhesion to Dennis, and S. Cohen, 1986. Structure and development of
RBC membrane due to the stochasticity of discrete bindings, the surface coat of erythrocytic merozoites of Plasmodium
as the interaction depends on bond dynamics. Clearly, further knowlesi. Cell Tissue Res. 245:281–290.
investigation is needed to clarify the discrepancies in the adhe-
sion dynamics between model predictions and experimental 9. Gilson, P. R., T. Nebl, D. Vukcevic, R. L. Moritz,
observations and to establish a reliable mechanism for the T. Sargeant, T. P. Speed, L. Schofield, and B. S.
parasite alignment process. Crabb, 2006. Identification and stoichiometry of
10 Manuscript submitted to Biophysical JournalbioRxiv preprint first posted online Apr. 17, 2019; doi: http://dx.doi.org/10.1101/611269. The copyright holder for this preprint
(which was not peer-reviewed) is the author/funder, who has granted bioRxiv a license to display the preprint in perpetuity.
It is made available under a CC-BY 4.0 International license.
Alignment of malaria parasite
glycosylphosphatidylinositol-anchored membrane pro- 21. Fedosov, D. A., H. Noguchi, and G. Gompper, 2014.
teins of the human malaria parasite Plasmodium falci- Multiscale modeling of blood flow: from single cells to
parum. Mol. Cell. Proteomics 5:1286–1299. blood rheology. Biomech. Model. Mechanobiol. 13:239–
258.
10. Crick, A. J., M. Theron, T. Tiffert, V. L. Lew, P. Cicuta,
and J. C. Rayner, 2014. Quantitation of malaria parasite- 22. Hoogerbrugge, P. J., and J. M. V. A. Koelman, 1992.
erythrocyte cell-cell interactions using optical tweezers. Simulating microscopic hydrodynamic phenomena with
Biophys. J. 107:846–853. dissipative particle dynamics. Europhys. Lett. 19:155–
11. Lew, V. L., and T. Tiffert, 2007. Is invasion efficiency 160.
in malaria controlled by pre-invasion events? Trends
23. Español, P., and P. Warren, 1995. Statistical mechanics
Parasitol. 23:481–484.
of dissipative particle dynamics. Europhys. Lett. 30:191–
12. Dvorak, J. A., L. H. Miller, W. C. Whitehouse, and 196.
T. Shiroishi, 1975. Invasion of erythrocytes by malaria
merozoites. Science 187:748–750. 24. Fedosov, D. A., B. Caswell, and G. E. Karniadakis, 2010.
A multiscale red blood cell model with accurate mechan-
13. Gilson, P. R., and B. S. Crabb, 2009. Morphology and ics, rheology, and dynamics. Biophys. J. 98:2215–2225.
kinetics of the three distinct phases of red blood cell
invasion by Plasmodium falciparum merozoites. Int. J. 25. Fedosov, D. A., B. Caswell, and G. E. Karniadakis, 2010.
Parasitol. 39:91–96. Systematic coarse-graining of spectrin-level red blood
cell models. Comput. Meth. Appl. Mech. Eng. 199:1937–
14. Glushakova, S., D. Yin, T. Li, and J. Zimmerberg, 2005.
1948.
Membrane transformation during malaria parasite release
from human red blood cells. Curr. Biol. 15:1645–1650. 26. Turlier, H., D. A. Fedosov, B. A. Audoly, T. Auth, N. S.
15. Crick, A. J., T. Tiffert, S. M. Shah, J. Kotar, V. L. Lew, and Gov, C. Sykes, J.-F. Joanny, G. Gompper, and T. Betz,
P. Cicuta, 2013. An automated live imaging platform for 2016. Equilibrium physics breakdown reveals the active
studying merozoite egress-invasion in malaria cultures. nature of red blood cell membrane fluctuations. Nat. Phys.
Biophys. J. 104:997–1005. 12:513–519.
16. Mitchell, G. H., A. W. Thomas, G. Margos, A. R. 27. Heard, W. B., editor, 2006. Rigid body mechanics: mathe-
Dluzewski, and L. H. Bannister, 2004. Apical membrane matics, physics and applications. Wiley-VCH, Weinheim.
antigen 1, a major malaria vaccine candidate, mediates
the close attachment of invasive merozoites to host red 28. Backer, J. A., C. P. Lowe, H. C. J. Hoefsloot, and P. D.
blood cells. Infect. Immun. 72:154–158. Iedema, 2005. Poiseuille flow to measure the viscosity
of particle model fluids. J. Chem. Phys. 122:154503.
17. Singh, S., M. M. Alam, I. Pal-Bhowmick, J. A. Brzos-
towski, and C. E. Chitnis, 2010. Distinct external signals 29. Fedosov, D. A., G. E. Karniadakis, and B. Caswell, 2010.
trigger sequential release of apical organelles during ery- Steady shear rheometry of dissipative particle dynamics
throcyte invasion by malaria parasites. PLoS Pathog. models of polymer fluids in reverse Poiseuille flow. J.
6:e1000746. Chem. Phys. 132:144103.
18. Weiss, G. E., P. R. Gilson, T. Taechalertpaisarn, W.-H.
30. Jülich Supercomputing Centre, 2018. JURECA: Modular
Tham, N. W. M. de Jong, K. L. Harvey, F. J. I. Fowkes,
supercomputer at Jülich Supercomputing Centre. J. Large-
P. N. Barlow, J. C. Rayner, G. J. Wright, A. F. Cowman,
Scale Res. Facil. 4:A132.
and B. S. Crabb, 2015. Revealing the sequence and result-
ing cellular morphology of receptor-ligand interactions
31. Barabino, G. A., M. O. Platt, and D. K. Kaul, 2010. Sickle
during Plasmodium falciparum invasion of erythrocytes.
cell biomechanics. Annu. Rev. Biomed. Eng. 12:345–367.
PLoS Pathog. 11:e1004670.
19. N., M.-D., and A. A. Holder, 1992. The role of calcium 32. Peters, M., H. Heijboer, F. Smiers, and P. C. Giordano,
in the invasion of human erythrocytes by Plasmodium 2012. Diagnosis and management of thalassaemia. Brit.
falciparum. Mol. Biochem. Parasitol. 50:317–323. Med. J. 344:e228.
20. Introini, V., A. Crick, T. Tiffert, J. Kotar, Y.-C. Lin, 33. Caulier, A., R. Rapetti-Mauss, H. Guizouarn, V. Picard,
P. Cicuta, and V. L. Lew, 2018. Evidence against a L. Garcon, and C. Badens, 2018. Primary red cell hydra-
role of elevated intracellular Ca2+ during Plasmodium tion disorders: pathogenesis and diagnosis. Int. J. Lab.
falciparum preinvasion. Biophys. J. 114:1695–1706. Hematol. 40:68–73.
Manuscript submitted to Biophysical Journal 11bioRxiv preprint first posted online Apr. 17, 2019; doi: http://dx.doi.org/10.1101/611269. The copyright holder for this preprint
(which was not peer-reviewed) is the author/funder, who has granted bioRxiv a license to display the preprint in perpetuity.
It is made available under a CC-BY 4.0 International license.
Hillringhaus et al.
34. Tiffert, T., V. L. Lew, H. Ginsburg, M. Krugliak,
L. Croisille, and N. Mohandas, 2005. The hydration
state of human red blood cells and their susceptibility to
invasion by Plasmodium falciparum. Blood 105:4853–
4860.
12 Manuscript submitted to Biophysical JournalYou can also read