Improvement of the Interaction Model Aimed to Reduce the Negative Effects of Cybersickness in VR Rehab Applications - MDPI
←
→
Page content transcription
If your browser does not render page correctly, please read the page content below
sensors
Article
Improvement of the Interaction Model Aimed to Reduce the
Negative Effects of Cybersickness in VR Rehab Applications
Predrag Veličković * and Miloš Milovanović

                                            Faculty of Organisational Sciences, Jove Ilića 154, 11000 Belgrade, Serbia; milos.milovanovic@mmklab.org
                                            * Correspondence: velickovic.predrag@gmail.com; Tel.: +381-63-652256

                                            Abstract: Virtual reality (VR) has the potential to be applied in many fields, including medicine,
                                            education, scientific research. The e-health impact of VR on medical therapy for people cannot be
                                            ignored, but participants reported problems using them, as the capabilities and limitations of users
                                            can greatly affect the effectiveness and usability of the VR in rehabilitation. Previous studies of VR
                                            have focused on the development and use of the technology itself, and it is only in recent years that
                                            emphasis has been placed on usability problems that include the human factor. In this research,
                                            different ways of adapting interaction in VR were tested. One approach was focused on means of
                                            navigating through a VR, while the second dealt with the impact of the amount of animation and
                                            moving elements through a series of tests. In conclusion, the way of navigation and the amount of
                                            animation and moving elements, as well as their combination, are proven to have a great influence on
                                            the use of VR systems for rehabilitation. There is a possibility to reduce the occurrence of problems
                                            related to cybersickness if the results of this research are taken into consideration and applied from
                                            an early stage of designing VR rehabilitation applications.

                                            Keywords: virtual reality; cybersickness; HCI; rehabilitation


                                            1. Introduction
Citation: Veličković, P.; Milovanović,
                                                  Virtual reality (VR) technology has advanced in recent years and there is an increasing
M. Improvement of the Interaction
                                            number of areas in which it can be used. Sensory and assistive devices have long been
Model Aimed to Reduce the Negative
Effects of Cybersickness in VR Rehab
                                            developed to support patients in rehabilitation process [1]. One of the areas in which this
Applications. Sensors 2021, 21, 321.
                                            technology can have a great impact is rehabilitation therapy. VR has many features that give
https://doi.org/10.3390/s21020321           it a unique rehabilitation potential, both as an intervention and as an assessment. With the
                                            help of VR, people can practice skills that could carry too much risk in the real world [2].
Received: 11 November 2020                  In a simulator, they can safely engage in a range of activities that can be beneficial to their
Accepted: 17 December 2020                  health relatively free from the limitations [3]. Different studies suggest that VR therapy
Published: 6 January 2021                   had a positive impact on the therapeutic modality for people, as it indicates benefits in
                                            activity and participation, brain reorganization, motor skills or visual-spatial outcomes,
Publisher’s Note: MDPI stays neu-           and personal factors [4].
tral with regard to jurisdictional clai-          Virtual systems have great potential as a technology and can provide a safe learn-
ms in published maps and institutio-        ing experience, especially for the rehabilitation of people with different limitations [5].
nal affiliations.                           They allow various types of rehabilitation, as well as experimental and active learning
                                            that motivates and encourages patients. It also provides objective monitoring of behavior
                                            in a safe environment, while maintaining treatment control by monitoring stimuli and
Copyright: © 2021 by the authors. Li-
                                            measuring time parameters [6]. It has significant potential to improve rehabilitation of
censee MDPI, Basel, Switzerland.
                                            users. Applications are being developed that can improve the effects of rehabilitation,
This article is an open access article
                                            life skills, quality of life, mobility, and cognitive abilities, and also act as a motivator on
distributed under the terms and con-        participants [7].
ditions of the Creative Commons At-               It can be seen from the literature that VR therapy is useful as a treatment for the
tribution (CC BY) license (https://         rehabilitation of patients, and also can be a valuable addition to traditional programs [8].
creativecommons.org/licenses/by/            In terms of outcomes, the findings of various studies show that VR rehabilitation improved
4.0/).                                      skills, physical conditioning, and knowledge of individuals [9]. VR has credibility as a

Sensors 2021, 21, 321. https://doi.org/10.3390/s21020321                                                        https://www.mdpi.com/journal/sensors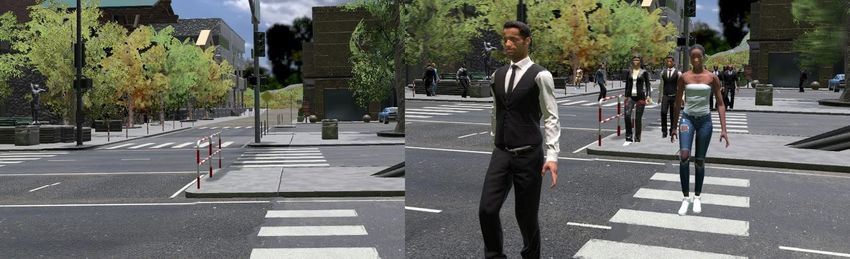
Sensors 2021, 21, 321                                                                                           2 of 19

                        useful tool to teach persons independent living skills in a safe environment, with important
                        repercussions on real life [10]. In rehabilitation therapy, a personal approach, where the
                        therapeutic regime is adapted to specific patients can increase the chance of recovery.
                        VR offers significant support for customizing patient experience. One of the potentials
                        is to maintain cognitive functions by providing recovery training in patients with brain
                        damage [11].
                              Even though VR technology has progressed over the past 20 years, users have reported
                        feeling negative symptoms, similar to motion sickness, after exposure to virtual visual
                        motion. The negative symptoms that VR users experience using the technology are known
                        as cybersickness, and may sometimes lead to discontinuation of VR use [12].
                              Harington et al. have developed a medical training simulator and during testing,
                        nausea was observed and noted during exposure to the VR due to uncoordinated visual
                        and vestibular sensory stimulation [13]. Aldaba et al., to reduce simulator sickness during
                        navigation through the VR, replaced the steering wheel with a modified wheelchair and
                        concluded that wheelchairs significantly reduced the simulator sickness in users, but the
                        need for a large space to maneuver and move through the virtual environment is a flaw of
                        this experiment [14]. Fernandes and Feiner investigated the effects of dynamic, but subtle,
                        changes in the user’s field of vision while in VR, the results showed that field of view
                        restrictors help users use it longer and feel more comfortable [15]. In his master’s thesis,
                        Tiiro tried to answer the question of whether higher visual realism causes more symptoms
                        of cybersickness than low realism, and the results showed that a higher level of realism
                        causes a higher degree of cybersickness than a lower level [16]. Kemeny et al. proposed a
                        new navigation technique to reduce the incidence of cybersickness symptoms in users and
                        found the appearance of stronger symptoms at faster rotations of the user’s visual field,
                        and weaker at slower rotations [17].
                              The goal of this paper is to examine the influence of user navigation and moving
                        elements and animations presented as dominant causes for the occurrence of cybersickness.
                        As the culprits are identified, the focus will be on the ways the user navigates through
                        VR and on the number of moving elements and animations. We will present a study
                        that was conducted on a group of participants in a specifically designed VR environment.
                        By changing and configuring different factors in the environment, the influence on the
                        development of symptoms of cybersickness will become measurable. Identification of these
                        factors can provide a valid input in the future design of virtual environments to reduce the
                        occurrence of cybersickness.

                        1.1. Virtual Reality and History of Cybersickness
                             The term cybersickness was coined by McCauley and Sharkey in 1992 to describe
                        the motion-sickness-like symptoms associated with VR characterized by “applications
                        involving distant objects, that include, terrain, self-motion (travel) through the environment
                        and the illusion of self-motion (vection) [18]. Cybersickness is a psychophysical response
                        to the exposure of perceptual illusions in a VR. Unwanted symptoms can be divided into
                        three categories: visual symptoms, disorientation, and nausea. Other symptoms that may
                        occur during or after exposure to the VR may include: general discomfort, abdominal
                        discomfort, belching, and sometimes vomiting, drowsiness, dizziness, headache, difficulty
                        concentrating, blurred vision, and tingling in the eyes [19]. Symptoms may occur during
                        exposure to a VR but may continue for some time after the end of the exposure.
                             Cybersickness is not a classical disease but is a psychological response of the human
                        organism to an unusual stimulus. It is a rather common occurrence for people exposed to
                        VR. Although different symptoms and their frequency have been documented, research
                        shows that oculomotor problems usually outweigh the human response to VR. The ca-
                        pabilities and limitations of users can significantly affect the effectiveness and usability
                        of the VR. Due to the impact of the VR on the experience of participants, the problems
                        that arise when using it need to be considered from the early stages of its design. For
                        example, the designers of a VR system should bear in mind that the human body is limited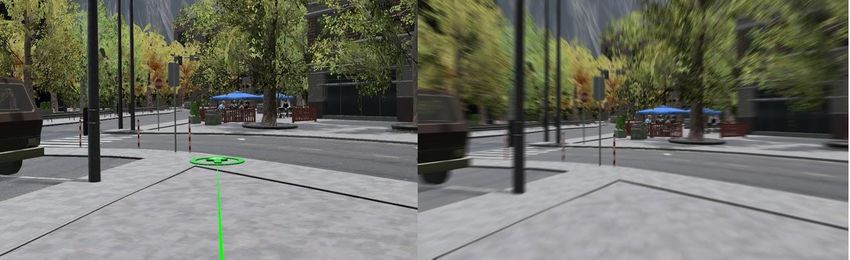
Sensors 2021, 21, 321                                                                                           3 of 19

                        by sensory, perceptual, and motor limitations. These factors influence the development of
                        certain symptoms and can be modified to reduce the negative effects on the user.
                              To specifically differentiate cybersickness as an occurring condition, we must clearly
                        define what constitutes VR. Electronic environment simulations experienced via a head-
                        mounted display that enables the end-user interaction in realistic three-dimensional situ-
                        ations is considered VR [20]. These simulations enable users to interact with an artificial
                        3D visual or another sensory environment by the use of computer simulation and model-
                        ing [21]. A VR system forms a stereo pair delivering a left- and right-eye image with the
                        use of an active stereo system in which there is no leakage of the left-eye image to the right
                        eye, and vice versa. The images are updated in real-time and generated in the graphics
                        pipeline of a computer system [22].
                              The problems that are related to the VR system nowadays are similar to the problems
                        that appeared at the very beginning of the mass use of passive transport, so it is necessary
                        to analyze this phenomenon as well. The development and increased use of ships once
                        pointed to the existence of seasickness problems. The oldest record of seasickness is
                        mentioned in Hippocrates’ Aphorisms [23]. from 2400 years ago. Similar symptoms were
                        later observed on land. Napoleon’s scouts in Egypt, who used camels as a means of
                        transportation, contracted motion sickness [24].
                              The development of computers has contributed to the possibility of creating simu-
                        lations in which the user is in an improvised cabin with screens instead of windows, so
                        these environments cause conflicts of the human sensorimotor system and cause certain
                        side effects. The use of such simulators has shown problems with symptoms very simi-
                        lar to motion sickness. This type of negative side effect is called simulator sickness [25].
                        Taking into account this discovery, it is clear that motion sickness is not only related to
                        movement but also occurs when creating the illusion of passive movement in a person.
                        Due to this conclusion, it is not surprising to learn that later VR systems create similar
                        problems and symptoms in users. This type of sickness, although it has similar symptoms
                        as the others listed, differs due to its appearance during a stay in cyberspace and is called
                        cybersickness [26].

                        1.2. Characteristics of Virtual Environments
                        1.2.1. Immersion
                             The more the system provides users with a display (in all sensory modalities) with
                        the credibility of tracking transferred from the real world, the more it is “immersed” [27].
                        Immersion in VR is the perception of physical presence in the nonphysical world [28].
                        The level of immersion in the VR depends on the system rendering software and display
                        technology (including all types of touch screens). Given that immersion is objective and
                        measurable, one system may have a higher level of immersion than another [29].

                        1.2.2. Presence
                             Presence is an abbreviated term derived from the word “telepresence”. It is a psy-
                        chological state or subjective perception in which part or all of an individual’s current
                        experience is generated and/or filtered by technology, but where part or all of an individ-
                        ual’s perception fails to accurately recognize the role of technology in that experience [30].
                        The sense of presence is defined as the subjective experience of being in one place or
                        environment, even when a person is physically in another [31]. The presence for that
                        reason requires that the participants identify with the virtual bodies, that they consider
                        their movements as their own, and that the virtual body is the real body of that person in
                        the virtual world [32].

                        1.2.3. Vection
                             When someone is in a stationary position, under certain conditions he can still get
                        the impression of self-movement. This deceptive impression of self-movement is called
                        vection [33]. It is generally accepted that large field of view screens covering peripheral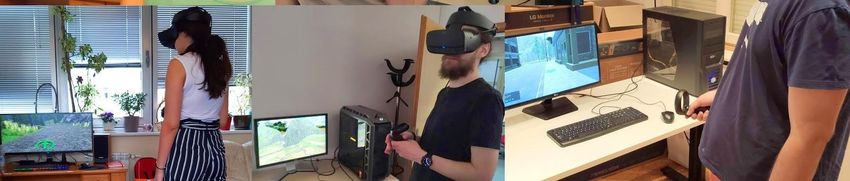
Sensors 2021, 21, 321                                                                                                 4 of 19

                        vision is most effective in creating a vection [34]. Vection is important for VR because
                        it enhances realism, presence, or the user experience [35]. Vection is a feeling of self-
                        movement caused by visual stimulation, so more vection creates more sensory conflict.
                        Conditions that increase vection also increase cybersickness [36].

                        1.3. Types of Negative Symptoms and Effects
                              Motion sickness, simulator sickness, and cybersickness have similar symptoms but
                        are caused by exposure to slightly different situations. Motion sickness is an uncomfortable
                        feeling, often accompanied by nausea, dizziness, and vomiting that can occur when people
                        travel in moving vehicles [37]. Although there are definite relationships between the
                        symptoms that occur in motion sickness, simulator sickness, and cybersickness, different
                        clusters of symptoms can be found that distinguish the three conditions, as identified in
                        Table 1 [38].

                        Table 1. Symptoms [38].

                                    Nausea                    Oculomotor Symptoms                   Disorientation
                                                                Tingling in the eyes
                              Stomach discomfort
                                                               Loss of concentration                  Dizziness
                              Increased salivation
                                                                   Blurred vision                   Loss of balance
                                    Burping
                                                                    A headache

                             The authors Kennedy et al. [25]. identified 27 symptoms experienced by users in a
                        series of factor analyses. Eliminating symptoms that had a low incidence rate, the authors
                        developed and validated a new Simulator Sickness Questionnaire (SSQ) containing 16
                        symptoms (Table 2).

                        Table 2. Kennedy classification of symptoms [25].

                                      General Discomfort                               Difficulty Concentrating
                                             Fatigue                                      Fullness of the Head
                                            Headache                                         Blurred vision
                                            Eye strain                                 Dizziness with eyes open
                                       Difficulty focusing                             Dizziness with eyes closed
                                      Salivation increasing                                     Vertigo
                                            Sweating                                      Stomach awareness
                                             Nausea                                             Burping

                        1.4. Cybersickness as Obstacle in Using VR for Rehabilitation of Patients
                             The VR community, during the past years, has based its development on a synthesis
                        of earlier work in interactive 3D graphics, visual simulation, and user interfaces [39].
                        How users interact with different systems has changed over time [40]. An increasing
                        number of people are accessing multimedia content daily using a variety of devices, such
                        as computers, televisions, and smartphones, and each of them can play virtual content [41].
                        Therefore, it is important to have a degree of knowledge about the current use of VR
                        technologies in the field and to explore the possible impacts such technologies have on
                        users [42]. Although this technology is experiencing rapid development and growing
                        interest, at the same time the observed negative symptoms and effects that occur in users
                        when interacting with the VR present a cause for concern. These problems can negatively
                        affect the use of virtual systems in the rehabilitation, as systems designed to provide
                        assistance and recovery can cause additional negative symptoms for users. Taking these
                        facts into account, cybersickness and its impact on users is one of the primary problems
                        that need to be solved for the sake of safely using virtual systems in rehabilitation processes.
                        The negative impact that the VR has on the experience of participants and problems that
                        may arise when using the VR system itself, should be considered from the earliest stages of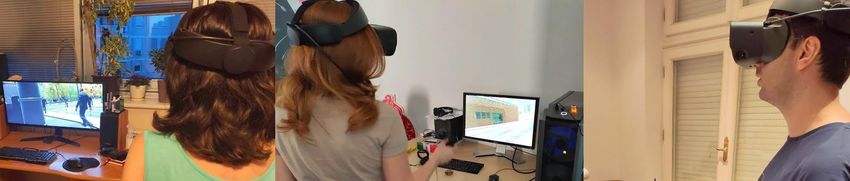
Sensors 2021, 21, 321 5 of 19
its design because user capabilities and limitations can significantly affect the effectiveness
and usability of the application.
2. The Process of Creating and Testing the Impact of a Virtual Environment on a User
2.1. Setting of Test Parameters
In this paper, we tested the influence of interaction between humans and computers
through navigation in VR, the amount of animation and moving elements in the envi-
ronment, and their overall impact on the occurrence of cybersickness. The aim was to
cross-reference and test two ways of movement with two types of animations and moving
elements in the environment to provide a clear insight into their impact while interacting
in a VR.
Users stood upright and had full 360 degrees of rotation freedom by physically
turning around their axis. This movement was tracked by five cameras located in an
Oculus head-mounted display. Oculus controllers were used for navigating through the
VR. Two common methods of navigation in VR were tested: natural locomotion and
teleporting [43].
Considering navigation methods (Figures 1 and 2), these are two types commonly
used to interact with a complex 3D environment and don’t require expensive technologies
and a large space for installing required equipment e.g., VR treadmill. Teleport navigation
is a way of navigation in which the user points the controller towards the place where he
wants to move and at the press of a button, he simply appears at that place. In addition
to real-life head rotation, users can rotate left or right by pushing the thumbstick in that
direction. Natural locomotion movement is a way of navigation control where the user
moves in virtual space by using the thumbstick on the Oculus touch controllers but rotates
Sensors 2021, 21, x FOR PEER REVIEW 6 of 21
by turning their head or whole body in physical space around them, simulating the real-life
movement. This allows them to move in any direction and to adjust the speed of movement
by the level of pressure they apply to the thumbstick.
(a) (b)
Figure 1. Environment navigation via teleport (a) and navigation via natural locomotion movement (b).
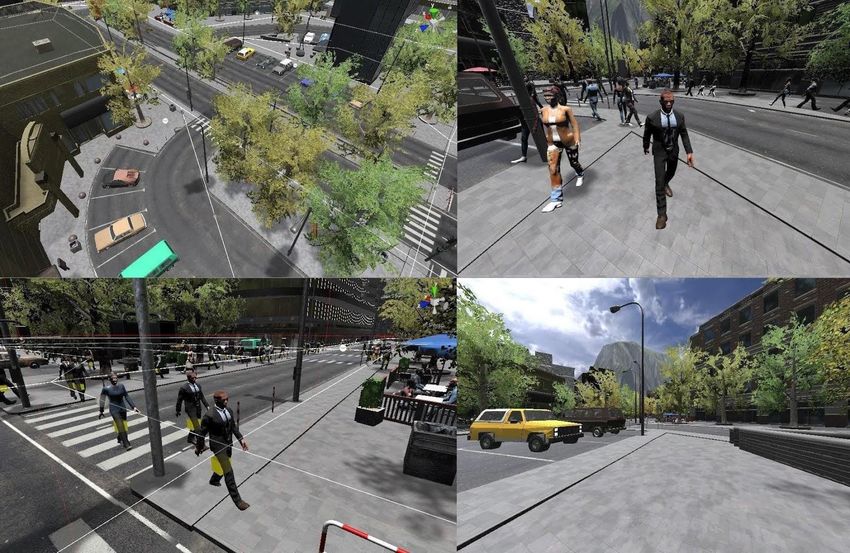
Two types of environments were also tested (Figure 3), one of which was static,
and had no animations and moving elements, while the other was rich in animations and
moving elements. In the first, static, environment, there was no movement of vegetation
in the environment which was caused by the intensification of the influence of the wind,
as well as passersby moving through the environment. The second environment, unlike
the first, had a strong movement of vegetation, due to the increased influence of the wind
and a large number of passersby moving through the environment. The trees were located
on the sidewalks all over the city as to be most of the time in the user’s field of view.
There were eight people per node, and nodes were set on each street junction, each in a
random direction and offset movement route.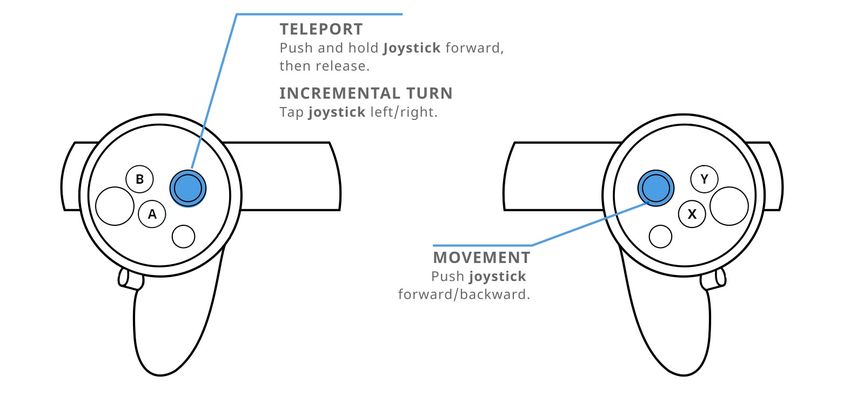
Sensors 2021, 21, 321                 (a)                                                    (b)                           6 of 19

                 Figure 1. Environment navigation via teleport (a) and navigation via natural locomotion movement (b).

Sensors 2021, 21, x FOR PEER REVIEW                                                                                        7 of 21
      Figure 2. Oculus thumbstick navigation commands via teleport (left) and navigation via natural locomotion movement
       Figure[44].
      (right)  2. Oculus thumbstick navigation commands via teleport (left) and navigation via natural locomotion movement
       (right) [44].

                                        Two types of environments were also tested (Figure 3), one of which was static, and
                                   had no animations and moving elements, while the other was rich in animations and mov-
                                   ing elements. In the first, static, environment, there was no movement of vegetation in the
                                   environment which was caused by the intensification of the influence of the wind, as well
                                   as passersby moving through the environment. The second environment, unlike the first,
                                   had a strong movement of vegetation, due to the increased influence of the wind and a
                                   large number of passersby moving through the environment. The trees were located on
                                   the sidewalks all over the city as to be most of the time in the user’s field of view. There
                                   were eight people per node, and nodes were set on each street junction, each in a random
                                   direction and offset movement route.

                                      (a)                                                   (b)
                Environmentwithout
      Figure 3. Environment withoutanimation
                                    animationand
                                              andmoving
                                                  movingelements
                                                          elements
                                                                 (a),(a), environment
                                                                       environment    with
                                                                                   with    animations
                                                                                        animations andand moving
                                                                                                       moving     elements
                                                                                                              elements (b).
      (b).
                                       In all four tests, (Figure 4) users had complete freedom of movement through the
                                       In all
                                  created  VRfour   tests, (Figure
                                               environment          4) users had
                                                               via controllers andcomplete  freedom
                                                                                   stated ways       of movement
                                                                                                of movement,        through
                                                                                                              while the       the
                                                                                                                        physical
                                  movement
                                  created  VR was   limited tovia
                                               environment      onecontrollers
                                                                     meter in circumference around
                                                                               and stated ways      the user. This
                                                                                                of movement,  whileenabled them
                                                                                                                    the physical
                                  to fully feelwas
                                  movement      the limited
                                                    impact that   changes
                                                             to one meter in circumference
                                                                              the environment  and the
                                                                                            around  thenavigation  have on them
                                                                                                        user. This enabled  their
                                  psychophysical    condition   and  the appearance  of cybersickness.
                                  to fully feel the impact that changes in the environment and the navigation have on their
                                  psychophysical condition and the appearance of cybersickness.

                                               Figure 4. Testing the virtual simulation.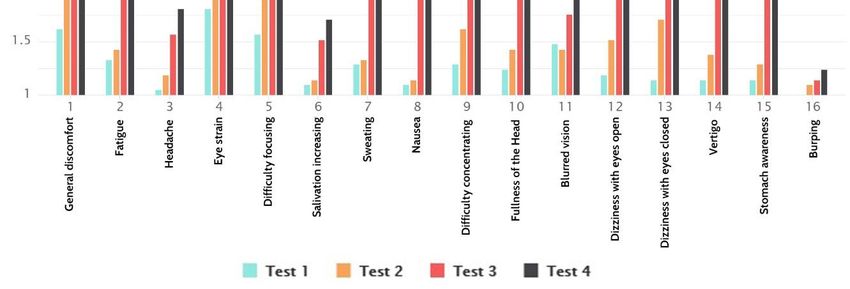
(b).

                             In all four tests, (Figure 4) users had complete freedom of movement through the
                        created VR environment via controllers and stated ways of movement, while the physical
Sensors 2021, 21, 321   movement was limited to one meter in circumference around the user. This enabled 7them
                                                                                                             of 19
                        to fully feel the impact that changes in the environment and the navigation have on their
                        psychophysical condition and the appearance of cybersickness.

                                     Figure
                                     Figure 4.
                                            4. Testing the virtual
                                               Testing the virtual simulation.
                                                                   simulation.

                        2.2. Testing and Collecting Results
                        2.2. Testing and Collecting Results
                              Fifty respondents participated in the research. Data were collected in a period of 44
                        days,Fifty
                               fromrespondents
                                      24 June to 6 participated
                                                     August 2020.inTwenty-one
                                                                      the research.   Data and
                                                                                   women    weretwenty-nine
                                                                                                 collected inmen
                                                                                                               a period   of
                                                                                                                   partici-
                        44  days,  from   24 June  to 6  August   2020.  Twenty-one    women   and  twenty-nine
                        pated in the survey, representing 58% of men and 42% of women. Ages ranged from 24 to    men   par-
                        ticipated
                        45  years. in
                                    In the
                                        thissurvey, representing
                                             way, the               58%
                                                        factor of the    of men and
                                                                       influence      42%
                                                                                  of age   of women.
                                                                                          was excluded,Ages  ranged from
                                                                                                         considering   that
                        24  to 45 years.   In this way,   the factor of the influence  of age was  excluded,  considering
                        children and persons older than 55 are less susceptible to the appearance of cybersickness
                        that children
                        [45]. Twenty-fourand years
                                              personswasolder  than 55 arefor
                                                           the minimum      less susceptible
                                                                              both  genders, to the appearance
                                                                                              while  the maximum  of for
                                                                                                                     cyber-
                                                                                                                         fe-
                        sickness   [45]. Twenty-four    years  was the  minimum    for both genders,  while the
                        male respondents was 43 years, which is two years less than for men, where the maximum  maximum
                        for female respondents was 43 years, which is two years less than for men, where the
                        number was 45 years. When it comes to experience and previous use of the VR system, 33
                        maximum number was 45 years. When it comes to experience and previous use of the VR
                        respondents had never used such a system before this testing, while 17 respondents had
                        system, 33 respondents had never used such a system before this testing, while 17 respon-
                        encountered it before, but as a single-use and not continuous long-term usage. In percent-
                        dents had encountered it before, but as a single-use and not continuous long-term usage.
                        ages, that constitutes 34% of respondents that have used some virtual system before, and
                        In percentages, that constitutes 34% of respondents that have used some virtual system
                        66% of respondents that have not.
                        before, and 66% of respondents that have not.
                              A representative sample of respondents was tested on each of the four environments
                        for four minutes, and, after each test, they filled out a questionnaire on negative symptoms
                        and effects on the human body caused by the different environmental characteristics and
                        user interactions. Users tested the virtual simulation while standing and had 360-degree
                        rotation freedom. They moved through the environment via the thumbstick, the right
                        thumbstick set for teleport navigation, and the left for natural locomotion movement.
                        Depending on the need of the test, users were allowed to use one of the two explained
                        movement modalities throughout the environment.
                              Users first tested the environment without animations and moving elements in the
                        environment, and moved via teleport. The second environment they tested was with strong
                        animations and many moving elements with the same movement modality. The third
                        test was in an environment without animation, but with natural locomotion movement.
                        The last test was with natural locomotion movement and with a lot of animations and
                        moving elements in the environment.
                              This test schedule was chosen because the first environment had the fewest elements
                        that could cause problems in use, so it was appropriate for users to get an impression of
                        the environment and how to evaluate it. Further on, each subsequent test environment
                        introduced more elements. One week was given between each test for rest. This approach
                        was chosen because the repetitive experience itself could lower the sensibility and make
                        the users adapt to the usage of VR resulting in the decrease of symptoms [24].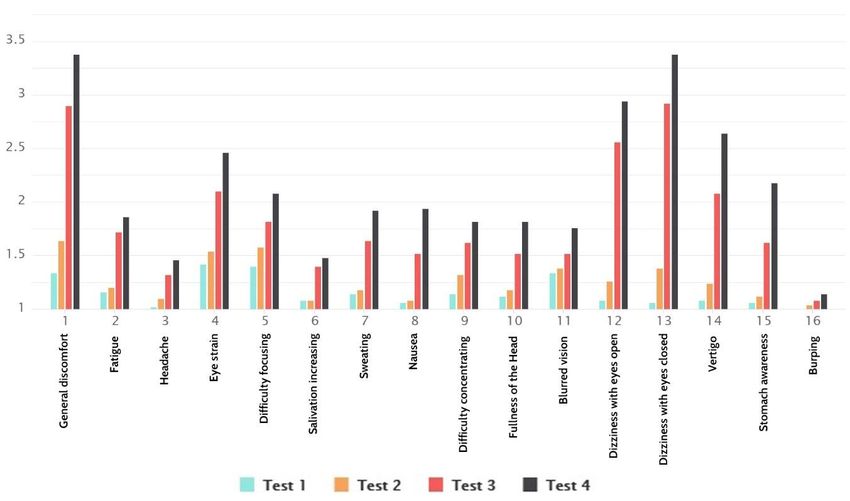
Sensors 2021, 21, 321                                                                                            8 of 19

                             The Simulator Sickness Questionnaire (SSQ) developed by Kennedy et al. in 1993 was
                        used to collect the data. The questionnaire contained 16 questions, all listed in Table 3,
                        and related to various symptoms that may have occurred during an interaction within a
                        VR. The mentioned 16 questions were divided into three groups of symptoms: nausea, ocu-
                        lomotor symptoms, and disorientation. A five-point Likert [46] scale was used to assess the
                        severity of symptoms.

                        Table 3. Overall results.

                                                              Test 1        Test 2        Test 3         Test 4
                                      Symptom
                                                             Mean (SD)     Mean (SD)     Mean (SD)      Mean (SD)
                            1. General discomfort            1.34 (0.52)   1.64 (0.60)   2.90 (0.91)     3.38 (1.18)
                            2. Fatigue                       1.16 (0.42)   1.20 (0.45)   1.72 (0.83)     1.86 (1.05)
                            3. Headache                      1.02 (0.14)   1.10 (0.36)   1.32 (0.84)     1.46 (0.86)
                            4. Eye strain                    1.42 (0.57)   1.54 (0.68)   2.10 (0.93)     2.46 (1.13)
                            5. Difficulty focusing           1.40 (0.53)   1.58 (0.64)   1.82 (0.98)     2.08 (0.93)
                            6. Salivation increasing         1.08 (0.27)   1.08 (0.34)   1.40 (0.76)     1.48 (0.93)
                            7. Sweating                      1.14 (0.49)   1.18 (0.44)   1.64 (0.96)     1.92 (1.31)
                            8. Nausea                        1.06 (0.31)   1.08 (0.34)   1.52 (0.84)     1.94 (1.11)
                            9. Difficulty concentrating      1.14 (0.40)   1.32 (0.55)   1.62 (0.85)     1.82 (0.92)
                            10. Fullness of the head         1.12 (0.38)   1.18 (0.48)   1.52 (0.76)     1.82(1.04)
                            11. Blurred vision               1.34 (0.74)   1.38 (0.75)   1.52 (0.86)     1.76 (1.08)
                            12. Dizziness with eyes open     1.08 (0.34)   1.26 (0.56)   2.56 (0.95)     2.94 (1.25)
                            13. Dizziness with eyes closed   1.06 (0.31)   1.38 (0.70)   2.92 (0.90)     3.38 (1.07)
                            14. Vertigo                      1.08 (0.34)   1.24 (0.51)   2.08 (1.00)     2.64 (1.21)
                            15. Stomach awareness            1.06 (0.31)   1.12 (0.38)   1.62 (0.83)     2.18 (1.08)
                            16. Burping                         1 (0)      1.04 (0.28)   1.08 (0.44)     1.14 (0.49)
                            The cumulative result            1.13 (0.12)   1.31 (0.25)   1.90 (0.60)     2.25 (0.78)

                        2.3. Creating Virtual Environment
                             In pursuit of finding key interaction elements that can cause cybersickness, the adaptive
                        VR environment had to be defined for this study. In that process, the decision was to use
                        several development applications to create the VR environment. The basis of the software
                        solution used for the study would be a VR environment created in the Unity 3D program.
                        Modeling of the environment and elements was done in the Blender program, and the GIMP
                        program was used to create the textures of the objects. The user interaction and the logic of
                        the environment were managed by scripts written in the C# programming language.
                             For this research, in addition to general scientific methods, the following procedures
                        were applied:
                        -      the modeling of the VR environment;
                        -      model testing and filling in questionnaires by users;
                        -      analytical-deductive and statistical methods.
                             Modeling, texturing, and animation were used to create a VR environment for testing
                        purposes (Figure 5). The VR environment was modeled in four ways with different
                        characteristics aiming to examine all parameters relevant to the subject of research. They
                        were also modeled to eliminate the factors that could have an impact on the onset of
                        symptoms not relevant to the study. The analytical-deductive method was used to analyze
                        the data obtained through the questionnaire.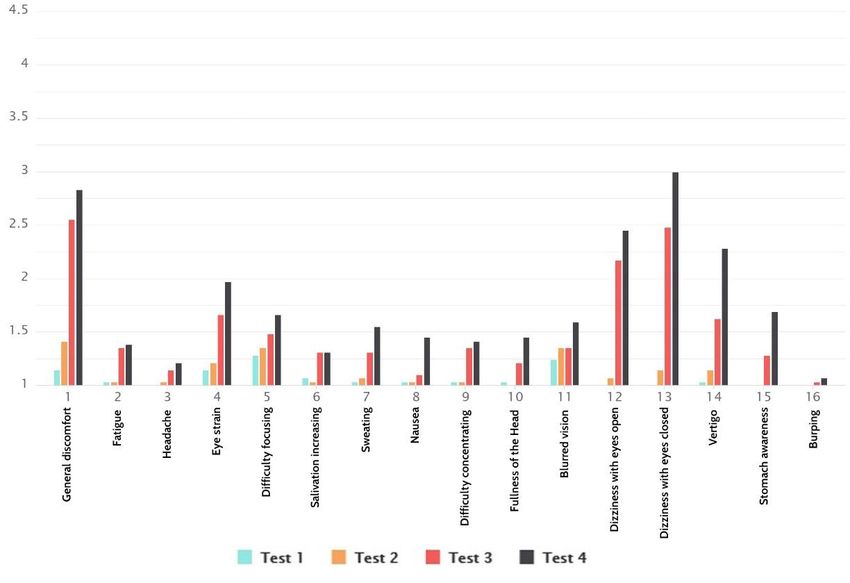
Sensors 2021, 21, x FOR PEER REVIEW                                                                                                10 of 21

Sensors 2021, 21, 321            also modeled to eliminate the factors that could have an impact on the onset of symptoms
                                                                                                                     9 of 19
                                 not relevant to the study. The analytical-deductive method was used to analyze the data
                                 obtained through the questionnaire.

                                              Figure
                                              Figure 5.
                                                     5. Virtual environment for
                                                        Virtual environment for testing.
                                                                                testing.

                                 3. Evaluation of the Obtained Results
                                 3. Evaluation of the Obtained Results
                                      In Table 3, we can see that the first test, without animations and with teleport as a
                                 way Inof Table   3, we can
                                           navigation,       see the
                                                        caused   thatleast
                                                                       the first test, without
                                                                            problems              animations
                                                                                        for all users.           and with
                                                                                                         The second    test,teleport  as a
                                                                                                                              which also
                                 way   of  navigation,  caused   the  least problems    for  all users.  The   second
                                 used teleport as a way of navigation, but had moving elements and animations in the   test,  which   also
                                 used teleport caused
                                 environment,      as a way  of navigation,
                                                          some   more problems.but had
                                                                                    The moving
                                                                                         third testelements
                                                                                                      shows a and    animations
                                                                                                                significant  jump inin the
                                                                                                                                       the
                                 environment,
                                 overall results. caused  some   more    problems.  The   third  test shows   a significant  jump   in the
                                 overall   results.
                                      Taking    into account that this was a test with natural locomotor movement, and with-
                                       Taking   into
                                 out animations and  account that this
                                                         moving         was a test
                                                                    elements,  wewith
                                                                                    can natural
                                                                                         conclude locomotor
                                                                                                      that thismovement,     and without
                                                                                                                 way of navigation      in-
                                 animations
                                 creases        and moving
                                           the problem.  The elements,    we canlocomotor
                                                              last test, natural   concludemovement
                                                                                               that this waywithofanimations
                                                                                                                   navigation and
                                                                                                                                increases
                                                                                                                                     mov-
                                 the problem. The last test, natural locomotor movement with animations and moving
                                 ing elements in the environment, caused the most problems for users when interacting in
                                 elements in the environment, caused the most problems for users when interacting in VR.
                                 VR.
                                       If the questions related only to nausea were singled out (Figure 6), we could see that
                                      If the questions related only to nausea were singled out (Figure 6), we could see that
                                 the results are in line with the total results, and lower than the total values. This means
                                 the results are in line with the total results, and lower than the total values. This means
                                 that fewer respondents felt a stronger presence of nauseating effects. General discomfort
                                 that fewer respondents felt a stronger presence of nauseating effects. General discomfort
                                 was a symptom with the highest value, and burping had the lowest reported value, while
                                 was a symptom with the highest value, and burping had the lowest reported value, while
                                 other symptoms had similar values.
                                 other symptoms had similar values.
                                       It stands out that the natural locomotion type of navigation had much higher values
                                      It stands out that the natural locomotion type of navigation had much higher values
                                 than teleport. We can also see that there was a difference in values regarding environment
                                 than teleport. We can also see that there was a difference in values regarding environment
                                 animation, where no animation environment had slightly lower values.
                                 animation, where no animation environment had slightly lower values.
                                       From the of oculomotor symptoms (Figure 7), we concluded that the first two tests
                                 had higher average scores than total results, but interestingly, at the same time, the other
                                 two tests had lower average values. We noticed that general discomfort had the highest
                                 reported values. The question regarding vision follow-up and headache had the lowest
                                 reported values. We perceived that there was a larger difference in symptom occurrence
                                 with types of navigation than environment animation and moving elements. Following,
                                 it was noted that difficulty focusing and blurred vision had the smallest difference between
                                 types of navigation and environment moving elements.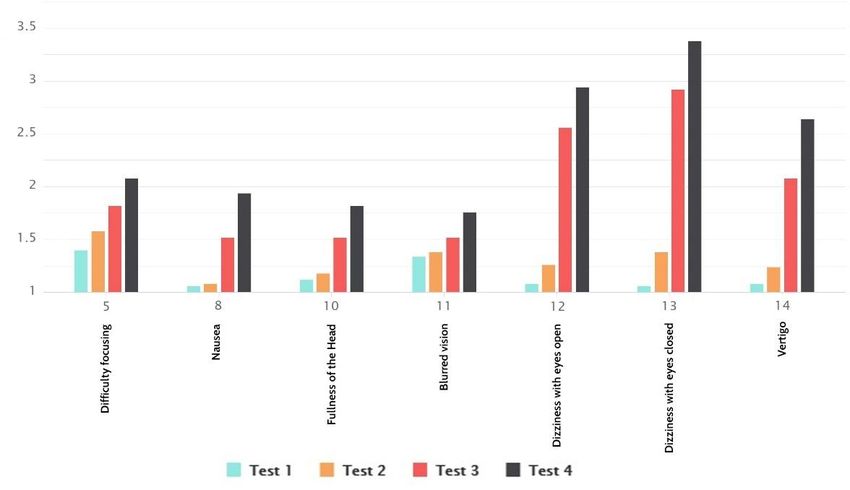
Sensors 2021, 21, 321 10 of 19
Sensors 2021, 21, x FOR PEER REVIEW 11 of 21
Figure 6. Nausea results.
From the of oculomotor symptoms (Figure 7), we concluded that the first two tests
had higher average scores than total results, but interestingly, at the same time, the other
two tests had lower average values. We noticed that general discomfort had the highest
reported values. The question regarding vision follow-up and headache had the lowest
reported values. We perceived that there was a larger difference in symptom occurrence
with types of navigation than environment animation and moving elements. Following,
it was noted that difficulty
Figure 6.
Figure
focusing
Nausea
6. Nausea and blurred vision had the smallest difference be-
results.
results.
tween types of navigation and environment moving elements.
From the of oculomotor symptoms (Figure 7), we concluded that the first two tests
had higher average scores than total results, but interestingly, at the same time, the other
two tests had lower average values. We noticed that general discomfort had the highest
reported values. The question regarding vision follow-up and headache had the lowest
reported values. We perceived that there was a larger difference in symptom occurrence
with types of navigation than environment animation and moving elements. Following,
it was noted that difficulty focusing and blurred vision had the smallest difference be-
tween types of navigation and environment moving elements.
Figure7.
Figure Oculomotorsymptoms
7.Oculomotor symptomsresults.
results.
The disorientation
The disorientationtable
table(Figure
(Figure 8),
8), shows
shows higher
higher average
average values
values than
than the
the average
average
values in the overall results, except for the average values from the second test.
values in the overall results, except for the average values from the second test. We could We could
see that dizziness and vertigo had higher values, whereas there were larger
see that dizziness and vertigo had higher values, whereas there were larger differences in differences
in the
the type
type of navigation
of navigation levels
levels thanthan other
other symptoms.
symptoms. It was
It was noticeable
noticeable thatthat difficulty
difficulty in
in fo-
focusing and blurred vision singled out as the ones sensitive to the types of navigation and
cusing and blurred vision singled out as the ones sensitive to the types of navigation and
moving elements and animations.
moving elements and animations.
From the table of total average results (Figure 9), we understood that the least problems
when usingFigure 7. Oculomotor
the VR system were symptoms
related toresults.
nausea, which had the least recorded average
values in all tests. The disorientation caused the most problems in tests with natural
The disorientation
locomotor table (Figure
movement, especially 8), shows higher
in combination average values
with animations than theelements.
and moving average
values in the overall
Most problems withresults, except forsystem
the oculomotor the average
were values from in
manifested thetests
second
withtest. We could
teleportation
see
as athat
way dizziness and vertigo
of navigation, had higherwith
and especially values, whereas
the added there were
animation andlarger differences
moving elements.in
the type of navigation levels than other symptoms. It was noticeable that difficulty
The general discomfort, dizziness, and vertigo portrayed the highest values, while burping in fo-
cusing
had theand blurred
lowest. vision
There wassingled
again aout as thedifference
notable ones sensitive to the
in values types of
between navigation
navigation and
types.
moving elements and animations.Sensors 2021, 21, 321 11 of 19
Sensors 2021, 21, x FOR PEER REVIEW 12 of 21
Figure 8. Disorientation results.
From the table of total average results (Figure 9), we understood that the least prob-
lems when using the VR system were related to nausea, which had the least recorded
average values in all tests. The disorientation caused the most problems in tests with nat-
ural locomotor movement, especially in combination with animations and moving ele-
ments. Most problems with the oculomotor system were manifested in tests with tele-
portation as a way of navigation, and especially with the added animation and moving
elements. The general discomfort, dizziness, and vertigo portrayed the highest values,
while burping had the lowest. There was again a notable difference in values between
Disorientationresults.
Figure8.8.Disorientation
Figure results.
navigation types.
From the table of total average results (Figure 9), we understood that the least prob-
lems when using the VR system were related to nausea, which had the least recorded
average values in all tests. The disorientation caused the most problems in tests with nat-
ural locomotor movement, especially in combination with animations and moving ele-
ments. Most problems with the oculomotor system were manifested in tests with tele-
portation as a way of navigation, and especially with the added animation and moving
elements. The general discomfort, dizziness, and vertigo portrayed the highest values,
while burping had the lowest. There was again a notable difference in values between
navigation types.
Figure 9.
Figure Total Simulator
9. Total Simulator Sickness
Sickness Questionnaire
Questionnaire (SSQ)
(SSQ) results.
results.
From Figure 10a,b, we can see that women and men did not react the same to the ap-
pearance of cybersickness. Women were more susceptible and had pronounced symptoms.
Even though the results show cybersickness as gender-sensitive, the results were in line
with total results for both men and women.
Figure 9. Total Simulator Sickness Questionnaire (SSQ) results.From Figure 10a,b, we can see that women and men did not react the same to the
appearance of cybersickness. Women were more susceptible and had pronounced symp-
Sensors 2021, 21, 321 toms. Even though the results show cybersickness as gender-sensitive, the results were
12 of in
19
line with total results for both men and women.
(a)
(b)
Figure
Figure 10.
10. (a)
(a)Total
Total SSQ
SSQ results
results for
for women. (b)
(b) Total
Total SSQ results for men.
As stated previously, there were four independent tests conducted by each participant.
Their subjective feeling was recorded after each test using standardized questionnaires ap-
plied after every test. In order to be able to conclude from the retrieved results, we initially
had to interrogate the validity of the retrieved results. For this purpose, we have conductedSensors 2021, 21, 321 13 of 19
a one-way ANOVA for each SSQ subscale and the total SSQ score on all four tests (Table 4).
ANOVA results for total SSQ score show that M = 1.6, SD = 0.6 and f-ratio value 17.8131.
The p-value isSensors 2021, 21, 321 14 of 19
Within the question group that was related to symptoms of nausea (Table 7), we had
completed across test comparison using Tukey HSD. Results indicated that there were
significant differences in Tukey’s test between tests 1 and 4, as well as 2 and 4. Based on that
we concluded that nausea was mostly induced with a combination of natural locomotion
navigation with animations and moving elements. Alternative navigation via teleport
could not be considered as a strong enough inhibitor of this symptom. All other test
combinations showed insignificant differences in cybersickness occurrence.
Table 7. Nausea SSQ score Tukey HSD results.
Test Tukey HSD Q Statistic Tukey HSD p-Value Tukey HSD Inference
1 vs 2 0.5153 0.8999947 insignificant
1 vs 3 3.1885 0.1373060 insignificant
1 vs 4 4.8632 0.0107602 p < 0.05
2 vs 3 2.6732 0.2587072 insignificant
2 vs 4 4.3479 0.0249842 p < 0.05
3 vs 4 1.6748 0.6288279 insignificant
From ANOVA results (Table 8) for oculomotor symptoms, the results obtained were
M = 1.66, SD = 0.54, and the f-ratio value 6.0356. The p-value came to 0.0033. The result is
significant at p < 0.05.
Table 8. Oculomotor SSQ score ANOVA summary.
Sum of Degrees of
Source Mean Square MS F Statistic p-Value
Squares SS Freedom ν
test 3.3489 3 1.1163 6.0356 0.0033
error 4.4389 24 0.1850
total 7.7878 27
Within the question group that was related to oculomotor symptoms (Table 9), Tukey’s
test showed similar results as nausea. Results indicated that only test 4, with natural loco-
motion as navigation method and with animations and moving elements, had significant
differences from tests 1 and 2 that had teleport as a means of navigation. We concluded
that oculomotor symptoms were mostly induced with a combination of natural locomotion
navigation with animations and moving elements. All other test combinations showed
insignificant differences in cybersickness occurrence.
Table 9. Oculomotor SSQ score Tukey HSD results.
Test Tukey HSD Q Statistic Tukey HSD p-Value Tukey HSD Inference
1 vs 2 0.8261 0.8999947 insignificant
1 vs 3 3.6736 0.0701518 insignificant
1 vs 4 5.2732 0.0053753 p < 0.01
2 vs 3 2.8475 0.2111234 insignificant
2 vs 4 4.4470 0.0213151 p < 0.05
3 vs 4 1.5995 0.6580020 insignificant
Disorientation ANOVA results (Table 10) showed that M = 1.7, SD = 0.65 and the
f-ratio value of 12.0602. The p-value is 0.0001. The result is significant at p < 0.05.Sensors 2021, 21, 321 15 of 19
Table 10. Disorientation SSQ score ANOVA summary.
Sum of Degrees of
Source Mean Square MS F Statistic p-Value
Squares SS Freedom ν
5.1824 ×
test 6.8357 3 2.2786 12.0602
10−5
error 4.5344 24 0.1889
total 11.3701 27
Within the question group that was related to disorientation symptoms (Table 11),
test results in Tukey’s test showed similar results as the total score. It proved that tests
with different navigation methods had significant differences. Disorientation is mostly
induced with natural locomotion as a type of navigation, so animations with moving
elements cannot be considered as a strong enough inhibitor of this symptom. All other test
combinations showed insignificant differences in cybersickness occurrence.
Table 11. Disorientation SSQ score Tukey HSD results.
Test Tukey HSD Q Statistic Tukey HSD p-Value Tukey HSD Inference
1 vs. 2 0.8348 0.8999947 insignificant
1 vs. 3 5.0434 0.0079470 p < 0.01
1 vs. 4 7.3216 0.0010053 p < 0.01
2 vs. 3 4.2086 0.0311513 p < 0.05
2 vs. 4 6.4869 0.0010053 p < 0.01
3 vs. 4 2.2782 0.3927065 insignificant
4. Discussion
The work on this article starts from the very essence of the problem that can occur
when using VR systems in rehabilitation. The results indicate the existence of the problem
and its impact on the acceptance of virtual systems as a way of rehabilitation for users.
As the contemporary literature designates the benefits of VR in the rehabilitation process,
this paper contributes by outlining the existence of problems and offer solutions to ease the
use of VR systems.
This research was aimed to determine navigation methods and animation and number
of moving objects as factors of human–computer interaction in VR that have a strong
influence on the occurrence of cybersickness. The focus was on the following aspects:
the way users move through VR as well as the amount of static or moving elements in VR.
For this purpose, we designed and conducted a study that included 50 participants
with different professional backgrounds. None of them owned VR systems or used them
extensively. None of the testers had advanced knowledge in using and navigating through
VR or had been instructed how to use it.
The results revealed an indication of a link between the way of navigating through
the VR with the occurrence of cybersickness. The test showed that natural locomotion
navigation that depicts real movement produced more symptoms of cybersickness than
navigating via teleport. At the same time, the number of moving elements and animation
in the environment increased the level of severity of cybersickness in people. A static
environment without moving elements caused fewer symptoms than an environment with
moving elements and animations.
General discomfort, eye strain, and focusing difficulty had the highest levels of symptoms,
followed by blurred vision, in the first two tests where users navigate through VR via tele-
port. Two-second tests, with natural locomotion type of navigation, general discomfort, and
dizziness, both with eyes open and closed, had the highest levels of cybersickness symptoms.
Gender sensitivity came out as interesting test results, as it show that women are
more susceptible to cybersickness than men. Some researchers suggest that this is becauseSensors 2021, 21, 321 16 of 19
women naturally have a wider field of vision than men, and a wide field of view increases
the likelihood of flickering perception [33]. At least three possible explanations are given:
hormonal differences, differences in visual field width, and biased self-report data. The hor-
monal hypothesis is the same as that given in the motion sickness literature—that women
are more susceptible to simulator sickness during part of the menstrual cycle [48].
5. Conclusions
In conclusion, the navigation mode and animation and moving elements influence
the use of VR systems. Natural locomotor navigation type causes more cybersickness
symptoms in these tests than teleport, as confirmed by results in all symptom groups
and total score. Environment animations and moving elements do not show significant
differences in the level of cybersickness symptoms provoked when compared with static
and nonmoving environments. However, these will probably increase the side effects and
thus negatively influence the user’s experience.
This study has shown that there is a possibility to reduce the occurrence of problems
related to cybersickness if the results of this research are taken into consideration and
applied from an early stage of designing a VR.
When designing a VR simulation for rehabilitation, the recommendation is to use
teleport as a way of navigation or to combine teleport and natural locomotion if there is
a possibility, because there is a probability to lower cybersickness symptoms with lesser
use of natural locomotion as a way of navigation. It is recommended to find a balance
between the number of animated and moving elements, as well as the needs and realism
of the environment itself. As results show moving and animated environments as triggers
of the cybersickness symptoms, the solution would be to reduce these negative effects by
eliminating or lowering the number of animated and moving elements.
Appreciation of the complex interactions among and between contributing factors
can lead to the development of a predictive model [49]. People could benefit greatly from
multisensory environments when it comes to rehabilitation and their recovery [50]. Cyber-
sickness is a complex problem that can reduce the effectiveness of the virtual application
itself and cause certain health problems during exposure to VR [51]. Depending on the
interaction of a particular participant in the VR, the system must be designed to improve
the performance of that user, stimulate his participation in rehabilitation and avoid giving
up or creating aversion [52]. Factors affecting the efficiency of human work in VR represent
a complex problem that can reduce effectiveness and cause certain health problems during
exposure to VR [53]. The ability to more accurately predict this phenomenon contributes to
more efficient and effective work in creating VR for the rehabilitation.
Rehabilitation users of virtual simulations can greatly benefit from this research results,
by learning about the possibility of certain symptoms occurring in the virtual space. Being
prepared and able to recognize the symptoms before they immerse in the virtual world
could prevent the aversion in the future use of VR rehabilitation applications. Understanding
the causes and factors that influence the occurrence of these negative symptoms and effects
strongly contributes to building a procedure in VR system development, which would improve
human–computer interaction when it comes to using a virtual rehabilitation system.
Author Contributions: Conceptualization, P.V. and M.M.; methodology, P.V. and M.M.; software,
P.V; validation, P.V.; formal analysis, P.V.; investigation, P.V.; resources, P.V.; data curation, P.V.;
writing—original draft preparation, P.V.; writing—review and editing, P.V. and M.M.; visualization,
P.V.; supervision, M.M.; All authors have read and agreed to the published version of the manuscript.
Funding: This study was partially funded by the Science Fund of the Republic of Serbia (project ID
6524219—AI4WorkplaceSafety).
Institutional Review Board Statement: Ethical review and approval were waived for this study,
due to noninvasive testing and signed participants consent.
Informed Consent Statement: Informed consent was obtained from all subjects involved in the study.Sensors 2021, 21, 321 17 of 19
Data Availability Statement: The data presented in this study are available on request from the
corresponding author. The data are not publicly available due to privacy reasons.
Conflicts of Interest: The authors declare no conflict of interest.
References
1. Kiryu, T.; So, R.H. Sensation of presence and cybersickness in applications of virtual reality for advanced rehabilitation. J. Neuro
Eng. Rehabil. 2007, 4, 34. [CrossRef] [PubMed]
2. Standen, P.; Brown, D. Virtual Reality in the Rehabilitation of People with Intellectual Disabilities: Review. Cyberpsychol-
ogy & Behavior: The Impact of the Internet, Multimedia and Virtual Reality on Behavior and Society. 2005. Available on-
line: https://www.researchgate.net/publication/7771483_Virtual_Reality_in_the_Rehabilitation_of_People_with_Intellectual_
Disabilities_Review (accessed on 14 February 2020).
3. Wilson, P.N.; Foreman, N.; Stanton, D. Virtual reality, disability and rehabilitation. Disabil. Rehabil. 1997, 19, 213–220. [CrossRef]
[PubMed]
4. Snider, L.; Majnemer, A.; Darsaklis, V. Virtual reality as a therapeutic modality for children with cerebral palsy. Dev. Neurorehabilit.
2010, 13, 120–128. [CrossRef] [PubMed]
5. Bell, M.D.; Weinstein, A. Simulated job interview skill training for people with psychiatric disability: Feasibility and tolerability
of virtual reality training. Schizophr. Bull. 2011, 37 (Suppl. 2), S91–S97. [CrossRef]
6. Lotan, M.; Yalon-Chamovitz, S.; Weiss, P.L. Virtual reality as means to improve physical fitness of individuals at a severe level of
intellectual and developmental disability. Res. Dev. Disabil. 2010, 31, 869–874. [CrossRef]
7. McComas, J.; Pivik, J.; Laflamme, M. Current uses of Virtual Reality for Children with Disabilities. Stud. Health Technol. Inform.
1998, 161–169. Available online: http://levelcentre.com/wp-content/uploads/2016/12/McComas.doc.pdf (accessed on 11
February 2020).
8. Krysta, K.; Krzystanek, M.; Cubała, W.J.; Wiglusz, M.S.; Jakuszkowiak-Wojten, K.; Gałuszko-W˛egielnik, M.; Czarnowska-Cubała,
M.; Szarmach, J.; Włodarczyk, A.; Janas-Kozik, M. Telepsychiatry and Virtual Reality and the Treatment of Patients with
Intellectual and Developmental Disabilities. Psychiatr. Danub. 2017, 29, 656–659.
9. Nabors, L.; Monnin, J.; Jimenez, S. A Scoping Review of Studies on Virtual Reality for Individuals with Intellectual Disabilities.
Adv. Neurodev. Disord. 2020, 4, 344–356. [CrossRef]
10. Panerai, S.; Catania, V.; Rundo, F.; Ferri, R. Remote Home-Based Virtual Training of Functional Living Skills for Adolescents and
Young Adults with Intellectual Disability: Feasibility and Preliminary Results. Front. Psychol. 2018, 9, 1730. [CrossRef]
11. Foreman, N.; Stirk, J.; Jayawardena, S.; Johnson, D.A.; Morris, R.G.; Potter, J.; Pugnetti, L.; Mendozzi, L. Commentary on Rose,
F.D., Brooks, B.M., & Rizzo, A.A., virtual reality in brain damage rehabilitation: Review. Cyber Psychol. Behav. 2005, 8, 241–262.
[CrossRef]
12. William, B.; Stone, I. Psychometric Evaluation of the Simulator Sickness Questionnaire as a Measure of Cybersickness.
Ph.D. Thesis, Iowa State University, Ames, IA, USA, 2017.
13. Harrington, C.M.; Kavanagh, D.O.; Quinlan, J.F.; Ryan, D.; Dicker, P.; O’Keeffe, D.; Traynor, O.; Tierney, S. Development and
Evaluation of a Trauma Decision-making Simulator in Oculus Virtual Reality. Am. J. Surg. 2018, 215, 42–47. [CrossRef]
14. Aldaba, C.N.; White, P.J.; Byagowi, A.; Moussavi, Z. Virtual reality body motion induced navigational controllers and their effects
on simulator sickness and pathfinding. In Proceedings of the 39th Annual International Conference of the IEEE Engineering
in Medicine and Biology Society (EMBC), Jeju Island, Korea, 11–15 July 2017; Available online: https://ieeexplore.ieee.org/
document/8037776 (accessed on 14 February 2020).
15. Fernandes, S.A.; Feiner, S.K. Combating VR Sickness through Subtle Dynamic Field-Of-View Modification. 2016. Available online:
http://www.cs.columbia.edu/2016/combating-vr-sickness/images/combating-vr-sickness.pdf (accessed on 12 February 2020).
16. Tiiro, A. Effect of Visual Realism on Cybersickness in Virtual Reality. 2018. Available online: https://www.semanticscholar.org/paper/
Effect-of-visual-realism-on-cybersickness-in-Tiiro/a4173881295298565c398418d39a8f8cf175b007 (accessed on 14 February 2020).
17. Kemeny, A.; George, P.; Mérienne, F.; Colombet, F. New VR Navigation Techniques to Reduce Cybersickness. Eng. Real. Virtual
Real. 2017, 6, 48–53.
18. Hale, K.S.; Stanney, K.M. Handbook of Virtual Environments, 2nd ed.; CRC Press: Boca Raton, FL, USA, 2014; Available online:
https://www.taylorfrancis.com/books/9780429098710 (accessed on 10 February 2020).
19. Johnson, D.M. Introduction to and Review of Simulator Sickness Research; U.S. Army Research Institute for the Behavioral and Social
Sciences: Indianapolis, IN, USA, 2005; Available online: https://pdfs.semanticscholar.org/9ed8/8e0e36ac99ce49fa3386d632acb2
7ca7a8dd.pdf (accessed on 14 February 2020).
20. Steurer, J. Defining Virtual Reality: Dimensions Determining Telepresence. J. Commun. 1992, 42, 73–93. Available online:
https://doi.org/10.1111/j.1460-2466.1992.tb00812.x (accessed on 20 February 2020). [CrossRef]
21. Lowood, H.E. Virtual Reality. In Encyclopædia Britannica; Encyclopædia Britannica, Inc.: Chicago, IL, USA, 2020; Available online:
https://www.britannica.com/technology/virtual-reality (accessed on 20 October 2020).
22. Sanchez-Vives, M.V.; Slater, M. From presence to consciousness through virtual reality. Nat. Rev. Neurosci. 2005, 6, 332–339.
[CrossRef] [PubMed]
23. Huppert, D.; Benson, J.; Brandt, T. A Historical View of Motion Sickness—A Plague at Sea and on Land, Also with Military
Impact. Front. Neurol. 2017, 4, 114. [CrossRef] [PubMed]Sensors 2021, 21, 321 18 of 19
24. Reason, J.; Brandt, T. Motion Sickness; Academic Press: London, UK, 1975; Available online: https://www.worldcat.org/title/
motion-sickness/oclc/1014355654?referer=di&ht=edition (accessed on 14 February 2020).
25. Kennedy, R.; Lane, N.; Lilienthal, M.; Berbaum, K.; Hettinger, L. Profile Analysis of Simulator Sickness Symptoms: Application to
Virtual Environment Systems. Presence Virtual Augment. Real. 1992, 1, 295–301. [CrossRef]
26. Stanney, K.; Kennedy, R.; Drexler, J. Cybersickness is not simulator sickness. SAGE J. 1997, 41, 1138–1142. [CrossRef]
27. Slater, M. A Note on Presence Terminology. 2003. Available online: https://www.semanticscholar.org/paper/A-note-on-
presence-terminology-Slater/ed277f9067a0b6aadd90c055d31aecc8ab92aa2f (accessed on 18 February 2020).
28. Ott, M.; Freina, L. A Literature Review on Immersive Virtual Reality in Education: State of the Art and Perspectives. 2015. Available on-
line: https://www.itd.cnr.it/download/eLSE%202015%20Freina%20Ott%20Paper.pdf (accessed on 14 February 2020).
29. Bowman, D.A.; McMahan, R.P. Virtual Reality: How Much Immersion Is Enough? Computer 2007, 40, 36–43. [CrossRef]
30. Lombard, M.; Biocca, F.; Freeman, J.; Jsselsteijn, W.; Schaevitz, R.J. Immersed in Media: Telepresence Theory, Measurement & Technology;
Springer: Berlin/Heidelberg, Germany, 2015.
31. Barrett, J. Side Effects of Virtual Environments: A Review of the Literature; Department of Defence, Australian Government:
Canberra, Australia, 2004; Available online: https://pdfs.semanticscholar.org/ab1b/4153e44abb4c1a1fcac5f2aaee847d30ecf3.pdf
(accessed on 12 February 2020).
32. Slater, M.; Wilbur, S. A Framework for Immersive Virtual Environments (FIVR): Speculations on the Role of Presence in Virtual
Environments. Presence Virtual Augment. Real. 1997, 6, 603–616. [CrossRef]
33. Joseph, J.; LaViola, J. A Discussion of Cybersickness in Virtual Environments. SIGCHI Bull. 2000, 32, 47–56.
34. Treisman, A. Focused attention in the perception and retrieval of multidimensional stimuli. Percept. Psychophys. 1977, 22, 1–11.
[CrossRef]
35. Bonato, F.; Bubka, A.; Palmisano, S.; Phillip, D.; Moreno, G. Vection Change Exacerbates Simulator Sickness in Virtual Environ-
ments. Presence Virtual Augment. Real. 2008, 17, 283–292. [CrossRef]
36. Vinson, N.G.; Lapointe, J.F.; Parush, A.; Roberts, S. Cybersickness induced by desktop virtual reality. In Proceedings of the
Graphics Interface, Toronto, ON, Canada, 12 May 2012; pp. 69–75. Available online: https://dl.acm.org/citation.cfm?id=2305288
(accessed on 14 March 2020).
37. Davis, S.; Nesbitt, K.; Nalivaiko, E. A Systematic Review of Cybersickness. In Proceedings of the IE2014: 2014 Conference on
Interactive Entertainment, Newcastle, Australia, 2–3 December 2014; pp. 1–9.
38. Kennedy, R.; Lane, N.; Berbaum, K.; Lilienthal, M. Simulator Sickness Questionnaire: An Enhanced Method for Quantifying
Simulator Sickness. Int. J. Aviat. Psychol. 1993, 3, 203–220. [CrossRef]
39. Zyda, M. From visual simulation to virtual reality to games. Computer 2005, 38. Available online: https://ieeexplore.ieee.org/
document/1510565 (accessed on 12 March 2020). [CrossRef]
40. García-Peñalvo, F.J.; Conde, M.Á.; Del Pozo, A. A Mobile Personal Learning Environment Approach. In Virtual, Augmented
and Mixed Reality. Systems and Applications. Lecture Notes in Computer Science; Shumaker, R., Ed.; VAMR 2013; Springer:
Berlin/Heidelberg, Germany, 2013; p. 8022. [CrossRef]
41. Veličković, P.; Minović, M.; Krsmanović Veličković, S. Tehnologije mrežnog prenosa zvuka. Časopis Inf. Tehnol. Multimedijalne Sist.
Info M 2016, 58, 1451–4397.
42. Berntsen, K.; Colomo-Palacios, R.; Herranz, E. Virtual reality and its uses: A systematic literature review. In Proceedings of the
Fourth International Conference on Technological Ecosystems for Enhancing Multiculturality, Salamanca, Spain, 2–4 November 2016.
[CrossRef]
43. Clifton, J.; Palmisano, S. Effects of steering locomotion and teleporting on cybersickness and presence in HMD-based virtual
reality. Virtual Real. 2020, 24, 453–468. [CrossRef]
44. IrisVR. Navigation Controls in Prospect. 2020. Available online: https://help.irisvr.com/hc/en-us/articles/115015330667
-Navigation-Controls-in-Prospect (accessed on 14 February 2020).
45. Kennedy, R.S.; Frank, L.H. Review of Motion Sickness with Special Reference to Simulator Sickness; Canyon Reprear Group: Sanger,
CA, USA, 1985; Available online: https://apps.dtic.mil/dtic/tr/fulltext/u2/a155975.pdf (accessed on 20 February 2020).
46. Likert, R. A technique for the measurement of attitudes. In Archives of Psychology; The Science Press: New York, NY, USA, 1932;
Available online: https://psycnet.apa.org/record/1933-01885-001 (accessed on 14 February 2020).
47. Croarkin, C.; Tobias, P. (Eds.) Tukey’s Method. In ENIST/SEMATECH e-Handbook of Statistical Methods; NIST: Washington, DC, USA,
2012. Available online: https://www.itl.nist.gov/div898/handbook/prc/section4/prc471.htm (accessed on 11 February 2020).
48. Johnson, D.M. Simulator Sickness Research Summary; RTO-TR-HFM-121-Part-II; U.S. Army Research Institute for the Behavioral and
Social Science: Ft. Rucker, AL, USA, 2005; Available online: https://apps.dtic.mil/dtic/tr/fulltext/u2/a474304.pdf (accessed on
14 February 2020).
49. Bockelman, P.; Lingum, D. Factors of Cybersickness. In Communications in Computer and Information Science, Proceedings of the HCI
International 2017—Posters’ Extended Abstracts, HCI 2017, Vancouver, BC, Canada, 9–14 July 2017; Stephanidis, C., Ed.; Springer:
Orlando, FL, USA, 2017; Volume 714, pp. 3–8. [CrossRef]
50. Manresa-Yee, C.; Morrison, A.; Guasp, J.J.; Roig-Maimó, M.F. Multi-sensory Environmental Stimulation for Users with Multiple
Disabilities. Intell. Syst. Ref. Libr. 2017, 119, 165–182.You can also read