In-Situ SERS Detection of Hg2+/Cd2+ and Congo Red Adsorption Using Spiral CNTs/Brass Nails - MDPI
←
→
Page content transcription
If your browser does not render page correctly, please read the page content below

nanomaterials

Article
In-Situ SERS Detection of Hg2+/Cd2+ and Congo Red
Adsorption Using Spiral CNTs/Brass Nails
Mohamed Shaban

                                          Department of Physics, Faculty of Science, Islamic University of Madinah, Madinah 42351, Saudi Arabia;
                                          mssfadel@aucegypt.edu

                                          Abstract: Brass spiral nails were functionalized with CoFe2 O4 nanoparticles and utilized as a sub-
                                          strate for the growth of extremely long CNTs with helical structures and diameters smaller than
                                          20 nm. Different methods were used to characterize the grown CNTs’ structures and morphologies.
                                          The characteristic Raman peaks of CNTs were amplified four times after being uploaded on the spiral
                                          nail, making the substrates for surface-enhanced Raman spectroscopy (SERS) more sensitive. To
                                          detect Hg2+ and Cd2+ at concentrations ranging from 1 to 1000 ppb, a CNT/spiral brass nail was
                                          used as a SERS substrate. The proposed sensor demonstrated high sensitivity and selectivity between
                                          these heavy metal ions. As a result, the proposed CNTs/spiral brass sensor can be an effective tool
                                          for identifying heavy metal ions in aqueous solutions. In addition, Congo red (CR) adsorption as a
                                          function of initial dye concentration and contact time was investigated. For CR dye solutions with
                                          concentrations of 5, 10, and 20 mg/L, respectively, the highest removal percentage was determined to
                                          be ~99.9%, 85%, and 77%. According to the kinetics investigation, the pseudo-first-order and pseudo-
                                          second-order models effectively handle CR adsorption onto CNTs/spiral nails. The increase in the
                                          dye concentration from 5 ppm to 20 ppm causes the rate constant to drop from 0.053 to 0.040 min−1 .
                                          Therefore, our sample can be employed for both the effective degradation of CR dye from wastewater
                                          and the detection of heavy metals.
Citation: Shaban, M. In-Situ SERS
Detection of Hg2+ /Cd2+ and Congo         Keywords: spiral CNTs; heavy metals; sensors; nanoadsorbents; congo red dye adsorption
Red Adsorption Using Spiral
CNTs/Brass Nails. Nanomaterials
2022, 12, 3778. https://doi.org/
10.3390/nano12213778                      1. Introduction
Academic Editors: Silvia Scalese and           A significant global challenge is the removal of heavy metals and dyes from water
Isabel Pastoriza-Santos                   sources. To remove dyes and heavy metals, many technologies have been developed,
                                          including the low-cost adsorption technique using different adsorbents such as layered
Received: 4 October 2022
                                          double hydroxides, clays, zeolites, and carbon-based nanoadsorbents [1–5]. Carbon nan-
Accepted: 24 October 2022
                                          otubes (CNTs) are attracting a lot of attention because of their distinctive optoelectronic
Published: 26 October 2022
                                          applications in flat panel displays, very sensitive electromechanical and chemical sensors,
Publisher’s Note: MDPI stays neutral      and hydrogen storage devices [6–9]. CNTs have also been used to remove harmful pol-
with regard to jurisdictional claims in   lutants from gas streams and aqueous solutions because of their sizable specific surface
published maps and institutional affil-   area, highly hollow and porous structure, low mass density, and effective interactions
iations.                                  with pollutant molecules [10,11]. Several experimental studies on the adsorption of heavy
                                          metal ions on single- and multi-wall CNTs have already been conducted [10,12,13]. Carbon
                                          nanotubes (CNTs) are a typical adsorbent used to extract organic and other inorganic
                                          pollutants from wastewater [14–16]. CNTs are used as adsorbents more frequently than
Copyright:    © 2022 by the author.
                                          conventional adsorbents due to their superior volume-area ratios, functional surfaces,
Licensee MDPI, Basel, Switzerland.
This article is an open access article
                                          strong electrostatic interactions, cylindrical hollow structures, high mechanical strengths,
distributed under the terms and
                                          and quicker equilibrium durations [17–19]. Single-walled carbon nanotubes (SWCNTs) and
conditions of the Creative Commons
                                          multi-walled carbon nanotubes are the two varieties of CNTs (MWCNTs). By enhancing
Attribution (CC BY) license (https://     interactions with organic dye molecules and heavy metals through hydrophobic surfaces,
creativecommons.org/licenses/by/          electrostatic forces, van der Waals forces, and hydrogen bonding, both of their structural
4.0/).                                    configurations are more effective [20]. MWCNTs are also superior to SWCNTs at removing

Nanomaterials 2022, 12, 3778. https://doi.org/10.3390/nano12213778                                     https://www.mdpi.com/journal/nanomaterials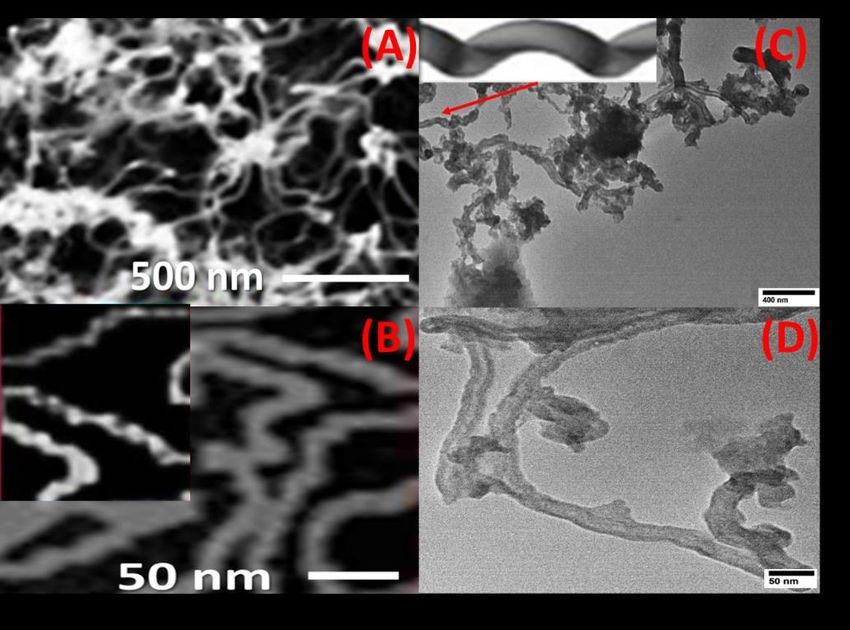
Nanomaterials 2022, 12, 3778                                                                                           2 of 13

                               cationic dyes because of interactions between charged dye molecules and their surface [15].
                               So far, MWCNTs have only been used for CR removal in a small number of experiments
                               that showed strong adsorption performance [21–24].
                                      Additionally, by guiding, amplifying, emitting, and altering optical fields, CNTs
                               placed on substrates can be used for novel and efficient applications, such as sensors
                               based on SERS [25–28]. SERS is a technique that enhances Raman scattering by molecules
                               adsorbed onto particular, meticulously created rough metal surfaces. The SERS-based
                               sensor is one of the most important nanooptical-based detection methods for the chemical
                               speciation of hazardous heavy metal ions in water at trace levels. Li et al. [29] evaluated
                               and offered a summary of the successes and challenges in the determination of heavy
                               metals, organic pollutants, ions, and pathogens based on SERS. A porous anodic alumina
                               membrane functionalized with hexagonal arrays of Au nanoparticles was developed by
                               Shaban et al. [30–32] as a SERS substrate for the detection of several heavy metals, including
                               Hg2+ , Cd2+ , and Pb2+ at nm concentrations. To create highly sensitive SERS biosensors for
                               the detection of organic or inorganic contaminants and diseases, Wei et al. [33] compiled the
                               uses of plasmonic nanoparticles. Chemical and electromagnetic enhancements are the two
                               processes for SERS enhancement that are discussed in the literature. The chemical effect is
                               improving by two orders of magnitude, while the electromagnetic (EM) effect dominates.
                               The high costs and reproducibility of sensor fabrication continue to hinder the practical
                               environmental applications of SERS-based sensors despite their rapid growth. There is still
                               a high demand for the creation of quick, cheap, repeatable, and scalable detection platforms.
                                      Numerous methods, including arc discharge, laser ablation, plasma enhancement,
                               and chemical vapour deposition (CVD) of hydrocarbon gasses (methane, ethane, and
                               acetylene) at relatively high temperatures over a catalytic material, have been used to create
                               CNTs [34,35]. The band gap of semiconducting nanotubes can be adjusted by varying
                               the tube diameter, and the deposited CNTs may be made of metals, semiconductors, or
                               dielectrics [36]. Along with MWCNTs, amorphous carbon is also present during the creation
                               of MWCNTs. These amorphous carbons are unwanted in many applications; thus, they are
                               etched out of the structure. Another problem is the need for unique methods to remove
                               the nanoadsorbent from the aqueous solution after usage. Additionally, finding novel
                               methods to produce MWCNTs at high yields is crucial. In order to address these problems,
                               it is suggested in this work that a coating of CNTs with a diameter no greater than 20 nm
                               be applied to the spiral nail’s upper surface. As synthetic materials for the SERS-based
                               detection of heavy metals and the adsorption of the CR dye from aqueous solutions, the
                               developed MWCNTs/spiral brass nails are used. Hg2+ and Cd2+ were chosen as the test
                               objects due to their numerous detrimental effects on human health as well as the economy.
                               Therefore, the continuous detection and monitoring of these harmful heavy metal levels in
                               soil, pharmaceuticals, and water resources require the development of rapid, trustworthy,
                               and sensitive sensor networks [37–40]. Processing speed, operation costs, product yield,
                               reusability, and sustainability all benefit from this. To detect traces of Hg2+ and Cd2+ ions
                               in water, CNTs and spiral brass nails are made. The in-situ user’s spectroscopy serves as
                               the cornerstone of the sensing principle. Research is being conducted on sensitivity and
                               selectivity. The use of the samples for the adsorption of CR is also being explored, as=is
                               the impact of the initial dye concentration and adsorption period. The mechanics of the
                               reaction and its tenfold repeatability are also highlighted.

                               2. Methods
                               2.1. Functionalization of Spiral Nail with CoFe2 O4 Nanoparticles
                                    Brass spiral nails were cleaned, made functional, and utilized to generate CNTs in
                               high yield. The spiral nail was cleaned and functionalized using CoFe2 O4 nanoparticles. A
                               1:1 mixture of 0.5 M Fe(NO3 ) and 0.5 M Co(NO3 )2 ·6H2 O was created. The cleaned nail was
                               then submerged in the solution and placed in the ultrasonic for one hour. The produced
                               nail was dried for one hour in an oven at 500 ◦ C.
Nanomaterials 2022, 12, 3778                                                                                        3 of 13

                               2.2. Growth of CNTs on Functionalized Nail
                                    In a ceramic tube with a temperature and gas flow controller, C2 H2 chemical vapour
                               deposition was performed (CVD). Spiral brass nails functionalized with CoFe2 O4 were
                               heated to 600 ◦ C for 10 min while being exposed to nitrogen (N2 ) gas. The system was then
                               subjected to a mixture of N2 /C2 H2 (5:1 v/v) for 50 min. The tube furnace’s temperature
                               decreased as the N2 gas passed through the reaction chamber. In a 120 ◦ C oven, the
                               prepared CNTs/spiral brass nails were cured.

                               2.3. Characterization Techniques
                                    The produced nanostructured films underwent morphological studies using field
                               emission-scanning electron microscopy, or FE-SEM (model: ZEISS SUPRA 55 VP and
                               ZEISS LEO, Gemini Column, Jena, Germany). Transmission electron microscopes (TEM,
                               JEOL-2010F, Tokyo, Japan) were also used to analyze the interior morphology. Research
                               of the chemical composition was performed using energy-dispersive X-ray analysis (EDX;
                               Oxford Link ISIS 300 EDX, Oxford, UK). To produce an accurate quantitative analysis, the
                               reaction was calibrated using standard additions.

                               2.4. SERS Measurements
                                    The sensing approach is based on heavy metal detection utilizing surface-enhanced
                               Raman scattering (SERS) spectroscopy after injecting very small amounts (0.1 l) of water
                               polluted with heavy metals on the surface. Using an Enwave Optronics Raman microscope
                               with a 514 nm excitation wavelength and a 1 µm spot size, SERS measurements were made
                               on CNT and nail samples. P = 50 mW and t = 20 s were the excitation laser power and
                               exposure times, respectively.

                               2.5. Adsorption Measurements
                                     Adsorption studies were performed on CNTs/spiral brass nail adsorbents, utiliz-
                               ing a variety of starting dye concentrations and adsorption periods. With a variety of
                               experimental conditions, including starting dye concentrations (5–20 mg/L), adsorption
                               periods (0–90 min), adsorbent dose (0.05 g per 50 mL of CR solution), pH (7.0), and room
                               temperature, all CR adsorption tests were conducted on a batch mode scale. The UV/Vis
                               spectrophotometer (PerkinElmer, Lambda 950, Boston, MA, USA) was used to determine
                               the variance in CR concentration by tracing the absorption peak. With 0.05 g in 50 mL of
                               initial CR concentration of 5 mg/L for 90 min of contact time at room temperature and pH
                               7, the adsorbent’s reusability was examined ten times. After each run, the adsorbent was
                               washed with DI water and set for the next run.
                                     The CR dye elimination percentage was calculated using Equation (1) [41,42]:

                                                                               (Co − Ct )
                                                          CR dye removal % =              × 100                        (1)
                                                                                  Co

                               where Co and Ct are, respectively, the starting and final concentrations of CR in mg/L. The
                               data that were displayed were the averages from three separate studies.

                               3. Results and Discussions
                               3.1. Morphological Study
                                    CNTs were grown on the top surface of the spiral nail using CVD to enhance its sensing
                               and adsorbent capabilities. By using FE-SEM and HR-TEM images, the surface morphology
                               of the CNT-coated spiral nail was identified. Top-view HRTEM and FE-SEM images of
                               CNTs at various magnifications are shown in Figure 1A–D. The CoFe2 O4 nanoparticles
                               on the top surface of the spiral have served as seeds for growing extremely long CNTs
                               with diameters of 17 ± 3 nm, as seen in SEM and TEM pictures, Figure 1A,C. Helix-shaped
                               carbon nanotubes with a sizable specific surface area were displayed in Figure 1B,C. One
Nanomaterials 2022, 12, x 4 of 13
Nanomaterials 2022, 12, 3778 4 of 13
CNTs with diameters of 17 ± 3 nm, as seen in SEM and TEM pictures, Figure 1A,C. Helix-
shaped carbon nanotubes with a sizable specific surface area were displayed in Figure
1B,C. One CNT’s helical shape is depicted in the inset of Figure 1C. The inner diameter
CNT’s helical shape is depicted in the inset of Figure 1C. The inner diameter was 8 ± 2 nm
was 8 ± 2 nm and the CNT wall width was 8 ± 1 nm, according to Figure 1D.
and the CNT wall width was 8 ± 1 nm, according to Figure 1D.
It is vital to note that this process yields about 17 g of CNTs. The great stability of the
manufactured helical CNTs on the spiral brass nail, in addition to their low cost and high
yield, makes these innovative nanostructures promising candidates for SERS substrates
and may find a wide range of new applications, such as in sensors and environmental
monitoring. It can also be utilized as a potential nano-adsorbent nail for the purification
of water. Energy-dispersive X-ray (EDX) analysis of the chemical makeup of the mechan-
ically etched CNTs is used to confirm the purity of the prepared CNTs, as shown in Figure
2. The signals of the elements C and O are seen in the CNT powder’s EDX spectrum. From
this EDX chart, no impurity signs have been identified.
Figure 1. Top view (A,B) FE-SEM and (C,D) TEM image of CNTs/spiral nail. The inset of (C) shows
the helical shape of one CNT.
It is vital to note that this process yields about 17 g of CNTs. The great stability of the
manufactured helical CNTs on the spiral brass nail, in addition to their low cost and high
yield, makes these innovative nanostructures promising candidates for SERS substrates
and may find a wide range of new applications, such as in sensors and environmental
monitoring. It can also be utilized as a potential nano-adsorbent nail for the purification of
water. Energy-dispersive X-ray (EDX) analysis of the chemical makeup of the mechanically
etched CNTs is used to confirm the purity of the prepared CNTs, as shown in Figure 2. The
signals
Figure of the
1. Top viewelements C andand
(A,B) FE-SEM O (C,D)
are seen
TEMinimage
the CNT powder’snail.
of CNTs/spiral EDXThe
spectrum. From
inset of (C) this
shows
theEDX chart,
helical shapenoofimpurity
one CNT.signs have been identified.
Figure 2. EDX
Figure spectrum
2. EDX of of
spectrum CNTs powder
CNTs etched
powder from
etched the
from surface
the ofof
surface the brass
the nail.
brass nail.sents the E2g phonons, whereas the D band is the A1g symmetry breathing modes of rings
or K-point phonons [43]. Because the nanotubes are graphitic, the G band is connected to
the in-plane stretching vibrations of sp2-bonded carbon atoms [43]. Defects and disorders
in the hexagonal lattice, such as carbonaceous impurities and broken sp2 bonds in the
sidewalls, are associated with the D band [44]. The graphitic lattice of the system is meas-
Nanomaterials 2022, 12, 3778 5 of 13
ured by the D/G intensity ratio (ID/IG), which also reflects how faulty it is. The calculated
ID/IG ratio is 0.955. In addition, the G’ band (D overtone or 2D-band) was observed at ~2670
cm−1 in Figure 3b. The weak band at 2317 cm−1 is ascribed to highly oriented pyrolytic
3.2. Raman
graphite SpectraThe weak bands observed before 1120 cm−1 are related to the vibrational
(HOPG).
modesThe of Raman
the usedspectra
brass nail and usedand
of MWCNTs catalyst.
MWCNTsThe peaksloadedat on
~1120 andnails
spiral 1041are
cmdisplayed
−1 are at-
tributed
in Figure to 3.
multi-phonon
Three distinctivetransitions
peaksofare brass [45]. Additionally,
depicted at 870, 1370,fourandpeaks
1590 at − 1
740 ,(A
cm as1g(1)),
seen
615(A 1g(2)),3a.
in Figure 467As T2gillustrated
(2), and 340in(EFigure
g) cm−13b,aretwo
related to the Raman
prominent activecharacteristic
first-order modes of CoFe 2O4
peaks
for MWCNTs were found at 1573 cm−1 (G band) and 1341 cm−1 (D band). The G band
[46,47].
represents
All thethe E2gare
peaks phonons,
moved whereas
to lower the D band is the
wavenumbers byA 1g symmetry
uploading breathing
the CNTs on themodes
spiral of
rings(Figure
nail or K-point
3b). phonons
This change [43]. suggests
Because the nanotubes
some decreases areat
graphitic, the G band
the CNT/spiral nailisinterfaces
connected
to the in-plane
during CNT growth stretching
in a vibrations of sp2-bonded
high-temperature carbon atoms
N2 environment [48].[43]. Defects andthe
Additionally, disorders
ID/IG
in therising
value hexagonal
to 1.12lattice,
suggests such asthe
that carbonaceous
disorders and impurities
flaws of and
CNTs broken sp2 nail
on spiral bonds in the
surfaces
sidewalls,
are more severeare associated
than thosewith the D band CNTs.
of free-standing [44]. The Thegraphitic lattice ofofthe
low crystallinity the system
CNTs isis
measured
shown by thebyhigh
the D/G intensity
intensity of the ratio
D band. (ID/IG),
Three which
factorsalso
make reflects how faulty
the deposition it is.long
of very The
calculated
helical CNTs IDon
/IGthe ratio is 0.955.
spiral In addition,
nail’s outer surface the G’ band
crucial (D overtone
for sensing or 2D-band)
applications. The CNTs was
observed at ~2670 −1 in Figure 3b. The weak band at 2317 cm−1 is ascribed to highly
on the spiral’s outer cm surface have a greater chance of coming into contact with the reactant,
oriented
to pyrolytic
start. Second, thegraphite
increased (HOPG).
surface The
areaweak bands and
of CNTs observed before
the spiral 1120
nail cm−1 are related
membrane, along
to the
with thevibrational
improvedmodes Ramanofcharacteristics,
the used brassmight nail and used catalyst.
improve the sensingTheproperties.
peaks at ~1120 and
Last but
1041 − 1
cm theare attributed to multi-phonon
not least, presence of abnormalities andtransitions
illnesses mayof brass [45]. Additionally,
function as additional four peaks
hot spots.
at 740 (A (1)), 615(A (2)), 467 T (2), and 340 (E ) cm −1 are related to the Raman active
1g 1g 2g g
For these reasons, this CNT/spiral nail array SERS substrate is intriguing.
modes of CoFe2 O4 [46,47].
Figure
Figure3.3.Raman
Ramanspectra
spectraof
of(a)
(a)CNTs
CNTspowder
powderand
and(b)
(b)CNTs/
CNTs/spiral
spiralnail.
nail.
All theProperties
3.3. Sensing peaks areand
moved
SERStoMeasurements
lower wavenumbers by uploading the CNTs on the spiral
nail Surface-sensitive
(Figure 3b). This Raman
change scattering
suggests some decreases
(SERS) at the CNT/spiral
is a technique nail interfaces
that makes molecules ad-
during CNT growth in a high-temperature N environment [48]. Additionally,
sorbed on rough metal surfaces boost Raman 2scattering. SERS measurements are the ID/IG
used to
value rising to 1.12 suggests that the disorders and flaws of CNTs on spiral nail surfaces are
investigate the vibrational properties of the adsorbed molecules, revealing structural in-
more severe than those of free-standing CNTs. The low crystallinity of the CNTs is shown
formation about the molecule and its local relationships. SERS measurements, therefore,
by the high intensity of the D band. Three factors make the deposition of very long helical
allow for and specifically identify individual detection [49,50]. The unique properties of
CNTs on the spiral nail’s outer surface crucial for sensing applications. The CNTs on the
CNTs/spiral nail nanostructures enable high sensitivity and selectivity in a novel manner.
spiral’s outer surface have a greater chance of coming into contact with the reactant, to
start. Second, the increased surface area of CNTs and the spiral nail membrane, along with
the improved Raman characteristics, might improve the sensing properties. Last but not
least, the presence of abnormalities and illnesses may function as additional hot spots. For
these reasons, this CNT/spiral nail array SERS substrate is intriguing.
3.3. Sensing Properties and SERS Measurements
Surface-sensitive Raman scattering (SERS) is a technique that makes molecules ad-
sorbed on rough metal surfaces boost Raman scattering. SERS measurements are used
to investigate the vibrational properties of the adsorbed molecules, revealing structural
information about the molecule and its local relationships. SERS measurements, therefore,
allow for and specifically identify individual detection [49,50]. The unique properties of
CNTs/spiral nail nanostructures enable high sensitivity and selectivity in a novel manner.Nanomaterials2022,
Nanomaterials 2022,12,
12,3778
x 66 of
of 13
13
Figure4a,b
Figure 4a,bdisplay
displaythe theSERS
SERSspectra
spectraofofCNT/spiral
CNT/spiral nails
nailscontaminated
contaminatedwith with1–1000
1–1000ppbppb
ofHg
of 2+
Hg and
2+
and Cd 2+
Cd . .The
2+
TheRaman
Raman HgHgpeaks
peaksareare
more intense
more than
intense their
than Cd counterparts.
their Cd counterparts.Ad-
ditionally, asasshown
Additionally, shownininthe theinset
insetofofFigure
Figure4b,4b, increasing
increasing the detected ions’ ions’ concentration
concentration
enhancesthe
enhances thecontrast
contrastand andintensities
intensitiesof ofthe
theSERS
SERSpeaks.
peaks.Figure
Figure4c 4cshows
showsthe thefluctuation
fluctuation
ofthe
of thepeak
peakI,I,II,II,and
andpeak
peakIIIIIIintensities
intensitiesatat1000
1000ppb ppbofof
HgHg2+2+and
andCdCd 2+2+.. Peak
PeakIIexhibits
exhibitsthethe
biggestchange
biggest changeininintensity.
intensity.TheTheinset
insetofofFigure
Figure4c4cdisplays
displaysthetheselectivity
selectivity ofof
Hg 2+2+over
Hg overCdCd2+2+
ions
ionsusing
usingIHg IHg/(I
/(IHgHg −−ICd
ICd
). ).The
Thecorresponding
correspondingvalues
valuesfor forthe
the three
three peaks were 2.5, 2.5, 1.9,
1.9,and
and
1.7.In
1.7. Inaddition,
addition,the thepresence
presenceofofCd Cd2+2+ ions
ions boosts
boosts the
the strength
strength of of peak
peak IIII (Figure
(Figure 4d).
4d).
Figure 4. Demonstrating the sensitivity and selectivity of spiral CNT/brass nails uploaded with (a)
Hg 2+ and (b) Cd2+ of concentration 1–1000 ppb; (c) the variation of intensity of the characteristic
Figure 4. Demonstrating the sensitivity and selectivity of spiral CNT/brass nails uploaded with (a)
peaks, I, II,(b)
Hg2+ and andCdIII,
2+ for Hg2+ and Cd2+1–1000
of concentration ions; (d) the(c)
ppb; linear variation of
the variation of intensity
intensity of
of the
thecharacteristic
characteristic
peak II for 2+ 2+ ions over Cd2+ ions.
peaks, I, II,Cd
and. III,
Theforinset
Hgof
2+ (c)
andshows the selectivity
Cd2+ ions; of Hg
(d) the linear variation of intensity of the characteristic
peak II for Cd2+. The inset of (c) shows the selectivity of Hg2+ ions over Cd2+ ions.
As the concentration rises from 1 to 1000 ppb, the intensity of peak II for Cd increases
from 1Astothe
370. According torises
concentration Figure 4d,1 there
from was
to 1000 a linear
ppb, relationship
the intensity between
of peak theincreases
II for Cd peak II
values’
from 1 intensity and the concentrations
to 370. According of Cd2+
to Figure 4d, there wasions. Sincerelationship
a linear the curve is between
linear, Equation
the peak(2)II
provides a good match:
values’ intensity and the concentrations of Cd2+ ions. Since the curve is linear, Equation (2)
provides a good match: Y = 0.352 X + 1.55, (R2 = 0.98) (2)
This may be related to the chemical modification of the spiral nail’s surface and more (2)
Y = 0.352 X + 1.55, (R2 = 0.98)
potent hotspots, which are active nanodots with diameters of less than 20 nm [30,51]. As
This
a result, compared to Cd2+
may be related to ions, Hg2+ ions
the chemical modification
were moreofsensitive
the spiral
andnail’s surfaceThe
selective. andinter-
more
potent of
ference hotspots, whichrays
the reflected are from
activethe
nanodots with
air/metal diameters
contacts mayof lesslead
also thanto20 nm [30,51]. As
electromagnetic
a result, compared
enhancement to Cd2+ ions,
and significant Hgamplification
signal 2+ ions were more sensitive
[51]. The andof
trapping selective.
CNT with Theadsorbed
interfer-
ence of
heavy the reflected
metals rays from
then enhances the air/metal
the sensing contactsbecause
performance may also lead
of the to electromagnetic
increase in the num-Nanomaterials 2022, 12, 3778 7 of 13
ber of analyte molecules in SERS-active hot spots and the electromagnetic amplification
caused by the interference of optical signals inside the interaction volume. Raw CNTs are
infrequently employed for the selective sorption of ion metals because of the van der Waals
interactions between the carbon atoms in graphene sheets. The functionalization of CNTs
improves medium dispersion while also improving metal ion sorption through chemical
bonding, making modified CNTs better sorbents and more selective for metal ions than
raw CNTs [52]. Helical carbon nanotubes with a large specific surface area have been used
to successfully detect heavy metals on the spiral nail’s upper surface. The developed spiral
CNT/brass nail is tested for ten cycles of Hg2+ ion detection, and the results are shown
in Figure S1 (Supplementary Materials), along with the descriptive statistics results in the
inset table. The results confirm the high reusability of the designed SERS sensor.
3.4. Congo Red Adsorption and Kinetic Models
The amount of dye removed by adsorption is significantly influenced by the starting
concentration of the adsorbate. Using CNT/spiral nail nanoadsorbents at different initial
CR concentrations, Figure 5A shows the variations in the removal percentage of CR ad-
sorbed over time. The dye removal percentage normally begins the adsorption process at
a relatively high level and then gradually decreases until it achieves equilibrium. Once
equilibrium is attained while using fresh sorbents, contact time has no discernible effect
on the adsorption process. The reason for the rapid removal rate during the early stages
of adsorption progression is the presence of numerous exposed active adsorption patches
on the surfaces of the adsorbent. By lengthening the contact time between the adsorbent
and the adsorbate, the hot spots were transformed into fully occupied CR sites. As a result,
there is an increase in the repulsive forces between CR molecules in the bulk liquid phase
and CR molecules adsorbed on adsorbent surfaces [41]. The dye removal percentage falls
as the initial CR dye concentration is raised. In contrast, the key factor driving the increase
in the amount of adsorbed CR by the adsorbent is the high driving force for mass transfer
at a high starting CR concentration. This may be attributed to the gradient’s increase with
increasing beginning CR concentration. In order to overcome the mass transfer resistance
between the CR adsorbate and the nanoadsorbent active sites, an appropriate rise in the
draft forces, therefore, takes place [53,54]. At pH 7 and 25 ◦ C, the highest removal rates for
CR dye solutions with concentrations of 5, 10, and 20 mg/L, respectively, were determined
to be 99.9%, 85%, and 77% at 90 min. The findings indicated that CNT growth on the
surface of spiral nails produced higher values than had previously been observed for
CNT-based adsorbents [55–57], indicating the viability of the employed strategy to improve
CR removal performance, particularly at lower concentrations.
To select the best adsorption kinetics model, the adsorption performance of CNTs/spiral
nails at various initial CR concentrations was examined. Previous reports stated that the
non-linear forms of kinetic models are more suitable than the linear forms for fitting the
experimental data and that nonlinear fitting is more accurate than linear fitting to obtain the
values of the constants for each model [58–60]. By plotting the proportion of dye removal
percentage vs. time, Figure 5B–D depict the first-order, second-order, and Elovich kinetics
nonlinear graphs [61,62]. The adsorption kinetics parameters for the assessment model; k1 ,
k2 , qe, β, and α; as well as R2 , were derived using nonlinear fitting and are displayed in
Table 1. The pseudo-first-order and second-order models are effective at handling CR ad-
sorption onto the proposed nanoadsorbent at low and high CR concentrations, respectively,
according to the nonlinear fit and regression coefficient values in Table 1 for all the studied
kinetic models. This was further supported by the accurate approximation between the
calculated dye removal percentage and the experimental removal percentage. According
to the first-order model, the rate constant is lowered from 0.053 to 0.040 min−1 by raising
the dye concentration from 5 ppm to 20 ppm. With the pseudo-first-order model at low
concentrations and the pseudo-first-order model at high concentrations, the CR adsorption
on CNTs/spiral nails is effectively addressed.Nanomaterials 2022, 12,
Nanomaterials x 12, 3778
2022, 8 of 13
8 of 13
Figure
Figure 5. (A)
5. (A) Removal
Removal percentageversus
percentage versus time
time at
at different
differentdye
dyeconcentrations, (B) (B)
concentrations, nonlinear pseudo-
nonlinear pseudo-
first-order, (C) nonlinear pseudo-second-order, and (D) nonlinear Elovich sorption kinetics
first-order, (C) nonlinear pseudo-second-order, and (D) nonlinear Elovich sorption kinetics of CR dyeof CR
◦ and pH 7.
dyeat at25
25 C°C and pH 7.
Table Parameters
To 1.select the ofbest
the nonlinear kinetic models
adsorption for CR
kinetics dye adsorption
model, on the surfaceperformance
the adsorption of the sample.
of
CNTs/spiral Pseudo-first
nails at various initial CR concentrations
order: Y = qe [1 − exp(−k1 X)]
was examined. Previous reports
stated that the non-linear forms of kinetic models are more suitable than the linear forms
Rate constant = k1 (min−1 ) 0.05335 ± 0.00598
for fitting the experimental data and that nonlinear fitting is more accurate than linear
5 ppm maximum amount of CR uptake = qe (mg/g) 100.66688 ± 2.67081
fitting to obtain the values of the constants for each model [58–60]. By plotting the propor-
2 0.98094
R vs. time, Figure 5B–D depict the first-order,
tion of dye removal percentage second-order,
and Elovich kinetics nonlineark1graphs [61,62]. The adsorption0.04689 ± 0.00559
kinetics parameters for the
10 ppm assessment model; k1, k2, qe, β, qe and α; as well as R2, were derived
92.32928using nonlinear fitting
± 2.43059
and are displayed in Table 1. RThe 2 pseudo-first-order and second-order 0.97063 models are effec-
tive at handling CR adsorption k1 onto the proposed nanoadsorbent 0.03962 ±at low and high CR
0.00817
concentrations, respectively, according
qe
to the nonlinear fit and regression coefficient val-
85.63994 ± 4.24925
20 ppm
ues in Table 1 for all the studied kinetic models. This was further supported by the accu-
R2 0.92628
rate approximation between the calculated dye removal percentage and the experimental
removal percentage. According to the first-order model, the rate constant is lowered from
0.053 to 0.040 min−1 by raising the dye concentration from 5 ppm to 20 ppm. With the
pseudo-first-order model at low concentrations and the pseudo-first-order model at high
concentrations, the CR adsorption on CNTs/spiral nails is effectively addressed.Nanomaterials 2022, 12, 3778 9 of 13
Table 1. Cont.
k q2 X
Pseudo-second order: Y = 1+ 2k2eq X
e
Rate constant = k2 (min−1 ) 4.91311 × 10⁻⁴ ± 1.49132 × 10⁻⁴
5 ppm qe (mg/g) 119.81004 ± 7.39609
R2 0.96082
k2 5.02665 × 10⁻⁴ ± 9.92576 × 10⁻⁵
10 ppm qe 108.36312 ± 4.08751
R2 0.97633
k2 4.03958 × 10⁻⁴ ± 1.64286 × 10⁻⁴
20 ppm qe 103.71385 ± 8.88065
R2 0.92994
1
Elovich Kinetic model: Y = β ln(αβX + 1)
Adsorption rate at 0 min = α (mg/min) 11.93295 ± 5.97565
5 ppm The extent of surface coverage = β (g/mg) 0.03643 ± 0.00759
Correlation Coefficient = R2 0.92883
α 10.91733 ± 3.61829
10 ppm β 0.04217 ± 0.00532
R2 0.96147
α 6.42892 ± 3.18597
20 ppm β 0.03914 ± 0.00897
R2 0.89915
3.5. Reusability Test
Figure 6 illustrates a reusability test for CR elimination using the same adsorbent
and dose ten times. The results showed that over the ten adsorption cycles, the removal
percentage of the used adsorbent varied significantly. The dye removal percentage for
our adsorbent was 99.9% at the beginning of the experiment and decreased to ~56.0%
Nanomaterials 2022, 12, x 10 of 13
towards the end. The decrease in the CR removal percentage might be attributed to the CR
molecules adhering to the adsorbent’s surface, which then blocked the surface from the
dissolved CR molecules and resulted in a drop in adsorption capacity [63].
100
B
80
Dye Removal%
60
40
20
0
1 2 3 4 5 6 7 8 9 10
Number of cycle
Figure
Figure 6. Reusability
6. Reusability test of
test of the sample forthe sample
ten cycles. for ten cycles.
4. Conclusions
Here, we introduced a brand-new type of SERS sensor for the detection of heavy
metals (Hg2+ and Cd2+) at ppb concentrations (1–1000) with good sensitivity and selectivity.
On the surface of spiral brass nails functionalized with CoFe2O4 nanoparticles, very long
helical CNTs with diameters < 20 nm were generated by CVD. As a more dependable andNanomaterials 2022, 12, 3778 10 of 13
As a result, a new approach was used to produce high-yield CNTs and to produce
spiral CNTs/brass nails. The samples that are generated can be used to continually detect
and track the levels of harmful heavy metals (Hg2+ and Cd2+ ) in pharmaceuticals, food
processing, and soil. Additionally, recycling industrial wastewater from the paper, tex-
tile, and plastics industries is another application for the developed spiral CNTs/brass
nanoadsorbent.
4. Conclusions
Here, we introduced a brand-new type of SERS sensor for the detection of heavy
metals (Hg2+ and Cd2+ ) at ppb concentrations (1–1000) with good sensitivity and selectivity.
On the surface of spiral brass nails functionalized with CoFe2 O4 nanoparticles, very long
helical CNTs with diameters < 20 nm were generated by CVD. As a more dependable
and sensitive heavy metal sensor, CNTs/nail has been proven. The lowest measurable
concentration at room temperature in this investigation was 1 ppb, and the CNTs/brass
nail sensor demonstrated remarkable sensitivity and selectivity for Hg2+ over Cd2+ . The
direct and high sensitivity, selectivity, low cost of production, low cost of monitoring, and
simplicity of the suggested CNTs/spiral brass nail sensor are all present. Therefore, a
portable Raman spectrometer can use the current sensor as a potent tool to determine
the presence of heavy metal ions on-site. The adsorption activity of helical CNTs/spiral
brass nails is demonstrated as a function of the starting dye concentration and contact
time. For CR dye solutions with concentrations of 5, 10, and 20 mg/L, the highest removal
percentage was determined to be 99.9%, 85%, and 77%, respectively. The kinetics analysis
reveals that at low and high concentrations, respectively, CR adsorption onto CNTs/spiral
nails is successfully explained by the pseudo-first-order and second-order models. The rate
constant decreases from 0.053 to 0.040 min−1 with an increase in dye concentration from 5
ppm to 20 ppm. Because of this, our sample may be used to effectively degrade CR dye
in wastewater and identify heavy metals. Consequently, a brand-new, reasonably priced
green nanoadsorbent that would aid in the best industrial wastewater recycling might be
produced. The suggested SERS sensor can also be quickly integrated into an automated
signal detection platform on a fabrication-friendly sensing platform for further functionality.
Supplementary Materials: The following supporting information can be downloaded at: https:
//www.mdpi.com/article/10.3390/nano12213778/s1, Figure S1: Reusability test of the of SERS
sensor for ten cycles provided with a table for the descriptive statistics of the results.
Funding: The researcher wishes to extend his sincere gratitude to the Deanship of Scientific Research at
the Islamic University of Madinah for the support provided through the Post-Publishing Program 1/2022.
Institutional Review Board Statement: Not applicable.
Informed Consent Statement: Not applicable.
Data Availability Statement: The data is available on reasonable request from the corresponding author.
Acknowledgments: The author would like to express his appreciation for the support provided by
the Islamic University of Madinah.
Conflicts of Interest: The authors declare no conflict of interest.
References
1. Mrózek, O.; Ecorchard, P.; Vomáčka, P.; Ederer, J.; Smržová, D.; Slušná, M.Š.; Machálková, A.; Nevoralová, M.; Beneš, H. Mg-Al-La
LDH-MnFe2 O4 hybrid material for facile removal of anionic dyes from aqueous solutions. Appl. Clay Sci. 2019, 169, 1–9. [CrossRef]
2. Zhu, S.; Khan, M.A.; Kameda, T.; Xu, H.; Wang, F.; Xia, M.; Yoshioka, T. New insights into the capture performance and
mechanism of hazardous metals Cr3+ and Cd2+ onto an effective layered double hydroxide based material. J. Hazard. Mater. 2022,
426, 128062. [CrossRef] [PubMed]
3. Rady, D.; Shaban, M.; Elsayed, K.N.M.; Hamd, A.; Soliman, N.K.; El-Mageed, H.R.A.; Elzanaty, A.M.; El-Sayed, R.; Morada,
M.; El-Bahy, S.M.; et al. Experimentally and theoretically approaches for Congo red dye adsorption on novel kaolinite-alga
nano-composite. Int. J. Environ. Anal. Chem. 2021, 1–23. [CrossRef]Nanomaterials 2022, 12, 3778 11 of 13
4. Abukhadra, M.R.; Shaban, M. Adsorption removal of safranin dye contaminants from water using various types of natural
zeolite. Silicon 2019, 11, 1635–1647. [CrossRef]
5. Gneedy, A.H.; Dryaz, A.R.; Said, M.S.; Ahmed, S.A.; Soliman, N.K.; AlMohamadi, A.H.; Elsayed, R. Application of marine algae
separate and in combination with natural zeolite in dye adsorption from wastewater; A review. Egypt. J. Chem. 2022. [CrossRef]
6. Wang, Q.H.; Yan, M.; Chang, R.P.H. Flat panel display prototype using gated carbon nanotube field emitters. Appl. Phys. Lett.
2001, 78, 1294–1296. [CrossRef]
7. Agnihotri, S.; Rood, M.J.; Rostam-Abadi, M. Adsorption equilibrium of organic vapors on single-walled carbon nanotubes. Carbon
2005, 43, 2379–2388. [CrossRef]
8. Tan, X.; Fang, M.; Chen, C.; Yu, S.; Wang, X. Counterion effects of nickel and sodium dodecylbenzene sulfonate adsorption to
multiwalled carbon nanotubes in aqueous solution. Carbon 2008, 46, 1741–1750. [CrossRef]
9. Rakhi, R.; Sethupathi, K.; Ramaprabhu, S. Synthesis and hydrogen storage properties of carbon nanotubes. Int. J. Hydrogen Energy
2008, 33, 381–386. [CrossRef]
10. Chen, C.; Hu, J.; Shao, D.; Li, J.; Wang, X. Adsorption behavior of multiwall carbon nanotube/iron oxide magnetic composites for
Ni(II) and Sr(II). J. Hazard. Mater. 2009, 164, 923–928. [CrossRef]
11. Chen, C.-H.; Huang, C.-C. Hydrogen adsorption in defective carbon nanotubes. Sep. Purif. Technol. 2009, 65, 305–310. [CrossRef]
12. Li, Y.-H.; Ding, J.; Luan, Z.; Di, Z.; Zhu, Y.; Xu, C.; Wu, D.; Wei, B. Competitive adsorption of Pb2+ , Cu2+ and Cd2+ ions from
aqueous solutions by multiwalled carbon nanotubes. Carbon 2003, 41, 2787–2792. [CrossRef]
13. Li, Y.-H.; Wang, S.; Wei, J.; Zhang, X.; Xu, C.; Luan, Z.; Wu, D.; Wei, B. Lead adsorption on carbon nanotubes. Chem. Phys. Lett.
2002, 357, 263–266. [CrossRef]
14. Ferreira, G.M.D.; Ferreira, G.M.D.; Hespanhol, M.C.; Rezende, J.D.; Pires, A.C.D.; Gurgel, L.V.A.; da Silva, L.H.M. Adsorption of
red azo dyes on multi-walled carbon nanotubes and activated carbon: A thermodynamic study. Colloid Surf. A 2017, 529, 531–540.
[CrossRef]
15. Karimifard, S.; Moghaddam, M.R.A. Removal of an anionic reactive dye from aqueous solution using functionalized multi-walled
carbon nanotubes: Isotherm and kinetic studies. Desalin. Water Treat. 2016, 57, 16643–16652. [CrossRef]
16. Ali, I.; Alharbi, O.M.L.; Alothman, Z.A.; Al-Mohaimeed, A.M.; Alwarthan, A. Modeling of fenuron pesticide adsorption on CNTs
for mechanistic insight and removal in water. Environ. Res. 2019, 170, 389–397. [CrossRef]
17. Vuono, D.; Catizzone, E.; Aloise, A.; Policicchio, A.; Agostino, R.G.; Migliori, M.; Giordano, G. Modelling of adsorption of textile
dyes over multi-walled carbon nanotubes: Equilibrium and kinetic. Chin. J. Chem. Eng. 2017, 25, 523–532. [CrossRef]
18. Baghapour, M.A.; Pourfadakari, S.; Mahvi, A.H. Investigation of Reactive Red Dye 198 removal using multiwall carbon nanotubes
in aqueous solution. J. Ind. Eng. Chem. 2014, 20, 2921–2926. [CrossRef]
19. Burakova, E.A.; Dyachkova, T.P.; Rukhov, A.V.; Tugolukov, E.N.; Galunin, E.V.; Tkachev, A.G.; Basheer, A.A.; Ali, I. Novel and
economic method of carbon nanotubes synthesis on a nickel magnesium oxide catalyst using microwave radiation. J. Mol. Liq.
2018, 253, 340–346. [CrossRef]
20. Machado, F.M.; Carmalin, S.A.; Lima, E.C.; Dias, S.L.P.; Prola, L.D.T.; Saucier, C.; Jauris, I.M.; Zanella, I.; Fagan, S.B. Adsorption of
Alizarin Red S Dye by Carbon Nanotubes: An Experimental and Theoretical Investigation. J. Phys. Chem. C 2016, 120, 18296–18306.
[CrossRef]
21. Sheibani, M.; Ghaedi, M.; Marahel, F.; Ansari, A. Congo red removal using oxidized multiwalled carbon nanotubes: Kinetic and
isotherm study. Desalin. Water Treat. 2015, 53, 844–852. [CrossRef]
22. Szlachta, M.; Wójtowicz, P. Adsorption of methylene blue and Congo red from aqueous solution by activated carbon and carbon
nanotubes. Water Sci. Technol. 2013, 68, 2240–2248. [CrossRef] [PubMed]
23. Ramazani, S.; Ghaedi, M.; Mortazavi, K. Multiwalled carbon nanotubes as efficient adsorbent for the removal of congo red.
Fresen. Environ. Bull. 2011, 20, 2514–2520.
24. Selen, V.; Güler, Ö. Modeling of Congo Red Adsorption onto Multi-walled Carbon Nanotubes Using Response Surface Methodol-
ogy: Kinetic, Isotherm and Thermodynamic Studies. Arab. J. Sci. Eng. 2021, 46, 6579–6592. [CrossRef]
25. Kasumov, A.Y.; Deblock, R.; Kociak, M.; Reulet, B.; Bouchiat, H.; Khodos, I.I.; Gorbatov, Y.B.; Volkov, V.T.; Journet, C.; Burghard,
M. Supercurrents Through Single-Walled Carbon Nanotubes. Science 1999, 284, 1508–1511. [CrossRef]
26. Chun, K.-Y.; Oh, Y.; Rho, J.; Ahn, J.-H.; Kim, Y.-J.; Choi, H.R.; Baik, S. Highly conductive, printable and stretchable composite
films of carbon nanotubes and silver. Nat. Nanotechnol. 2010, 5, 853–857. [CrossRef]
27. Kim, J.-Y.; Lee, W.H.; Suk, J.W.; Potts, J.R.; Chou, H.; Kholmanov, I.N.; Piner, R.D.; Lee, J.; Akinwande, D.; Ruoff, R.S. Chlorination
of Reduced Graphene Oxide Enhances the Dielectric Constant of Reduced Graphene Oxide/Polymer Composites. Adv. Mater.
2013, 25, 2308–2313. [CrossRef]
28. Yoon, Y.; Samanta, K.; Lee, H.; Lee, K.; Tiwari, A.P.; Lee, J.; Yang, J.; Lee, H. Highly Stretchable and Conductive Silver Nanoparticle
Embedded Graphene Flake Electrode Prepared by In situ Dual Reduction Reaction. Sci. Rep. 2015, 5, srep14177. [CrossRef]
29. Li, D.-W.; Zha, W.-L.; Li, Y.-T.; Long, Y.-T. Recent progress in surface enhanced Raman spectroscopy for the detection of
environmental pollutants. Microchim. Acta 2014, 181, 23–43. [CrossRef]
30. Shaban, M.; Hady, A.G.A.; Serry, M. A New Sensor for Heavy Metals Detection in Aqueous Media. IEEE Sens. J. 2014, 14, 436–441.
[CrossRef]
31. Shaban, M.; Galaly, A.R. Highly Sensitive and Selective In-Situ SERS Detection of Pb2+ , Hg2+ , and Cd2+ Using Nanoporous
Membrane Functionalized with CNTs. Sci. Rep. 2016, 6, 25307. [CrossRef]Nanomaterials 2022, 12, 3778 12 of 13
32. Ahmed, A.M.; Shaban, M. Nanoporous chromium thin film for active detection of toxic heavy metals traces using surface-
enhanced Raman spectroscopy. Mater. Res. Express 2020, 7, 015084. [CrossRef]
33. Wei, H.; Abtahi, S.M.H.; Vikesland, P.J. Plasmonic colorimetric and SERS sensors for environmental analysis. Environ. Sci. Nano
2015, 2, 120–135. [CrossRef]
34. Gogotsi, Y.; Presser, V. Carbon Nanomaterials; CRC Press: Boca Raton, FL, USA, 2013.
35. Su, S.; Wu, W.; Gao, J.; Lu, J.; Fan, C. Nanomaterials-based sensors for applications in environmental monitoring. J. Mater. Chem.
2012, 22, 18101–18110. [CrossRef]
36. Ajayan, P.M.; Zhou, O.Z. Applications of carbon nanotubes. In Carbon Nanotubes; Springer: Berlin/Heidelberg, Germany, 2001;
Volume 80, pp. 391–425.
37. Zhang, M.; Zou, Y.; Zhou, X.; Yan, F.; Ding, Z. Vertically-Ordered Mesoporous Silica Films for Electrochemical Detection of Hg(II)
Ion in Pharmaceuticals and Soil Samples. Front. Chem. 2022, 10, 952936. [CrossRef]
38. Huang, R.; Zhang, K.; Sun, H.; Zhang, D.; Zhu, J.; Zhou, S.; Li, W.; Li, Y.; Wang, C.; Jia, X.; et al. Star-shaped porous nitrogen-doped
metal-organic framework carbon as an electrochemical platform for sensitive determination of Cd(II) in environmental and
tobacco samples. Anal. Chim. Acta 2022, 1228, 340309. [CrossRef]
39. Patle, A.; Kurrey, R.; Deb, M.K.; Patle, T.K.; Sinha, D.; Shrivas, K. Analytical approaches on some selected toxic heavy metals in
the environment and their socio-environmental impacts: A meticulous review. J. Indian Chem. Soc. 2022, 99, 100545. [CrossRef]
40. Yan, Z.; Cai, Y.; Zhang, J.; Zhao, Y. Fluorescent sensor arrays for metal ions detection: A review. Measurement 2022, 187, 110355.
[CrossRef]
41. Soliman, N.K.; Moustafa, A.F.; Aboud, A.A.; Halim, K.S.A. Effective utilization of Moringa seeds waste as a new green
environmental adsorbent for removal of industrial toxic dyes. J. Mater. Res. Technol. 2019, 8, 1798–1808. [CrossRef]
42. Khedr, M.; Halim, K.A.; Soliman, N. Synthesis and photocatalytic activity of nano-sized iron oxides. Mater. Lett. 2009, 63, 598–601.
[CrossRef]
43. Eklund, P.; Holden, J.; Jishi, R. Vibrational modes of carbon nanotubes; Spectroscopy and theory. Carbon 1995, 33, 959–972.
[CrossRef]
44. Dresselhaus, M.S.; Eklund, P.C. Phonons in carbon nanotubes. Adv. Phys. 2000, 49, 705–814. [CrossRef]
45. Shaban, M.; Abdelkarem, K.; El Sayed, A.M. Structural, optical and gas sensing properties of Cu2 O/CuO mixed phase: Effect of
the number of coated layers and (Cr + S) co-Doping. Phase Transit. 2019, 92, 347–359. [CrossRef]
46. Georgiadou, V.; Tangoulis, V.; Arvanitidis, I.; Kalogirou, O.; Samara, C.D. Unveiling the physicochemical features of CoFe2O4
nanoparticles synthesized via a variant hydrothermal method: nmR relaxometric properties. J. Phys. Chem. C 2015, 119, 8336–8348.
[CrossRef]
47. Singh, S.; Munjal, S.; Khare, N. Strain/defect induced enhanced coercivity in single domain CoFe2 O4 nanoparticles. J. Magn.
Magn. Mater. 2015, 386, 69–73. [CrossRef]
48. Lim, S.P.; Pandikumar, A.; Lim, Y.S.; Huang, N.M.; Lim, H.N. In-situ electrochemically deposited polypyrrole nanoparticles
incorporated reduced graphene oxide as an efficient counter electrode for platinum-free dye-sensitized solar cells. Sci. Rep. 2014,
4, 5305. [CrossRef]
49. Serry, M.; Gamal, A.; Shaban, M.; Sharaf, A. High sensitivity optochemical and electrochemical metal ion sensor. Micro Nano Lett.
2013, 8, 775–778. [CrossRef]
50. Soleimani, M.; Afshar, M.G.; Sedghi, A. Amino-Functionalization of Multiwall Carbon Nanotubes and Its Use for Solid Phase
Extraction of Mercury Ions from Fish Sample. ISRN Nanotechnol. 2013, 2013, 674289. [CrossRef]
51. Shaban, M.; Ali, M.; Abdel-Hady, K.; Hamdy, H. Self- Agglomeration of Tin Nanoparticle Array on Porous Anodic Alumina
Membranes: Fabrication and Characterization. Curr. Nanosci. 2015, 11, 214–221. [CrossRef]
52. Dehghani, M.H.; Faraji, M.; Mohammadi, A.; Kamani, H. Optimization of fluoride adsorption onto natural and modified pumice
using response surface methodology: Isotherm, kinetic and thermodynamic studies. Korean J. Chem. Eng. 2017, 34, 454–462. [CrossRef]
53. Mohamed, H.S.; Soliman, N.; Moustafa, A.; Abdel-Gawad, O.F.; Taha, R.R.; Ahmed, S.A. Nano metal oxide impregnated
Chitosan-4-nitroacetophenone for industrial dye removal. Int. J. Environ. Anal. Chem. 2019, 101, 1850–1877. [CrossRef]
54. Sharma, Y.C. Uma Optimization of Parameters for Adsorption of Methylene Blue on a Low-Cost Activated Carbon. J. Chem. Eng.
Data 2009, 55, 435–439. [CrossRef]
55. Chatterjee, S.; Lee, M.W.; Woo, S.H. Adsorption of congo red by chitosan hydrogel beads impregnated with carbon nanotubes.
Bioresour. Technol. 2010, 101, 1800–1806. [CrossRef]
56. Zare, K.; Sadegh, H.; Shahryari-Ghoshekandi, R.; Maazinejad, B.; Ali, V.; Tyagi, I.; Agarwal, S.; Gupta, V.K. Enhanced removal of
toxic Congo red dye using multi walled carbon nanotubes: Kinetic, equilibrium studies and its comparison with other adsorbents.
J. Mol. Liq. 2015, 212, 266–271. [CrossRef]
57. Wu, C.-H. Adsorption of reactive dye onto carbon nanotubes: Equilibrium, kinetics and thermodynamics. J. Hazard. Mater. 2007,
144, 93–100. [CrossRef]
58. Lin, J.; Wang, L. Comparison between linear and non-linear forms of pseudo-first-order and pseudo-second-order adsorption
kinetic models for the removal of methylene blue by activated carbon. Front. Environ. Sci. Eng. China 2009, 3, 320–324. [CrossRef]
59. Shukla, S.P.; Kisku, G.C. Linear and Non-Linear Kinetic Modeling for Adsorption of Disperse Dye in Batch Process. Res. J. Environ.
Toxicol. 2015, 9, 320–331. [CrossRef]Nanomaterials 2022, 12, 3778 13 of 13
60. López-Luna, J.; Ramírez-Montes, L.E.; Martinez-Vargas, S.; Martínez, A.I.; Mijangos-Ricardez, O.F.; González-Chávez, M.D.C.A.;
Carrillo-González, R.; Solís-Domínguez, F.A.; Cuevas-Díaz, M.D.C.; Vázquez-Hipólito, V. Linear and nonlinear kinetic and
isotherm adsorption models for arsenic removal by manganese ferrite nanoparticles. SN Appl. Sci. 2019, 1, 950. [CrossRef]
61. Hamd, A.; Dryaz, A.R.; Shaban, M.; AlMohamadi, H.; Abu Al-Ola, K.A.; Soliman, N.K.; Ahmed, S.A. Fabrication and Application
of Zeolite/Acanthophora Spicifera Nanoporous Composite for Adsorption of Congo Red Dye from Wastewater. Nanomaterials
2021, 11, 2441. [CrossRef]
62. Dayez, A.; Shaban, M.; AlMohamadi, H.; Al-Ola, K.A.A.; Hamd, A.; Soliman, N.K.; Ahmed, S.A. Design, characterization, and
adsorption properties of Padina gymnospora/zeolite nanocomposite for congo red dye removal from wastewater. Sci. Rep. 2021,
11, 21058.
63. Naghizadeh, A. Regeneration of Carbon Nanotubes Exhausted with Humic Acid Using Electro-Fenton Technology. Arab. J. Sci.
Eng. 2016, 41, 155–161. [CrossRef]You can also read