Influence of the Characteristics of Weather Information in a Thunderstorm-Related Power Outage Prediction System - MDPI
←
→
Page content transcription
If your browser does not render page correctly, please read the page content below
forecasting
Article
Influence of the Characteristics of Weather Information in
a Thunderstorm-Related Power Outage Prediction System
Peter L. Watson * , Marika Koukoula                      and Emmanouil Anagnostou

                                          Department of Civil & Environmental Engineering, University of Connecticut, Storrs, CT 06269, USA;
                                          MARIKA.KOUKOULA@uconn.edu (M.K.); emmanouil.anagnostou@uconn.edu (E.A.)
                                          * Correspondence: peter.watson@uconn.edu

                                          Abstract: Thunderstorms are one of the most damaging weather phenomena in the United States,
                                          but they are also one of the least predictable. This unpredictable nature can make it especially
                                          challenging for emergency responders, infrastructure managers, and power utilities to be able to
                                          prepare and react to these types of events when they occur. Predictive analytical methods could
                                          be used to help power utilities adapt to these types of storms, but there are uncertainties inherent
                                          in the predictability of convective storms that pose a challenge to the accurate prediction of storm-
                                          related outages. Describing the strength and localized effects of thunderstorms remains a major
                                          technical challenge for meteorologists and weather modelers, and any predictive system for storm
                                          impacts will be limited by the quality of the data used to create it. We investigate how the quality
                                          of thunderstorm simulations affects power outage models by conducting a comparative analysis,
                                          using two different numerical weather prediction systems with different levels of data assimilation.
                                We find that limitations in the weather simulations propagate into the outage model in specific and

                                          quantifiable ways, which has implications on how convective storms should be represented to these
Citation: Watson, P.L.; Koukoula, M.;     types of data-driven impact models in the future.
Anagnostou, E. Influence of the
Characteristics of Weather
                                          Keywords: power outages; machine learning; thunderstorms; numerical weather prediction
Information in a Thunderstorm-
Related Power Outage Prediction
System. Forecasting 2021, 3, 541–560.
https://doi.org/10.3390/forecast
                                          1. Introduction
3030034
                                                Weather-related power outages, and the severe weather events that cause them, pose
Academic Editor: Sonia Leva               a persistent threat to the functioning of the infrastructure and economy of the United States.
                                          These types of power outages affect millions of people and cost the U.S. economy tens
Received: 27 June 2021                    of billions of dollars every year; moreover, the rate at which they occur appears to be
Accepted: 3 August 2021                   increasing [1]. Anticipating the damages that storms can cause is a critical step in electrical
Published: 5 August 2021                  utility managers’ storm outage management process. They need reliable information before
                                          a storm to be able to stage repair crews and effectively prepare for the damages that the
Publisher’s Note: MDPI stays neutral      storm will cause [2]. As such, there has been a recent surge in research and development
with regard to jurisdictional claims in   activity into methods to predict storm damages and weather-related power outages.
published maps and institutional affil-         Arguably, the most destructive types of storms in the United States are thunderstorms,
iations.                                  including the associated convective phenomena (tornadoes, microbursts, hail, etc). While
                                          hurricanes often receive special attention because they are larger and more dramatic,
                                          thunderstorms are more common and cause more damage to the electrical infrastructure
                                          every year than any other type of weather. Indeed, investigations of major outage events
Copyright: © 2021 by the authors.         reported to the Department of Energy have found that convective storms are responsible
Licensee MDPI, Basel, Switzerland.        for the majority of weather-related outage events, the greatest number of customer outages,
This article is an open access article    and the most outage hours [3,4]. Additionally there is every indication that the severity
distributed under the terms and           of thunderstorms is going to increase in the future. Changes in the climatic patterns of
conditions of the Creative Commons        thunderstorms can already be seen in a time series analysis [5], and long-term climate
Attribution (CC BY) license (https://
                                          projections suggest that, because of climate change, thunderstorms are likely to become
creativecommons.org/licenses/by/
                                          stronger, more frequent, and more damaging [6,7].
4.0/).

Forecasting 2021, 3, 541–560. https://doi.org/10.3390/forecast3030034                                    https://www.mdpi.com/journal/forecasting
Forecasting 2021, 3 542
Despite the demonstrated risk that thunderstorms present to the electrical infrastruc-
ture, they have not received much attention in the recent research for modeling weather-
related power outages. While there are some outage modeling approaches that are gen-
eralized to a range of types of weather [8–11], much of research in this field has been
focused on other types of storms. The vast majority of the work has focused on tropical
storms and hurricanes, which can have particularly dramatic impacts [12–16], but sev-
eral mature modeling approaches, specifically for extratropical storms [17–19], have also
been developed.
In the existing general outage models, thunderstorms are sometimes included in
the analysis [9,10,20,21], but the weather characteristics of these storms are treated in a
similar fashion to other, more structured types of weather. There are also some studies that
infer a focus on thunderstorms by including information about lightning strikes [11,22,23],
but do not have an explicit focus on thunderstorms because they also include other types
of weather events in their analysis.
This lack of focus on thunderstorms may be a result of the technical difficulty associ-
ated with describing and simulating them. Convective storms are particularly challenging
for established numerical weather prediction (NWP) models and meteorological forecasts.
While the increased horizontal resolution of convective-allowing configurations can lead
to improved simulations, even with state-of-the-art high-resolution NWP models, reli-
able deterministic forecasts of thunderstorms longer than several hours are elusive [24–26].
As Yano et al. describe, there may be limitations to modern NWP models’ ability to simulate
convective storms because of the wide-spread use of assumptions and parameterizations
that are reasonable for synoptic-scale weather patterns but are much less applicable to
more complex convective phenomena [26]. These potential limitations of NWP simulations
are long standing, and multiple strategies for mitigating them have emerged. Assimilating
radar or even lightning observations into initial conditions of simulations can be used
to improve short-term predictions [27,28]; forecasting systems that leverage this type of
data assimilation for rapidly-updating nowcasts are currently operational [29]. In addition,
for forecasts longer than several hours, stochastic predictions from convective-allowing
ensembles have shown an improved forecasting skill by being able to capture the range of
potential outcomes, instead of one deterministic scenario [30–32].
Similar approaches and findings can be seen in the few studies in the literature that
specifically focus on predicting thunderstorm-related power outages. In Alpay et al.,
the authors take a rapid-refresh nowcasting approach to modeling thunderstorm-related
outages, using an LSTM neural network trained on data from a rapidly updating radar-
ingesting weather model from NOAA [33]. The works of Shield and Kabir et al. both
describe a thunderstorm outage prediction system trained on weather data from the
National Digital Forecast Database for an area in Alabama [34,35]. Shields investigates
the limitations of the model he develops and identifies that it has better skill at a synoptic
scale, which illustrates the difficulty of forecasting with thunderstorms [34]. Kabir et al.
take a more stochastic approach and develop a quantile regression model, which allows
the communication of the significant uncertainties associated with predicting the impacts
of thunderstorms [35].
While this previous work attempts to manage the known limitations of weather
simulations of thunderstorms, how these limitations propagate from weather simulations
into machine-learning based impact models remains poorly described. The problem
of poor inputs for a computational algorithm has been recognized since the dawn of
computation [36], but the effects in this context are not fully understood. In this paper,
we attempt to shed light on this matter by analyzing the quality of the weather data from
two different weather simulation systems with differing amounts of data assimilation,
determine how outage models trained on these different sets of weather data differ in skill
and accuracy, and what information the outage models learn from. This knowledge is
critical to build an understanding of the limitations of the data used to build impact modelsForecasting 2021, 3 543
for thunderstorms and to suggest how improved representations of weather will improve
the quality of the insights that can be derived from them.
2. Materials and Methods
This study involved the creation and comparison of two separate machine-learning
models designed to predict thunderstorm-related power outages, using data from NWP-
based weather simulations and a wide range of other data sources in a region covering
three states: Connecticut, Massachusetts, and New Hampshire, and five distinct electrical
utility service territories: Eversource Connecticut (CT), Eversource Western Massachusetts
(WMA), Eversource Eastern Massachusetts (EMA), Eversource New Hampshire (NH),
and AVANGRID United Illuminating (UI). For geographical details of the modeling domain,
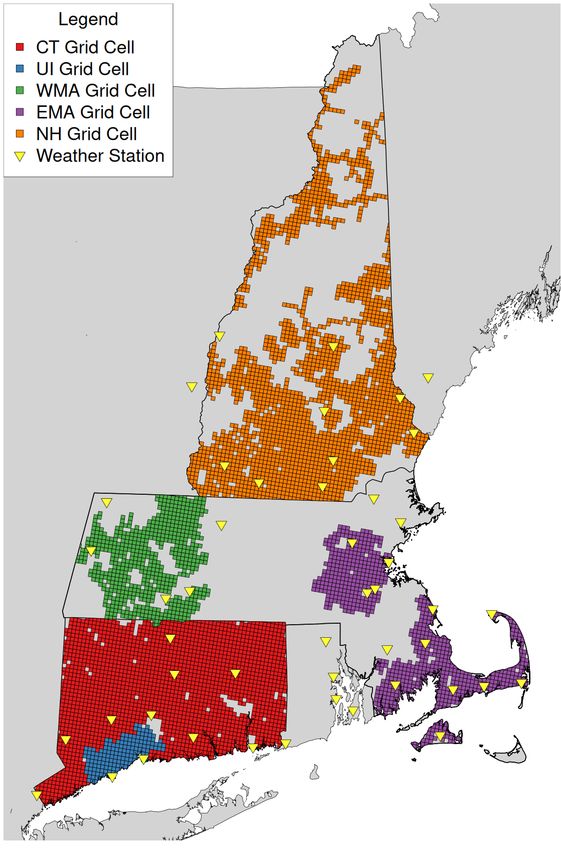
refer to Figure 1.
Figure 1. The location of the outage model grid cells by service territory as well as the location of the
airport weather stations used in the meteorological analysis.Forecasting 2021, 3 544
2.1. Data
The outage models developed in this analysis use data describing 372 thunderstorm
events that occurred in the utility service territories from 2016 to 2020, as well as a range of
environmental characteristics, such as vegetation and drought status, as well as proprietary
outage and infrastructure data provided by the power utilities, aggregated to the grid
cells of the weather simulations. We included as many thunderstorm events that could
be observed in weather station reports from each utility service territory, and aggregated
the data to the RTMA grid cells of each service territory for each thunderstorm event.
For details about the amount of data used from each territory, see Table 1.
Table 1. The amount of data available for training the thunderstorm-related outage models.
CT WMA EMA NH UI Total
Number of Storms 74 82 69 91 56 372
Territory Grid Cells 2019 638 820 2128 169 5774
Total Entries 149,406 52,316 56,580 193,648 9464 461,414
2.1.1. Weather
The core of the analysis centers around datasets produced by two separate NWP
gridded weather simulation systems: a hybrid NOAA analysis system, and a WRF 2 km
simulation system. The NOAA analysis dataset is a combination of data from the Real-
Time Mesoscale Analysis (RTMA) [37] and Stage IV Quantitative Precipitation Estimates
(Stage IV) [38]. RTMA is a weather analysis product that produces a gridded estimate of
weather conditions by statistically downscaling a 1 h short-term forecast and adjusting it
with weather station observations. It produces a high-resolution, near real-time estimate
of temperature, humidity, dew point, wind speed and direction, wind gusts, and surface
pressure for the entire United States. The RTMA data were sourced from the archive hosted
on the Google Earth Engine [39]. Stage IV is a Quantitative Precipitation Estimate (QPE)
dataset created by the National Weather Service and the National Centers for Environmental
Prediction (NWS, NCEP), using a blend of NEXRAD radar and the NWS River Forecast
Center precipitation processing system [40]. It takes gridded precipitation estimates derived
from radar scans, adjusts the values based on rain gauge data, and aggregates the data to
produce gridded hourly estimates of precipitation for the continental United States. It is
popular for analytical purposes and is often used as a reference to analyze the accuracy of
satellite and other precipitation estimates [38]. By using a blend of RTMA and Stage IV, we
are able to have a reasonable estimate of the average hourly weather conditions in each
grid cell during each storm used in this analysis. For the sake of brevity, this dataset will
sometimes be referred to as the “RTMA” system.
We compare this hybrid NOAA analysis dataset with another weather dataset devel-
oped from a configuration of the Weather Research and Forecasting Model (WRF), similar
to one that was used in several outage predictions models [17,18], but with an increased
horizon resolution to potentially help resolve convection. This model is initialized with
the North American Mesoscale Forecast System analysis [41], which has 2 km horizontal
grid spacing with one 6 km external domain. For configuration details, please see Table 2.
These WRF simulations use a different projection than the RTMA system, so the results
were resampled with bilinear interpolation to match the spatial characteristics of the RTMA
analysis product.Forecasting 2021, 3 545
Table 2. Details of the WRF simulation configuration.
Horizontal Resolution 2 km
Vertical Levels 51
Horizontal Grid Scheme Arakawa C Grid
Nesting One 6km Nested Domain
Microphysics Option Thompson Graupel Scheme [42]
Longwave Radiation Option RRTM Scheme [43]
Shortwave Radiation Option Goddard Shortwave Scheme [44]
Surface-Layer Option Revised MM5 Scheme [45]
Land-Surface Option Noah Land-Surface Model [46]
Planetary Boundary Layer Yonsei Scheme [47]
For outage modeling purposes, 24 h time series of a common set of weather variables
generated from both weather simulation systems were processed to generate descriptive
data features for each thunderstorm in this analysis. The weather variables considered
are dew point temperature, specific humidity, air temperature, surface pressure, wind
speed, wind gust speed, wind direction, and hourly precipitation rate. Established weather
parameters that directly describe convective potential, such as CAPE and CIN, were
unfortunately not available for this study because they are not published in RTMA, which
is primarily a surface analysis product. For each of the included variables, the mean, max,
minimum, standard deviation, 4 h mean during peak winds, and total were calculated for
each storm, except for wind direction for which we took the median value. The median
was taken to limit its sensitivity to outliers. Several additional features were calculated: the
number of hours of winds above various wind speeds, calculated using various thresholds
applied to wind speeds and gusts; typical wind direction by taking the mean of the
median wind direction of included storms; and the difference between the typical wind
direction and the median wind direction for that storm. To preserve its characteristics, all
computation and analysis of wind direction was performed via the circular library in
R [48]. Additionally, we included an additional set of features describing the time series of
wind stress exerted on the trees by taking the product of the leaf area index (see below)
and the square of the wind speed. For details, please see Appendix A, which contains a
detailed table of all data features used for modeling.
2.1.2. Infrastructure and Outage Data
Proprietary data of the infrastructure and historical outages are made available for
this study for the five utility service territories. Using rgdal and rgeos [49,50] for the
area within each outage model grid cell, we calculated the length of overhead power
lines, the number of utility poles, the number of fuses and cutouts, and the number of
circuit reclosers.
The historic outage data describes the time and location of where damage occurred
to the power distribution grid for a period of five years (2016 to 2020). Based on this
information, we were able to calculate the number of damage locations within each outage
model grid cell associated with each storm. A damage location is a physical location where
repair crews are dispatched to repair damage after a storm. In the vast majority of cases,
this meant counting the damage locations that were identified in the 24 h storm period,
but in several cases, additional “nested” storm-related outages were recognized by utility
operators after the storm period, so a longer window was sometimes used. These damage
data were extracted from the utility outage management system, which is a software tool
used by most large utilities to identify outages and dispatch repair crews.Forecasting 2021, 3 546
2.1.3. Environmental Data
Because weather-related power outages are the result of interactions between the
weather, the infrastructure and the environment, a range of environmental information was
considered for this analysis. We processed the environmental data in several different ways
depending on spatial resolution. When working with datasets with a resolution higher than
the 2.5 km RTMA grid, for each grid cell, the raster data were sampled from a 60 m buffer
around the overhead lines in that cell, and we calculated the representative percentage
for the categorical data, or the average and standard deviation for the numerical data.
We applied this process to a range of datasets, including the following: categorical land
cover from the 2016 National Land Cover Database (NLCD) [51], 2016 NLCD Tree Canopy
Coverage [52], vegetation height estimates from the Global Ecosystem Dynamics Investi-
gation (GEDI) lidar instrument on the International Space Station [53], USGS 3DEP DEM
elevation [54], and several other datasets, which required special processing. For example,
we sampled the soils dataset developed by Watson et al. [18] from the USDA SSURGO
database [55] to describe the soil characteristics (density, porosity, hydraulic conductivity,
composition, and saturation). Additionally, because that previous work suggests that
systemic biases caused by differences in the elevations of the weather predictions and the
infrastructure may be present, we used the difference between those two elevations as an
additional feature, elvDiff.
As seen in other outage modeling work [15,16], high-resolution data from the Indi-
vidual Tree Species Parameter Maps (developed to support the USDA National Insect and
Disease Risk Map) were used to calculate information about the density of the forest and
the presence of various tree species [56]. However, because these data contain information
about 264 individual tree species, we aggregated the basal area and stand density index
of the species data by wood type (hardwood or softwood). Additionally, we were able
to calculate the mean and standard deviation of the basal area (BA), stand density index
(SDI), quadratic mean diameter (DQ), total frequency (TF), and trees per acre (TPA) for
all trees, and generate statistics for the area around the infrastructure as described in the
previous paragraph.
Data at the courser resolutions were handled more simply by sampling the data using
the centroid of the grid cell. This included data describing the climatological leaf area
index generated by Cerrai et al. [9], and a collection of drought indices published by the
West Wide Drought Tracker [57]. While drought data was used in outage modeling in the
past [12,15], we included more information, including the 1, 3 and 12 month Standardized
Precipitation Index (SPI) of the month of the storm, as well as 12 month SPI from 1 to
5 years before the storm occurred. This information was included to capture not only the
immediate drought conditions, but also any lingering effects of long-term drought stress
on the vegetation.
2.2. Outage Modeling
To generate a robust outage prediction system based on the 131 data features, gener-
ated via the processes described in the previous section, additional steps were taken to
confirm each variable’s importance for the modeling outage, tune the model’s hyperpa-
rameters, and test the system’s performance via cross-validation. All modeling processes
were coded in R [58], using a range of support libraries.
Variable importance for modeling was initially confirmed via a Boruta variable selec-
tion process. This process involves calculating the variable importance in a random forest
model, and comparing each variable’s importance against the importance of a randomized
variable with the same distribution of values. Over many iterations, this process can
confirm the importance of each variable in a dataset in comparison to random noise [59].
This was implemented via the Boruta R library [60].
Based on experience and the previous literature [9,10,18], we chose the Bayesian
Additive Regression Tree (BART) model for this analysis [61], implemented via the BART
R library [62]. While this is a quantile regression algorithm, we simplified outputs toForecasting 2021, 3 547
deterministic predictions for each storm by taking the mean of the outputs of the model.
The hyperparameters used by the BART algorithm (sparse parameters a and b, shrinkage
parameter k, the number of trees, the number of posterior draws, and the number of
iterations used to initialize the Monte-Carlo Markov Chains) were tuned for this dataset
via differential evolution [63] implemented via the DEoptim library [64]. It was used to find
the optimal configuration of the BART algorithm based on the mean root mean square
logarithmic error (RMSLE) of a fixed 5-fold cross-validation of the RTMA system dataset.
To maintain comparability, these optimized hyperparameter values were consistently
applied to all models and experiments in this analysis. RMSLE was chosen because it is
less sensitive to extreme errors.
2.3. Analysis
To understand the differences between the hybrid NOAA analysis dataset, the WRF
simulation dataset, and the outage prediction models built on them, we evaluated each
weather simulation’s ability to represent the local weather conditions by comparing its
predictions against weather station observations. Then, to understand the different qualities
of the two outage models, as well as evaluate the importance of individual and groups of
variables in the outage models, we compared the cross-validation results, using traditional
and spatial error metrics.
More specifically, to evaluate the two-gridded weather simulations, data were col-
lected from METAR and SPECI reports via the Integrated Surface Data archive maintained
by the National Centers for Environmental Information [65]. Any data flagged with qual-
ity issues were removed, and all observations reported were averaged for every hour to
produce a 24 h time series. Any station or variable with more than two hours of missing
data were removed from the analysis. Then, the same summary statistics used to generate
the outage model features (mean, minimum, maximum, standard deviation, total, 4 h
mean during peak winds) were calculated based on the weather station observations. Any
mean or maximum gust values reported as zero by the weather stations were also removed
from consideration.
For this analysis, all weather stations in the proximity of the outage prediction service
territories were considered, with the exception of Northern New Hampshire. We removed
that area from consideration because it is dominated by the White Mountains, and the
complex topography would cause biased results. See Figure 1 for the detailed weather
station location information used in this analysis. While additional data cleaning steps are
common when this process is used for weather model evaluation, we determined that this
would not be appropriate because the localized differences between the weather station
observations and gridded NWP data are of interest.
The outage model performance was evaluated using leave-one-date-out cross-validation.
This validation process simulates the operational predictability of the outages caused by
each weather event by iteratively isolating the information of each storm event, and testing
the model’s ability to predict it. More specifically, for each storm date and time present in
the database of storms, we reserved the data from that date and time, trained the outage
model on the remaining data, and tested that trained model on the reserved data. This
way, we had a comprehensive evaluation of all storms in our database, but prevented
any spatial or temporal correlations in the weather data from influencing the model
performance. While 372 thunderstorm events were considered in this analysis, because of
overlapping times, each outage model was only trained and tested 226 times for this
cross-validation. To evaluate the overall cross-validation results, we calculated the median
absolute percent error (MdAPE), mean absolute percent error (MAPE), centered root mean
squared error (CRMSE), correlation coefficient (R2 ), and the Nash–Suttcliffe efficiency
(NSE) [66]. For definitions of these error metrics, please see Appendix C.
Because the spatial predictability of thunderstorm outages is also of interest, we also
applied the fraction skill score (FSS) to evaluate the spatial skill of the outage models. FSS
uses a threshold, or a series of thresholds, to generate binary rasters of predictions andForecasting 2021, 3 548
actual values, and compares the two within a series of neighborhoods [67]. A skillful model
is able to predict a similar fraction of values above the threshold as the actual in a small
area. This metric is becoming a widely accepted method to evaluate the spatial skill of
precipitation forecasts, especially in the U.S. [68]. Under ideal conditions, an FSS value
greater than 0.5 indicates a “useful” skill, but depending on the conditions of the baseline
performance (FSSuni f orm ), it is subject to change as defined by the following equation:
FSSuni f orm = 0.5 + FSSrandom /2 (1)
where FSSrandom is the total of the derived binary raster, divided by the number of cells in
the domain [67]. For precipitation, the threshold tends to increase with smaller domains
and as the prevalence of precipitation increases [69]. For this analysis, we calculated
the FSS for each storm by service territory for a range of scales (3 × 3 to 21 × 21 cells),
and outage thresholds between upscaled outage predictions and actual outages via the
validation library [70]. Upscaling the predicted and actual values for the FSS calculation
was important because the resolution of our model and the frequency of actual damages
is such that the actual values are extremely zero-inflated and very sparse (96.3% zeros,
and mean of 0.048 damages per grid cell). The outage model predictions however, tend to
be small (median of 0.0292 and 0.0314 for RTMA and WRF systems respectively) and are
more evenly distributed. This difference in spatial distribution was minimized by applying
boxcar smoothing to a small 3 × 3 neighborhood on both the actual and predicted outages
for each event and territory via the SpatialVx library [71]. While this process effectively
degrades the precision of the analysis, it generates more continuously distributed values
that are more comparable, while not affecting the total number of damage locations for
each event.
To measure the variable importance of each outage model, we applied the variable
permutation technique described by Fisher et al. [72] via the DALEX library in R [73]. This
technique is model agnostic and uses a loss function to measure model performance
as the input variables are perturbed. This allows for a quantitative understanding of
each variable’s influence on the model performance. Doing this evaluation via cross-
validation would be prohibitively complex and computationally expensive, so to evaluate
the variable importance within the outage models, all available data were used to train
the models before variable importance was measured. In addition, because there is a
significant random component in this analysis, we calculated this variable importance over
ten iterations for both outage models, and calculated the confidence intervals. The loss
metric used to evaluate variable importance, root mean squared logarithmic error (RMSLE),
was chosen because it is robust to the inclusion of zeros and is less sensitive to rare cases
of extreme errors, which can be present because of the statistical distribution of actual
outages as described above. However, because it is a logarithmic error metric, differences
in RMSLE can often appear small, despite being significant.
3. Results
3.1. Weather Analysis
As demonstrated in Figure 2, the NOAA analysis dataset represents almost all weather
parameters used in the outage models more accurately than the WRF simulation dataset.
Very significant differences are seen between the quality of the precipitation parameters,
as well as several wind and gust features. Both systems are able to represent parameters
associated with synoptic scale processes, such as temperature, humidity, and surface
pressure dynamics, much more accurately than mesoscale and microscale processes, such
as wind and precipitation. Some surface pressure parameters appear to be poorly captured,
but this is likely due to differences in elevation between the NWP data and weather station
data, which are not accounted for in this evaluation. In general, these results are quite
consistent with what we would expect from the state of the art of NWP of a deterministic
24 h simulation of thunderstorms. For detailed metrics, see Appendix B.Forecasting 2021, 3 549
Max Gust [m/s] Mean Wind [m/s] Max Precip [mm/hr] Max Temp [C] Std Dev Pressure [mbar]
RTMA
WRF
Weather Station Observations
Figure 2. Point-to-point comparison of the NOAA analysis parameters (RTMA, (Top)) and the WRF simulation parameters
(WRF, (Bottom)) versus weather station observations for select variables, describing 24 h thunderstorm events.
3.2. The Outage Models
The RTMA-based outage model performs slightly better than the WRF-based model
based on all metrics used in our analysis as seen in Table 3 and Figure 3.
Table 3. Error metrics of the event-level performance of the cross-validation of the outage predic-
tion systems.
MdAPE MAPE CRMSE R2 NSE
RTMA 31% 46% 50 0.39 0.37
WRF 35% 50% 51 0.36 0.35
Figure 3. Scatterplots of cross-validation predictions versus actual outages for all thunderstorm
events for RTMA- (red, (left)) and WRF (blue, (right))-based outage prediction systems.
While a direct comparison is not particularly fair because of the differences in the
events used in the analysis and the domains of the models, both outage models presented
here perform reasonably well in comparison to other outage prediction models of a similar
architecture. Wanik et al. [10] describe a warm weather outage model that has a slightly
higher MdAPE (35.1 to 38.7%). In Cerrai et al. [9], the best overall outage model has an
overall MdAPE of 43%, a MAPE of 59% and an NSE of 0.53. In Yang et al. [17], their
conditional outage prediction system designed for severe events has a MdAPE of 38%,
MAPE of 46%, and NSE of 0.79. In Watson et al. [18], their best performing rain/wind
storm model has a MdAPE of 38%, MAPE of 57%, and an NSE of 43%. The thunderstorm
outage models described here have competitive APE metrics, but have a comparatively
low NSE, in part because of one under-predicted extreme event.Forecasting 2021, 3 550
Overall, the cross-validation results indicate that the models presented here are sensi-
tive to the overall severity of the different thunderstorms. The model has a good dynamic
range, especially if one considers that the median daily outages for CT, WMA, EMA, NH,
and UI are 35, 6, 20, 22, and 25, respectively. The models shown here demonstrate a
dynamic range of around 10 times the typical daily outage level for each service territory,
depending on storm severity.
3.2.1. Spatial Skill
As seen in Figure 4, the RTMA-based outage model has slightly better spatial per-
formance than the WRF-based model, but the differences between the outage models are
small in comparison to the differences between the events and territories. While many
thresholds were evaluated, we show the results for a threshold of 0.111 damage locations,
which correspond to having one damage location smoothed out in a 3 × 3 pixel area
(approximately 7.5 km2 ).
CT WMA EMA NH UI
1.0
RTMA
0.6
0.2
0.8
WRF
0.4
0.0
Neighborhood Size
Figure 4. FSS for all events by territory for the RTMA- and WRF-based outage models with a moderate outage risk threshold
(0.111 damage locations), plotted for neighborhood sizes 3 × 3 to 21 × 21 grid cells. The colored lines are FSS values for
each event; the black line indicates the average FSS over all events; and the horizontal dark grey line indicates the average
FSSuni f orm .
3.2.2. Outage Model Variable Importance
The grouped variable importance analysis of the outage models in Figure 5 shows that,
while infrastructure-related variables are the most important by far, there are differences
between the two models as to which weather parameters contribute the most to the models.
While the RTMA-based system finds precipitation information to be very useful, the WRF-
based system has stronger preference for winds, temperature, and humidity than the
RTMA model. The WRF model also appears to fit more on such environmental variables
as land cover, vegetation, and elevation, which do not vary storm-by-storm in a given
service territory. The results of an individual variable importance analysis is displayed in
Appendix A. Although the importance of any one variable to the model is relatively small,
given the large number of variables used, and the logarithmic error metric used to measure
the dropout loss only makes the differences appear smaller, there are some interesting
differences between the two models. Most notably, the maximum precipitation rate is
one of the least important variables in the WRF model but is the second most important
variable in the RTMA model.Forecasting 2021, 3 551
Figure 5. Grouped variable importance as measured by dropout loss (RMSLE) over 10 iterations of
permuted groups of variables. The 95% confidence intervals are also shown for both the RTMA-based
outage model (red, (left)), and the WRF-based outage model (blue, (right)).
4. Discussion
Based on these results, several conclusions can be made about the predictability of
thunderstorm-related power outages. Firstly, while the NOAA analysis data represent local
weather conditions more accurately than the WRF simulation, many weather features used
in the outage prediction models have significant errors in both systems. Rather than these
errors being simulation or forecasting errors, because of the amount of observational data
assimilated into the NOAA analysis system, they are likely due to the representativeness
error caused by depicting complex and locally variable phenomena as deterministic and
uniform in the 2.5 km × 2.5 km area. This type of error has been documented in the
literature for precipitation and winds [74–77], and the errors in the RTMA data for winds
and the Stage IV are comparable to the magnitude of representativeness error found in
these works.
Secondly, because the NOAA analysis data have higher quality weather data than
the WRF simulations, it is unsurprising that the RTMA outage model is more accurate
than the WRF-based one. However, what is surprising is how modest the performance
differences between these outage models are. Even with the large amount of observational
data incorporated into the RTMA and Stage IV analysis products, which have much fewer
simulation errors present than the WRF simulations, the outage model is unable to predict
thunderstorm-related outages with greater accuracy.
This suggests that the randomness of storm damages is quite significant, and more
precise outage predictions may require significantly more precise information. One possi-
bility is that additional factors that are not considered in this study, such as the age of the
infrastructure, limit the outage model. However, there are also differences between the two
models that suggest other possibilities. As described above, the spatial resolution of the
representation of the weather data is a readily apparent source of imprecision in our data.
Although all data used in these models, including the environmental and infrastructure in-
formation, may suffer from similar representativeness errors, we can see that some weather
variables are better represented at 2.5 km × 2.5 km than others. How the precision of the
weather data affects the outage models can be understood with a more detailed analysis of
the variable importance.
By comparing the R2 values of the weather feature evaluation and the importance of
the weather variables in the outage models, we find that there is a weak but real correlation
between the two (0.23 ± 0.07 for RTMA, 0.29 ± 0.07 for WRF). This indicates that theForecasting 2021, 3 552
outage models have a preference for precise and accurate weather information. This may
be obvious, but this preference also appears regardless of whether or not the weather
phenomena directly causes power outages. Both RTMA and WRF outage systems find
temperature and humidity to be somewhat important to its predictions, although these
variables are not direct causes of outages in thunderstorms. They are more indicators of
convective potential and are, thus, indirectly related to power outages, but because of their
accurate representation, the machine learning algorithms of the outage models find them
useful for understanding the risk of weather-related damage.
At the same time, there is also a distinct preference for variables that have a more
direct causative relationship with weather-related outages. This can best be seen in how
the RTMA system has a strong preference for precipitation variables. maxPREC is the 2nd
most important variable of all for that model, despite it having only a moderate correlation
with local conditions (R2 of 0.5298). It can also be seen in how both models find useful
information in wind and gust variables, despite the most precisely predicted variable in
that group, avgWIND, only having a moderate correlation with local conditions (R2 of 0.6346
and 0.5879 for RTMA and WRF, respectively). This is because both wind and precipitation
are good indicators of the location and intensity of a convective storm, and more direct
indicators of the risk of weather-related damages. Indeed, in the case of the RTMA system,
the strong preference for precipitation information comes with a comparatively weaker
preference for most other variable groups.
This suggests that if the precision of the precipitation and wind information could
be increased further, we can expect corresponding increases in the accuracy of outage
prediction models for thunderstorms. Additionally, if we consider how the apparent lack
of precision in these data is likely from representativeness error, as described above, future
directions for research become apparent.
Lastly, the spatial skill of the outage prediction system appears to vary significantly
from storm-to-storm as well as territory-by-territory. It is beyond the scope of this paper
to speculate about the storm-to-storm variability in the FSS scores, which may also be
a function of the accuracy and precision of the weather simulations, but the distinct
differences in spatial predictability of outages in different service territories is suggestive
of distinct differences between them. It has been documented for precipitation that the FSS
calculations change significantly depending on the size of the domain. However, in the
case of outages, this effect is likely only moderate because the average value of FSSuni f orm
does not vary much between territories. The most apparent and potentially impactful
difference for outage models between the territories is the densities of the infrastructure.
As seen in Figure 5 and Appendix A, infrastructure is a very influential variable for outage
modeling, and while all the service territories included in this study contain some urban
areas, some are much more consistently urbanized than others. As such, the mean density
of overhead lines for each territory varies widely with a minimum of 8.5km per grid cell in
WMA, and a maximum 27.5 km per grid cell in UI. If the mean density of the overhead
lines and mean FSS as shown in Figure 4 for each territory are compared, we see that the
Pearson correlations between the two are 0.927 for RTMA, and 0.946 for WRF: a very strong
correlation between the overall spatial predictability of outages and the density of the
infrastructure in the region. This is a clear indication of the influence that the infrastructure
density has over the spatial predictability of power outages. However, this also may be an
indication of over-fitting on the infrastructure features. Infrastructure is by far the most
important variable group in this analysis, but in the case of the RTMA outage model, better
spatial skill comes with a corresponding lower importance of infrastructure.
5. Conclusions
While the two thunderstorm-related outage models shown here are acceptably skilled
at predicting the total number of damages for each storm event, they have difficulty pre-
dicting the location of storm impacts. Both the models based on the NOAA analysis dataset
and the WRF simulation dataset appear to fit strongly on the amount of infrastructureForecasting 2021, 3 553
present in an area and a combination of weather variables that are either directly related
to storm damages but imprecisely represented (precipitation, winds), or are more general
indicators of convective potential but more precisely represented (temperature, humidity).
Because predictions of the weather conditions and power outages appear to have
similar limitations for thunderstorms, there are established analytical methods that could
be readily applied to improve the modeling of power outages and other impacts associated
with thunderstorms. Just as weather ensembles allow meteorologists to predict the potential
intensity of thunderstorms beyond the capabilities of deterministic forecasts, an outage
model coupled to a weather ensemble may allow us to predict the potential impacts in a
similar way. Because of the high uncertainties, rapidly-refreshing outage models, such as
that described in Alpay et al. [33], may be more useful in an operational decision-making
context for thunderstorm preparedness.
If one considers how strong convective storms are an increasing threat, globally,
there is an implicit call to accelerate investment in global weather prediction and the
observation infrastructure. The impact models presented here, even with their limitations,
are only possible because of the availability of high-resolution nowcasting products in the
United States. While recent developments in global convective-allowing NWP systems are
encouraging [78], for this type of impact modeling to be applied in other countries, more
work in this space is needed.
Based on our findings, we can expect that as better representations of local weather
conditions during thunderstorms are developed both in the United States and globally,
outage model accuracy, overall as well as spatially, will improve; the outage models will
learn more and more of the phenomena directly linked to weather-related power outages,
such as strong winds and extreme precipitation, instead of the synoptic patterns that are cor-
related to them. To progress along that path, a more granular understanding of the weather
conditions that cause damage in convective storms and how they can be represented is
needed. Further research involving an analysis or modeling of storm impacts based on
microscale numerical weather prediction, large eddy simulations, or even observations
from radar or lidar instruments could be very informative about how weather information
can be generated in a way that improves our ability to understand and anticipate the
impacts of convective storms.
Author Contributions: Conceptualization, P.L.W.; methodology, P.L.W.; software, P.L.W. and M.K.;
validation, P.L.W.; formal analysis, P.L.W.; investigation, P.L.W. and E.A.; resources, E.A.; data cura-
tion, P.L.W. and M.K.; writing—original draft preparation, P.L.W.; writing—review and editing, E.A.
and M.K.; visualization, P.L.W.; supervision, E.A.; project administration, E.A.; funding acquisition,
E.A. All authors have read and agreed to the published version of the manuscript.
Funding: This research was funded by Eversource Energy.
Institutional Review Board Statement: Not Applicable.
Informed Consent Statement: Not Applicable.
Data Availability Statement: Restrictions apply to the availability of these data. Data were obtained
from Eversource Energy and United Illuminating. They are available from the authors with the
permission of Eversource Energy and United Illuminating.
Conflicts of Interest: The authors declare no conflict of interest. The funders had no role in the
design of the study; analyses, or interpretation of data; in the writing of the manuscript; or in the
decision to publish the results.
Abbreviations
The following abbreviations are used in this manuscript:
NWP Numerical Weather Prediction
WRF Weather Research and Forecasting model
RTMA Real-Time Mesoscale AnalysisForecasting 2021, 3 554
RMSLE Root Mean Squared Logarithmic Error
NSE Nash–Sutcliffe Efficiency
MAPE Mean Absolute Percent Error
CRMSE Centered Root Mean Squared Error
FSS Fraction Skill Score
CT Eversource Connecticut
WMA Eversource Western Massachusetts
EMA Eversource Eastern Massachusetts
NH Eversource New Hampshire
UI AVANGRID United Illuminating
SPI Standardized Precipitation Index
LAI Leaf Area Index
DEM Digital Elevation Model
NLCD National Land Cover Database
3DEP 3D Elevation Program
GEDI Global Ecosystem Dynamics Investigation
SSURGO Soil Survey Geographic Database
ITSP Individual Tree Species Parameter
WWDT West Wide Drought Tracker
MODIS Moderate Resolution Imaging Spectroradiometer
METAR Meteorological Aerodrome Reports
SPECI Aviation Selected Special Weather Report
NOAA National Oceanic and Atmospheric Administration
NCEP National Centers for Environmental Prediction
USDA United States Department of Agriculture
USGS United States Geological Survey
MRLC Multi-Resolution Land Characteristics
Appendix A. Data Features
Table A1. Description of variables used in outage prediction models. The dropout loss of the top ten variables for each
model are in bold. Higher dropout loss indicates greater importance.
Name Description Source Variable Group RTMA Drp. Loss WRF Drp. Loss
ohLength Length of Overhead Line Utility Company Infrastructure 0.153695 0.155182
poleCount Number of Utility Poles Utility Company Infrastructure 0.152473 0.153222
fuseCount Number of Fuses Utility Company Infrastructure 0.152181 0.153253
reclrCount Number of Reclosers Utility Company Infrastructure 0.152233 0.153057
prec11 Percent NLCD 11—Open Water NLCD 2016 [51] Land Cover 0.151933 0.152713
prec21 Percent NLCD 21—Developed, Open NLCD 2016 [51] Land Cover 0.152056 0.152876
prec22 Percent NLCD 22—Developed, Low NLCD 2016 [51] Land Cover 0.151910 0.152749
prec23 Percent NLCD 23—Developed, Medium NLCD 2016 [51] Land Cover 0.152079 0.152963
prec24 Percent NLCD 24—Developed, High NLCD 2016 [51] Land Cover 0.151989 0.152700
prec31 Percent NLCD 31—Barren NLCD 2016 [51] Land Cover 0.151927 0.152714
prec41 Percent NLCD 41—Deciduous Forest NLCD 2016 [51] Land Cover 0.151974 0.152783
prec42 Percent NLCD 42—Evergreen Forest NLCD 2016 [51] Land Cover 0.151936 0.152731
prec43 Percent NLCD 43—Mixed Forest NLCD 2016 [51] Land Cover 0.151861 0.152732
prec52 Percent NLCD 52—Shrub NLCD 2016 [51] Land Cover 0.151933 0.152704
prec71 Percent NLCD 71—Grassland NLCD 2016 [51] Land Cover 0.151928 0.152699
prec82 Percent NLCD 82—Cultivated Crops NLCD 2016 [51] Land Cover 0.151933 0.152715
prec95 Percent NLCD 95—Herbaceous Wetlands NLCD 2016 [51] Land Cover 0.151934 0.152713
avgCanopy Mean Percent Tree Canopy Cover NLCD Tree Canopy 2016 [52] Vegetation 0.152329 0.152956
stdCanopy Standard Deviation of Canopy Cover NLCD Tree Canopy 2016 [52] Vegetation 0.151968 0.152736
avgVegHgt Mean Vegetation Height GEDI 2019 [53] Vegetation 0.152037 0.152906
stdVegHgt Standard Deviation of Vegetation Height GEDI 2019 [53] Vegetation 0.151945 0.152771Forecasting 2021, 3 555
Table A1. Cont.
Name Description Source Variable Group RTMA Drp. Loss WRF Drp. Loss
avgHardBA Mean Hardwood Basal Area ITSP [56] Vegetation 0.151903 0.152714
stdHardBA Standard Deviation of Hardwood BA ITSP [56] Vegetation 0.151939 0.152722
avgHardSDI Mean Hardwood Stand Density Index ITSP [56] Vegetation 0.151963 0.152686
stdHardSDI Standard Deviation of Hardwood SDI ITSP [56] Vegetation 0.151919 0.152698
avgSoftBA Mean Softwood Basal Area ITSP [56] Vegetation 0.151914 0.152702
stdSoftBA Standard Deviation of Softwood BA ITSP [56] Vegetation 0.151881 0.152691
avgSoftSDI Mean Softwood Stand Density Index ITSP [56] Vegetation 0.151927 0.152677
stdSoftSDI Standard Deviation of Softwood SDI ITSP [56] Vegetation 0.151891 0.152684
avgBA Mean Total Basal Area ITSP [56] Vegetation 0.151950 0.152737
stdBA Standard Deviation of Total Basal Area ITSP [56] Vegetation 0.151910 0.152776
avgSDI Mean Total Stand Density Index ITSP [56] Vegetation 0.151951 0.152698
stdSDI Standard Deviation of Total SDI ITSP [56] Vegetation 0.151981 0.152767
avgDQ Mean Total Quadratic Mean Diameter ITSP [56] Vegetation 0.151929 0.152718
stdDQ Standard Deviation of Total DQ ITSP [56] Vegetation 0.151936 0.152760
avgTF Mean of Total Frequency ITSP [56] Vegetation 0.152247 0.153137
stdTF Standard Deviation of TF ITSP [56] Vegetation 0.151984 0.152783
avgTPA Mean of Trees per Acre ITSP [56] Vegetation 0.151881 0.152653
stdTPA Standard Deviation of TPA ITSP [56] Vegetation 0.151932 0.152690
LAI Leaf Area Index MODIS [9,79] Vegetation 0.152083 0.152848
avgDEM Mean Elevation 3DEP [54] Elevation 0.151837 0.152660
stdDEM Standard Deviation of Elevation 3DEP [54] Elevation 0.151924 0.152720
elvDiff Difference of avgDEM and weather elevation 3DEP [54], RTMA [37], WRF [80] Elevation 0.151931 0.152706
spi1 One Month Standardized Precipitation Index WWDT [57] Drought 0.151987 0.153005
spi3 Three Month Standardized Precipitation Index WWDT [57] Drought 0.152001 0.152830
spi12_0 12 Month SPI, current WWDT [57] Drought 0.151998 0.152773
spi12_1 12 Month SPI, 1 year prior WWDT [57] Drought 0.152137 0.152853
spi12_2 12 Month SPI, 2 years prior WWDT [57] Drought 0.152075 0.152831
spi12_3 12 Month SPI, 3 years prior WWDT [57] Drought 0.152155 0.152853
spi12_4 12 Month SPI, 4 years prior WWDT [57] Drought 0.152027 0.152809
spi12_5 12 Month SPI, 5 years prior WWDT [57] Drought 0.151939 0.152801
hydNo Percent not hydric soils SSURGO [55] Soil Type 0.151954 0.152771
siltTotal Percent Silt Content SSURGO [55] Soil Type 0.151943 0.152747
clayTotal Percent Clay Content SSURGO [55] Soil Type 0.151929 0.152717
rockTotal Percent of Rock Content SSURGO [55] Soil Type 0.151966 0.152738
soilDepth Depth of Soil SSURGO [55] Soil Type 0.151847 0.152661
orgMat Percent of Organic Material SSURGO [55] Soil Type 0.151949 0.152743
soilDens Soil Density SSURGO [55] Soil Type 0.151950 0.152730
kSat Saturated Hydraulic Conductivity SSURGO [55] Soil Type 0.151945 0.152732
satP Soil Porosity SSURGO [55] Soil Type 0.151961 0.152716
avgTMP Mean Air Temperature RTMA [37], WRF [80] Temperature 0.152191 0.152650
stdTMP Standard Deviation of Air Temp RTMA [37], WRF [80] Temperature 0.152156 0.152819
maxTMP Maximum Air Temperature RTMA [37], WRF [80] Temperature 0.152685 0.153235
minTMP Minimum Air Temperature RTMA [37], WRF [80] Temperature 0.151925 0.152873
sumTMP Sum of Air Temperatures RTMA [37], WRF [80] Temperature 0.152029 0.152741
peakTMP Mean Temp during peak winds RTMA [37], WRF [80] Temperature 0.152020 0.152780
avgDPT Mean Dew Point Temperature RTMA [37], WRF [80] Dew Point 0.151976 0.152767
stdDPT Standard Deviation of Dew Point RTMA [37], WRF [80] Dew Point 0.152013 0.152804
maxDPT Maximum Dew Point Temperature RTMA [37], WRF [80] Dew Point 0.151926 0.152687
minDPT Minimum Dew Point Temperature RTMA [37], WRF [80] Dew Point 0.151941 0.152832
sumDPT Sum of Dew Point Temperatures RTMA [37], WRF [80] Dew Point 0.152012 0.152792
peakDPT Mean Dew Point during peak winds RTMA [37], WRF [80] Dew Point 0.152007 0.152723
avgPRES Mean Surface Pressure RTMA [37], WRF [80] Pressure 0.151914 0.152716
stdPRES Standard Deviation of Pressure RTMA [37], WRF [80] Pressure 0.152297 0.152797
maxPRES Maximum Surface Pressure RTMA [37], WRF [80] Pressure 0.151950 0.152735
minPRES Minimum Surface Pressure RTMA [37], WRF [80] Pressure 0.151946 0.152737
sumPRES Sum of Surface Pressures RTMA [37], WRF [80] Pressure 0.151943 0.152706
peakPRES Mean Pressure during peak winds RTMA [37], WRF [80] Pressure 0.151960 0.152694
avgSPFH Mean Specific Humidity RTMA [37], WRF [80] Humidity 0.152062 0.152817
stdSPFH Standard Deviation of Spec. Humidity RTMA [37], WRF [80] Humidity 0.152018 0.152836
maxSPFH Maximum Specific Humidity RTMA [37], WRF [80] Humidity 0.151949 0.152751
minSPFH Minimum Specific Humidity RTMA [37], WRF [80] Humidity 0.152082 0.152905
sumSPFH Sum of Specific Humidities RTMA [37], WRF [80] Humidity 0.152163 0.152752Forecasting 2021, 3 556
Table A1. Cont.
Name Description Source Variable Group RTMA Drp. Loss WRF Drp. Loss
peakSPFH Mean of Spec. Humidity during peak winds RTMA [37], WRF [80] Humidity 0.151984 0.152767
avgWIND Mean 10m Wind Speed RTMA [37], WRF [80] Wind/Gust 0.151961 0.152710
stdWIND Standard Deviation of 10m Wind Speed RTMA [37], WRF [80] Wind/Gust 0.151954 0.152750
maxWIND Maximum 10m Wind Speed RTMA [37], WRF [80] Wind/Gust 0.151977 0.152748
minWIND Minimum 10m Wind Speed RTMA [37], WRF [80] Wind/Gust 0.151997 0.152745
sumWIND Sum of Wind Speeds RTMA [37], WRF [80] Wind/Gust 0.151972 0.152716
peakWIND Mean wind speed during peak winds RTMA [37], WRF [80] Wind/Gust 0.151948 0.152742
avgGUST Mean Wind Gust Speed RTMA [37], WRF [80] Wind/Gust 0.152045 0.152836
stdGUST Standard Deviation of Wind Gust Speed RTMA [37], WRF [80] Wind/Gust 0.151985 0.152769
maxGUST Maximum Wind Gust Speed RTMA [37], WRF [80] Wind/Gust 0.152040 0.152752
minGUST Minimum Wind Gust Speed RTMA [37], WRF [80] Wind/Gust 0.152089 0.152746
sumGUST Sum of Wind Gusts RTMA [37], WRF [80] Wind/Gust 0.151988 0.152746
peakGUST Mean Wind Gust Speed during peak winds RTMA [37], WRF [80] Wind/Gust 0.152039 0.152748
avgLFSH Mean Leaf Stress MODIS [9,79], RTMA [37], WRF [80] Wind/Gust 0.151991 0.152744
stdLFSH Standard Deviation of Leaf Stress MODIS [9,79], RTMA [37], WRF [80] Wind/Gust 0.151961 0.152738
maxLFSH Maximum Leaf Stress MODIS [9,79], RTMA [37], WRF [80] Wind/Gust 0.151980 0.152743
minLFSH Minimum Leaf Stress MODIS [9,79], RTMA [37], WRF [80] Wind/Gust 0.151963 0.152755
sumLFSH Sum of Leaf Stresses MODIS [9,79], RTMA [37], WRF [80] Wind/Gust 0.152024 0.152760
peakLFSH Mean Leaf Stress during peak winds MODIS [9,79], RTMA [37], WRF [80] Wind/Gust 0.151961 0.152826
wgt5 Hours of Winds >5 m/s RTMA [37], WRF [80] Wind/Gust 0.151974 0.152793
cowgt5 Continuous Hours of Winds >5 m/s RTMA [37], WRF [80] Wind/Gust 0.151952 0.152770
ggt13 Hours of Gusts >13 m/s RTMA [37], WRF [80] Wind/Gust 0.151967 0.152997
ggt17 Hours of Gusts >17 m/s RTMA [37], WRF [80] Wind/Gust 0.151932 0.152729
ggt22 Hours of Gusts >22 m/s RTMA [37], WRF [80] Wind/Gust 0.151934 0.152717
coggt13 Continuous Hours of Gusts >13 m/s RTMA [37], WRF [80] Wind/Gust 0.151935 0.152804
coggt17 Continuous Hours of Gusts >17 m/s RTMA [37], WRF [80] Wind/Gust 0.151940 0.152736
coggt22 Continuous Hours of Gusts >22 m/s RTMA [37], WRF [80] Wind/Gust 0.151945 0.152719
typWDIR Typical (mean) wind direction of all storms RTMA [37], WRF [80] Wind/Gust 0.152005 0.152712
medWDIR Median Wind direction of storm RTMA [37], WRF [80] Wind/Gust 0.152002 0.152806
difWDIR Difference between typWDIR and medWDIR RTMA [37], WRF [80] Wind/Gust 0.151966 0.152745
avgPREC Mean Hourly Precipitation Rate Stage IV [38], WRF [80] Precipitation 0.152209 0.152784
stdPREC Standard Deviation of Precip. Rate Stage IV [38], WRF [80] Precipitation 0.152403 0.152731
maxPREC Maximum Hourly Precipitation Rate Stage IV [38], WRF [80] Precipitation 0.152844 0.152773
sumPREC Total Precipitation Stage IV [38], WRF [80] Precipitation 0.152187 0.152746
peakPREC Mean Precip. Rate during peak winds Stage IV [38], WRF [80] Precipitation 0.152311 0.152726
Appendix B. Weather Correlations
Table A2. Correlation between RTMA and WRF weather datasets, and METAR and SPECI observations.
Name Variable Group RTMA—METAR R2 WRF—METAR R2
avgTMP Temperature 0.9836 0.9129
stdTMP Temperature 0.9119 0.6448
maxTMP Temperature 0.9707 0.8686
minTMP Temperature 0.9443 0.8592
sumTMP Temperature 0.9119 0.8459
peakTMP Temperature 0.7814 0.6480
avgDPT Dew Point 0.9798 0.9461
stdDPT Dew Point 0.9092 0.7349
maxDPT Dew Point 0.9608 0.8966
minDPT Dew Point 0.9511 0.8897
sumDPT Dew Point 0.9234 0.8921
peakDPT Dew Point 0.8348 0.7189
avgPRES Pressure 0.1700 0.1588
stdPRES Pressure 0.9766 0.9392
maxPRES Pressure 0.1498 0.1363
minPRES Pressure 0.2200 0.2038
sumPRES Pressure 0.0015 0.0013
peakPRES Pressure 0.1708 0.1469
avgSPFH Humidity 0.9735 0.9274
stdSPFH Humidity 0.8878 0.6932You can also read