Institutional Presentation 2019 - Simple Storage Service (Amazon S3)
←
→
Page content transcription
If your browser does not render page correctly, please read the page content below

Institutional Presentation 2019
Content
Port of Santos 03
About Santos Brasil 05
Tecon Santos 08
Tecon Imbituba 14
Tecon Vila do Conde 19
TEV – Vehicle Terminal 24
Logistics 25
Investments & Financial Highlights 27
Corporate Governance 32
Sustainability 33
2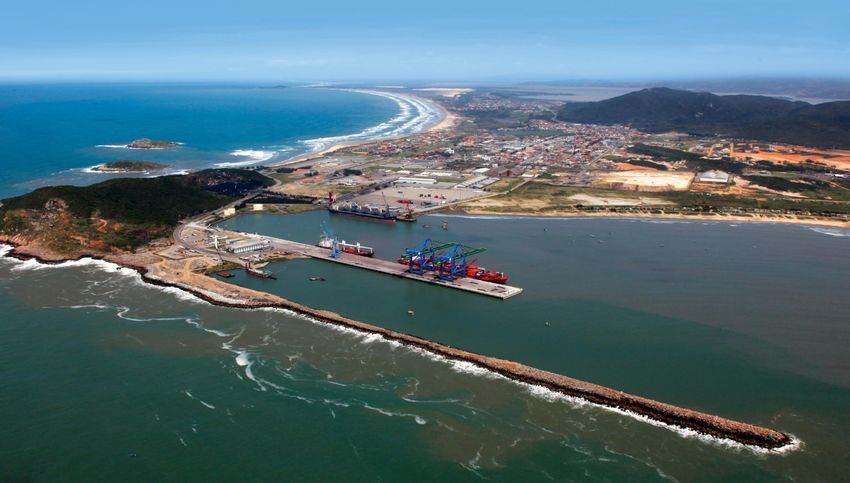
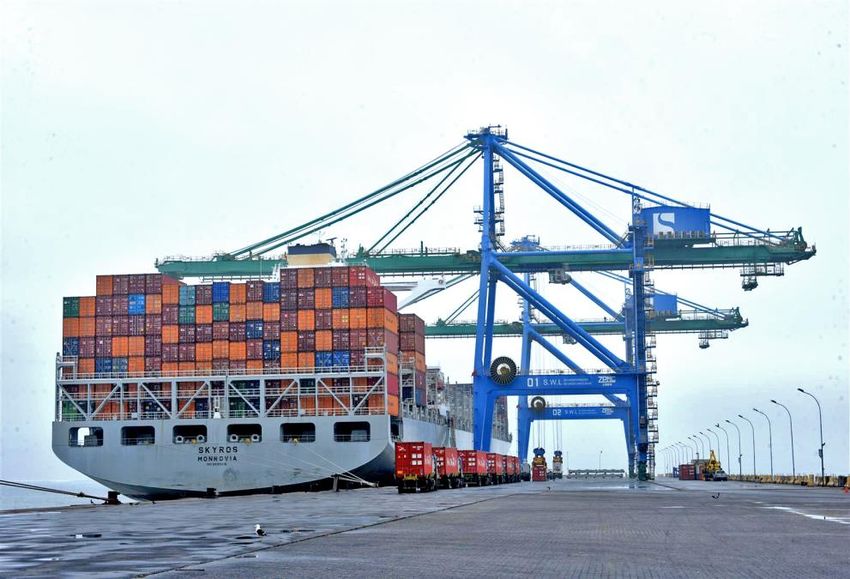
Port of Santos
‘Must-call port’ in South America
Largest Port in South America
> 25% of Brazilian trade balance
Hinterland covers 55% of Brazil’s GDP
Connected to Brazil’s main roads and railways
~90% of São Paulo’s industrial base is located less than 200 kilometers from the Port of Santos
BTP
DPW Santos
Rodrimar
Libra
Ecoporto
3
12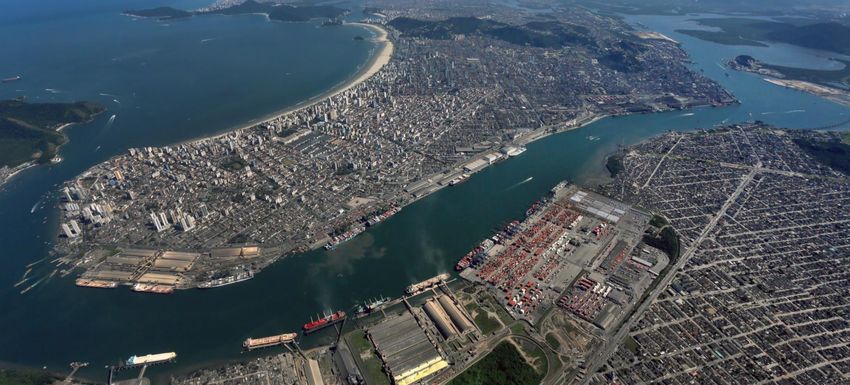
Port of Santos
Tecon Santos’ market-share recovery: 40.4% in 4M19 vs. 35.4% in FY18
Market share – 4M19 Container throughput (TEU x 1,000)
DP World
Santos
Santos
Brasil
12.1%
Libra
2018 x 2017 CAGR 1998 – 2018
40.4% 9.9%
Others
- Port of Santos: +4.0% (+7.0% in TEU) - Port of Santos: 8.5%
0.4%
- Tecon Santos: +7.8% (+9.5% in TEU) - Tecon Santos: 9.2%
BTP
37.2%
Container throughput (TEU x 1,000)
4,122
3,780 3,854
3,656 3,565
3,448
3,104
2,984
2,685 2,722
2,446 2,533
2,268 2,252
1,883 1,733 1,811
1,560 1,487 1,426 1,446
1,355 1,380 1,314 1,320
1,253 1,270
1,224 1,159
1,048 1,008 1,044
799 775 801 746
612
346 350 436
248 302
1998 1999 2000 2001 2002 2003 2004 2005 2006 2007 2008 2009 2010 2011 2012 2013 2014 2015 2016 2017 2018
Port of Santos Tecon Santos
4
Source: CODESP and Santos Brasil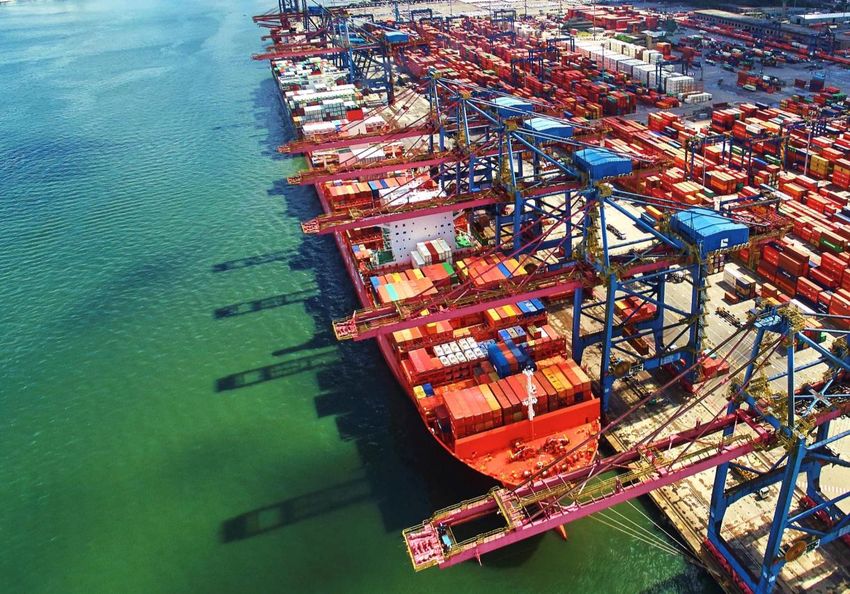
About Santos Brasil
History

                      5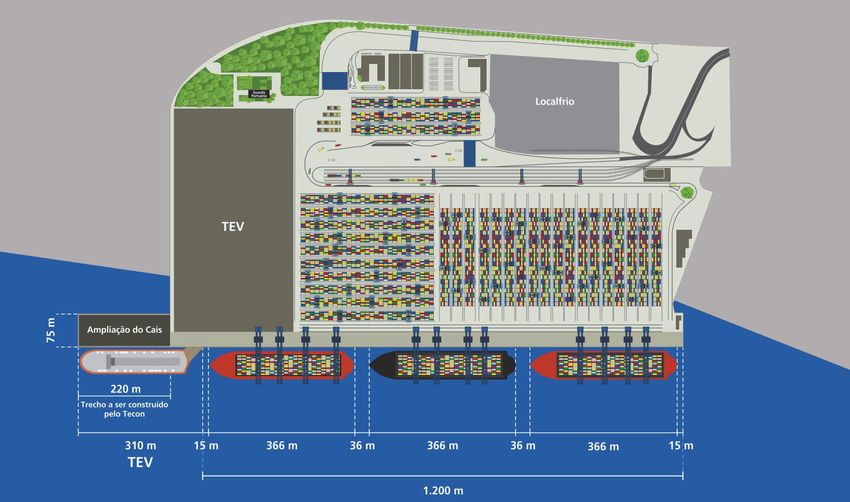
About Santos Brasil
Highlights
Publicly-traded company, listed in B3 TECON VILA
DO CONDE
Five terminals on the Brazilian coast
- Three container terminals
- One vehicle terminal
- One general cargo terminal
Container throughput: 1.68 million TEU (twenty-foot equivalent
unit) in 2018
Port-to-Door full logistics solution (Santos Brasil Logística)
16.8% of the Brazilian container throughput in 2018* TECON
SANTOS
TEV
DISTRIBUTION
BONDED LOGISTICS
CENTER
(SÃO BERNARDO CENTERS
DO CAMPO) (SANTOS AND GUARUJÁ)
TECON
IMBITUBA
TCG IMBITUBA
* Source : ANTAQ (GENERAL CARGO TERMINAL)
6
Container terminal operation
The container cycle in a import operation (reverse for exports)
5a Regular Containers Regular containers are taken to the
common yard, where they are positioned
according to the order
in which they will most likely be moved into
trucks to leave the terminal
1 Ship arrives at the 2 Ship-to-Shore (STS) or 3 Trucks 4 Reach Stackers Reefer containers are 6 Port Warehouse/ De-
Port Mobile Harbor Cranes Consolidation
positioned in a reefer yard.
(MHC)
Connections and
functionalities are regularly
monitored (i.e. temperature)
Containers are transported by 5b Reefer Containers
Cranes unload the containers After the container is placed
ships, which dock at the RTGs are used to lift the
from the ships, positioning on the truck's bed, it is taken Cargo of dry
terminal’s quayline containers from flat-bed trucks
them in trucks and/or terminal to the (reefer or dry) backyard containers is partially
and to position them in the
tractors unstuffed (fee is
stockpiles at the yard.
charged over the
Containers are stored before
importer)
collected by the client
10 Importer 9 Logistics Unit 8 Road 7 Customs
The containers transportation
Containers can be transported After the container is placed in
is made by truck, train (Tecon
by road to freight processing the yard or warehouse,
Santos) or barge (Tecon Vila
units in the region customs have the green light
do Conde)
to make any required
inspection or to clear the
cargo
7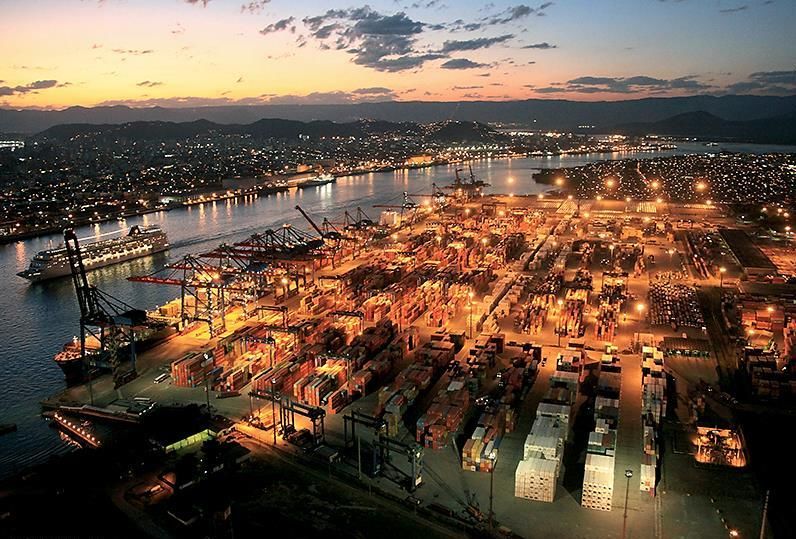
TECON
SANTOS
Tecon Santos
Best solution for containers in South America
Growth capacity: CAPEX plan of ~R$1.3 billion already started Geographic Footprint
Lease contract renewed until 2047 RR AP
Southeastern
Equipment 100% GPS-controlled AM PA MA CE RN Ports
PI PB
AC PE
TO AL
RO
Connected to Brazil’s main roads and railways BA SE
MT
GODF
4 internal railway tracks MS
SP
MG
ES
RJ
SC
SP
MG
ES
Vitória
PR SP RJ Rio +
SC
Itaguaí
RS
Tecon
Santos
Market Share 2018
35.4% 35.6%
15.6%
12.6%
0.8%
Tecon Santos BTP DP World Santos Libra Others
9
7
Tecon Santos
Infrastructure and other information

                     General data                                      Security                         Equipment            #     STS   MHC   Reach Stacker   RTG
                     Draft: 13.5m                         Allows
                                                                       Scanner (non-invasive            Ship-to-Shore        13¹
                                                           Post-
                     Quayline extension: 980m +                        inspection)
                                                        Panamax                                         MHC                  1
                     310m (TEV)                          vessels       Surveillance cameras
                                                         to dock                                        Reach Stackers       18
                     Area: 596,000 m2                                  Restricted access
                                                          at the                                        RTG                  46
                     Annual capacity: 2,000,000            Port
                     TEU

                                                                                                                                                                     10
7   (1) There are currently 11 STS cranes in operation. In 2018, 2 cranes were acquired, expected to be delivered in 2020.
Tecon Santos
R$ 3.0 billion1 invested to upgrade and expand the terminal
High Productivity - movements per hour per vessel (MPH) Tecon Santos in 1997: 11 MPH
106 105
99
93 92
Monthly Average
in 2018
92 MPH 69
Tecon Santos in 2018: 92 MPH
MPH
2013 2014 2015 2016 2017 2018
(1) IGP-M inflation adjusted 11Tecon Santos
Investments cycle in progress: cutting-edge technology, modern layout
NEW LAYOUT
Automation
Focus on efficiency
New Capacity
2,400,000 TEU
Quay extension
Estimated CapEx
R$ 1.3 billion (US$ 350M)
Hired Investments (FY18)
~R$ 100M
12Tecon Santos
CapEx prioritization
Phase 2
Phase 1
Backyard capacity
expansion
Berths extension
and modernization
to attend ships with
366 meters length Improvement of the
road-rail access
Phase 3
Automation:
increasing capacity
and cost reduction
13TECON
IMBITUBA
Tecon Inserir imagem aqui,
preenchendo o espaço por
Imbituba completo.
14Tecon Imbituba
Strategic Location at Southern Region, with developed logistical access
14.5m draft: port terminal ready to receive Super-Post-Panamax Geographic Footprint
vessels of 366 meters length
RR
AP
Close to Santa Catarina and Rio Grande do Sul industrial zones Southern
AM PA MA CE RN Ports
25-year lease contract (starting in 2008), with a renewal option AC
RO
TO
PI PB
PE
AL
SE
for additional 25 years MT
BA
GODF TCP
PR
Beneficiary of adjacent infrastructure projects: widening of BR- MS
SP
MG
ES
RJ
SC
Itapoá
APM & Portonave
101 federal highway and the construction of Coastal Railway PR
RS Imbituba
(“Ferrovia Translitorânea”) SC
RS
Tecon Rio Grande
Favorable meteorological conditions and 24-hour access Hinterland
Tecon Imbituba hosts 2 terminal types: Container and General Market Share 2018
Cargo
28.7% 28.7%
24.7%
One-stop shop: ship, DEPOT and container freight station (CFS) 14.6%
operations
3.3%
Tecon Imbituba Tecon Rio Grande Portonave
Porto Itapoá Porto Itajaí
15
7Tecon Imbituba
Infrastructure and other information
General data Security Equipment # STS MHC Reach Stacker
Draft: 14.5m Allows
Scanner (non-invasive Ship-to-Shore 2
Super-
Quayline extension: 660m inspection)
Post- MHC 2
Panamax Surveillance cameras
Area: 207,000m2
vessels Reach Stackers 8
Restricted access
Annual Capacity: 450,000 TEU to dock
at the
Port
16
7Tecon Imbituba TECON VILA DO CONDE
Potential for volume increase
Tecon Imbituba and its peer terminals (Itajaí/Navegantes and Rio
Grande) are equidistant from the industrial zones and the
consumption centers in the Southern region PARANAGUÁ
765,785 TEU*
ITAPOÁ / SÃO FRANCISCO DO SUL
The states of Rio Grande do Sul and Santa 634,197 TEU*
Nearby Agricultural Catarina together accounted for 40.5% of
Brazilian chicken and 69.7% of pork exports ITAJAÍ / NAVEGANTES
Area
in 2017(1) 1,111,938 TEU*
Rio Grande do Sul holds the largest
concentration of biodiesel, tobacco, IMBITUBA
Nearby Industrial automation, agricultural & road machinery, 84,885 TEU*
Cluster wine, trailers & car bodies, and leather &
footwear producers / manufacturers in
Brazil(2)
Container Terminal
With Premium Premium transportation logistics with 2 main
Logistics roads and railways under construction Imbituba Hinterland
RIO GRANDE
736,967 TEU* Pork And Poultry Production
Rio Grande do Sul Industrial Zone
* Source: Volume in 2018 (ANTAQ) 17
(1) Brazilian Association of Animal Protein 2018 Annual Report; (2) InvestRS – Rio Grande do Sul StateTecon Imbituba
R$ 965 million(1) invested since 2008
Improving Productivity - movements per hour per vessel (MPH)
Monthly Average
in 2018
60 MPH
(1) IGP-M inflation adjusted. Includes investments in Imbituba General Cargo terminal 18TECON
VILA DO
CONDE
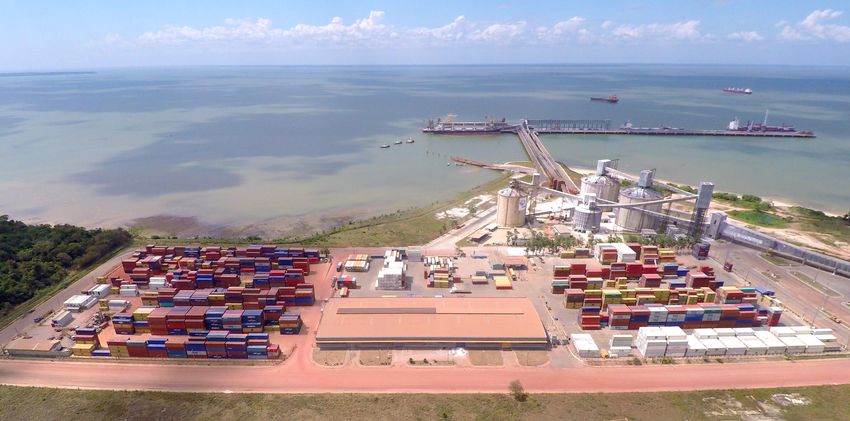
19Tecon Vila do Conde
Located in the delta of Amazon River
Located in the North region of Brazil, with no physical constraints Geographic Footprint
to receive long haul vessels
RR Northern
AP
Dominant container terminal in Pará state, well connected to other Ports
Brazilian ports via cabotage AM PA MA CE RN Vila do Conde
PI PB
PE
AC TO AL
RO
Connected to all continents, directly, through Caribbean hub ports MT
BA SE
AP Belém Fortaleza
Itaqui (Pecém)
and Panama Canal GODF
MG
MS ES PA MA CE
Offers container stuffing and unstuffing services, as well as PR
SP RJ PI
refrigerated warehousing SC
RS
Capacity expanded in 2018: investments in new equipment and
infrastructure modernization
Market Share 2018
Lease contract recently renewed for an additional 15-year period
# ‘000 containers
(by 2033)
15
103
Important commodities export hub in the region (e.g. timber, frozen 16
14
50
70 78
39
meat, pepper, agricultural products, metals, minerals and fruits) 25
2013 2014 2015 2016 2017 2018
Vila do Conde Belém
20
7Tecon Vila do Conde
Infrastructure and other information
General data Security Equipment # MHC Reach Stacker
Draft: 13.5m Allows Scanner (non-invasive
Post- MHC 3
Quayline extension: 254m inspection)
Panamax Reach Stackers 12
vessels Surveillance cameras
Area: 86,615 m2
to dock Restricted access
Annual Capacity: 217,000 TEU at the
Port
21
7Tecon Vila do Conde TECON VILA DO CONDE
North Region: inland waterway cargo transportation
Vila do Conde x MACAPÁ - AP
Main Cargoes: Chemical Products
Vila do Conde x MUNGUBA Vila do Conde x BELÉM
Main Cargoes: Kaolin and Cellulose Main Cargo: Wood
VILA DO
CONDE
Vila do Conde x CAMETÁ
Main Cargo: Palm Oil
Vila do Conde x ALTAMIRA
Vila do Conde x MANAUS - AM Main Cargo: Machinery
Main Cargoes: Spare Parts and Vila do Conde x TUCURUÍ
Chemical Products Main Cargo: Silicon
Vila do Conde x SANTARÉM X ITAITUBA
Main Cargo: Wood
22Tecon Vila do Conde
Recent upgrade and capacity expansion to 217,000 TEU
23
7TEV - Vehicle Terminal
Largest vehicle terminal in Brazil
Neighbor to Tecon Santos
Handling of different types of cargo: trains, dismantled industrial
plants, power transformers, dismantled machinery, large sculptures
etc
Annual capacity: 300,000 vehicles
- Static capacity: 10,000 vehicles
- FY18 throughput: 241,291 vehicles
- Total area: 164,000 m²
- Quayline extension: 310 meters
24Logistics
Vertical integration
Taylor-made logistics services, integrating maritime transportation to
exporters’ and importers’ logistic chain
Potential to increase customers’ competitiveness: eg. the “K10”
logistics operation for BASF
Synergies between integrated logistics and port operations
Infrastructure:
- Distribution Center in São Bernardo do Campo (105,000m²)
- CLIA Guarujá (bonded warehouse - 52,900m²)
- CLIA Santos (bonded warehouse - 64,755m²)
TECON SANTOS
EXPORTS BONDED WAREHOUSING
Tecon Santos (left bank)
IMPORTS IMPORTS Clia Santos (right bank) EXPORTS
Container Clia Guarujá (left bank) Container
GROUND Transportation Transportation
TRANSPORTATION
DISTRIBUTION JUST-IN-TIME
CENTER DELIVERY 25
to industrialPlantsMain clients
Port terminals and Logistics
26Investments
R$ 4.9 billion(1) in 22 years
M&A CAPEX
1997 – Tecon Santos bidding 2004/2006 – Tecon Santos first expansion
2006 – Santos Brasil IPO 2008/2010 – Tecon Santos second expansion
2007 – Santos Brasil Logística acquisition 2008/2011 – Tecon Imbituba expansion
2008 – Tecon Imbituba bidding & Tecon Vila do Conde acquisition
2009 – Vehicles terminal bidding
M&A CAPEX
297
197
184
274 112 127 124
91 97 220 98 85
61 190 72
48 28 95 28
5 12 10 86 27 15 7
1997 1998 1999 2000 2001 2002 2003 2004 2005 2006 2007 2008 2009 2010 2011 2012 2013 2014 2015 2016 2017 2018
(1) IGP-M inflation adjusted 27Financial Highlights
EBITDA and EBITDA Mg.
Net Revenue (R$M) Net Revenue Breakdown (1Q19)
Logistics
Port Terminals 25%
(warehousing)
31%
Vehicle terminal
965 922 5%
829 824
214 227
Port Terminals
(quay)
2015 2016 2017 2018 1Q18 1Q19 36 39%
Pro Forma EBITDA² (R$M) and EBITDA margin (%) Net Income (R$M) and Net margin (%)
15.2% 3
10.5% 10.2% 11.6%
7.6%
4.3% (5) (6) (9)
0.3%
(23)
(28) -0.6%
147 -2.8%
-3.4%
107 -2.4%
87 84
16 10 -4.0%
2015 2016 2017 2018 1Q18 1Q19 2015 2016 2017 2018 1Q18 1Q19
(1) Does not consider intracompany eliminations 28
(2) Pro-forma EBITDA sum leasing expenses;Debt Leverage and Cash Flow
S&P – Corporate rating in national scale: brAAA EBITDA and EBITDA Mg.
Operating Cash Flow (R$M) Net Debt (R$M) and Net Debt / EBITDA pro-forma (1)
0.73x
0.46x
-0.25x
-0.45x -0.35x
108 -0.49x
168
40
122
108
75
16 22 (27) (33) (31)
(38)
2015 2016 2017 2018 1Q18 1Q19 2015 2016 2017 2018 1Q18 1Q19
Gross Debt (R$M) and Long Term Debt (%) Gross Debt – Currency Breakdown
Local Currency
59% Foreign currency
12% 3% 10%
43% 18% 22% 22%
34% 35%
29% 26%
88% 97% 90%
340 82% 78% 78%
233 233 227 220 218
2015 2016 2017 2018 1Q18 1Q19 2015 2016 2017 2018 1Q18 1Q19
29
(1) Last-twelve-month pro-forma EBITDADebt highlights and financial ratios
Net cash of R$ 31.4 million at 03/31/2019 EBITDA and EBITDA Mg.
Debt Amortization (R$M)
Debt Currency Outstanding (R$M) %
NCE BRL 126.9 58.2%
Finimp USD/EUR 16.9 7.8%
249
Finame BRL 2.8 1.3%
141
CCE USD 71.3 32.7%
44 9
24
Cash & Equivalents 2019 2020 2021 2022+ 36 Total 217.9 100.0%
Gross Debt - currency breakdown
Financial indicators – 1Q19
Debt leverage -0.35x net debt / pro-forma EBITDA LTM
48
Coverage ratio 1.7 pro-forma EBITDA LTM / interest expenses LTM
Current ratio 1.2 current assets / current liabilities
170
Quick ratio 1.2 (current assets - inventories) / current liabilities
Local Currency Foreign currency Cash ratio 0.8 cash & equivalents / current liabilities
30CapEx and Dividends
R$ million
Capital Expenditures Dividends and Interest on Equity distribution (R$M)
72
28 27
15 7 16
205
187 194
8% 3% 1% 3%
16% 1% 1%
9%
45% 38%
31%
16% 99% 99% 85
82% 70
51% 52% 42%
31
18
2014 2015 2016 2017 2018 1Q19 4 2 3
Port Terminals Logistics Corporate TEV Total (R$M)
2008 2009 2010 2011 2012 2013 2014 2015 2016 2017 2018Corporate Governance
All preferred shares converted to voting shares in 2016
“Novo Mercado” listing on B3 Shareholding Structure (May/19)
Treasury
0.4%
100% Tag Along for all minority shareholders
One Share, One Vote (no shareholders agreement) Others
24.5%
The Bank
Board of directors: 7 members formed by shareholders Richard
of New York
ADR
Klien Department
4.7%
29.8%
Permanent Fiscal Board
Multi STS
Participações
5.9%
Management: Dynamo
12.2% PW 237
- Stock Options, Performance Shares and Matching for key executives; Participações
22.4%
- Compensation program for managers and employees: EBITDA and EVA oriented;
- Individual performance plans = clear and targets;
- Progression, promotion and compensation based on meritocracy;
Total of 667,165,940 voting shares 32
(1) Includes the participation of the fund ‘RK Exclusivo FIA’
38Sustainability and Social Responsability
Member of the Global Compact, an international sustainability pact R$ 26 million invested in training over the last 6 years
Sustainability Report¹ compliant with GRI Standard since 2012 Annual average of 10.93 hours of training per employee
Sustainability Academy, an ongoing training for leaders
‘Formare Aprendiz’ program: 251 youngsters graduated since
2009 – 86 were hired
‘Eu Sou Voluntário’ program: 170 employees subscribed
Support to local projects for social insertion through education,
sports and development of physical, intellectual and/or sensorial
skills of handicapped child and teenagers
33
(1) Website: Santos Brasil - Sustainability
42IR contact, Web and Social Medias
dri@santosbrasil.com.br
+55 (11) 3279-3279
SantosBrasil
santosbrasil_
santosbrasiloficial
santos-brasil
45You can also read