Intra urban microclimate investigation in urban heat island through a novel mobile monitoring system - Nature
←
→
Page content transcription
If your browser does not render page correctly, please read the page content below
www.nature.com/scientificreports
OPEN Intra‑urban microclimate
investigation in urban heat island
through a novel mobile monitoring
system
Ioannis Kousis1,2, Ilaria Pigliautile1,2 & Anna Laura Pisello1,2*
Monitoring microclimate variables within cities with high accuracy is an ongoing challenge for a
better urban resilience to climate change. Assessing the intra-urban characteristics of a city is of
vital importance for ensuring fine living standards for citizens. Here, a novel mobile microclimate
station is applied for monitoring the main microclimatic variables regulating urban and intra-
urban environment, as well as directionally monitoring shortwave radiation and illuminance and
hence systematically map for the first time the effect of urban surfaces and anthropogenic heat.
We performed day-time and night-time monitoring campaigns within a historical city in Italy,
characterized by substantial urban structure differentiations. We found significant intra-urban
variations concerning variables such as air temperature and shortwave radiation. Moreover, the
proposed experimental framework may capture, for the very first time, significant directional
variations with respect to shortwave radiation and illuminance across the city at microclimate scale.
The presented mobile station represents therefore the key missing piece for exhaustively identifying
urban environmental quality, anthropogenic actions, and data driven modelling toward risk and
resilience planning. It can be therefore used in combination with satellite data, stable weather station
or other mobile stations, e.g. wearable sensing techniques, through a citizens’ science approach in
smart, livable, and sustainable cities in the near future.
Within recent decades the rural-to-urban population flow has substantially increased. In 2016, 54% of the world
population was reported to live in urbanised areas. At the same time, future projections of urbanization rates
are rather alarming. It is expected that by 2050 and 2100 the corresponding fraction will increase up to 66% and
85% respectively1. Urbanization is typically followed by high population and building density and consequent
land-use and surface alterations, e.g. deforestation, loss of f armland2,3. Natural-to-urban land alterations affect
in turn the local energy balance of cities and thus their microclimatic characteristics and thermal environment
in particular4,5. As a result, cities tend to systematically experience higher surface and air temperatures as com-
pared to the surrounding rural areas, a phenomenon reported as Urban Heat Island (UHI) effect6–9. The driving
physics behind UHI is the reduction in latent heat flux and increase in sensible heat flux10,11. UHI is a significant
human-induced environmental change that poses threats to human life. For instance, increased morbidity and
mortality12, indoor/outdoor d iscomfort13, air p
ollution14,15, increased energy c onsumption16 and greenhouse gas
17,18 19
emissions , impaired air and water q uality and intensification of energy poverty on vulnerable social groups
during the hot months of the y ear20,21 are just some of UHI consequences that usually are interconnected. Also,
UHI is associated with global warming and moreover has been found to synergistically act with heatwaves and
amplify their impacts22–24. Considering the projections linked to the ongoing climate change, the livability of
cities will be seriously endangered25. In fact, according to IPCC’s Representative Concentration Pathway (RCP)
8.5, global warming is expected to reach up to 1.5° above pre-industrial levels by 2050, and up to 2.0°–4.9° by
2100 as compared to 1861–188026,27. Thus, heat-related risk within urban canopy layers is likely to increase even
more in the very near future, making the urban population particularly vulnerable during periods of hot weather.
Measures for counterbalancing UHI and its aftermaths are deemed of critical importance. In fact, techniques
for controlling the variables regulating the urban microclimate are receiving increased attention from academics,
urban planners and policy-makers28–32. Quantifying, however, the magnitude of each microclimatic parameter
1
CIRIAF ‑ Interuniversity Research Center, University of Perugia, Via G. Duranti 67, 06125 Perugia,
Italy. 2Department of Engineering, University of Perugia, Via G. Duranti 97, 06125 Perugia, Italy. *email:
anna.pisello@unipg.it
Scientific Reports | (2021) 11:9732 | https://doi.org/10.1038/s41598-021-88344-y 1
Vol.:(0123456789)
www.nature.com/scientificreports/
Study Year Type Variables Speed City Scale Access
51
1998 Automobile,bicycle Tair – Vancouver, CASacramento, US Macro,micro Roadways,pedestrians
52
2000 Automobile Tair – Regina, CA Macro Roadways
47
2009 Automobile Tair 36 km/h Portland, US Macro Roadways
48
2012 Automobile Tair , WS, WD – Athens, GR Macro Roadways
34
2014 Automobile Tair , RHWS, WD – Padua, IT Macro Roadways
53
2014 Bicycle Tair , RH, WSSR radiation – Vienna, AT Micro Roadways
54
2016 Automobile Tair , , φ , h – Doha, QA Macro Roadways
49
2016 Automobile Tair – Roanoke, US Macro Roadways
55
2017 Automobile Tair , RH 50 km/h Adelaide, AU Macro Roadways
56
2018 Automobile Tair , , φ , h – Los Angeles, US Macro Roadways
37 Tair , RH, Pr, SR, E v , WS,WD, , φ , h,
2018 Helmet Walking speed Gubbio, IT Micro Pedestrians
CO2, CO, VOC
57 WS, WD , φ , h,dr, P, Tair/RH Tsur
2019 Automobile 30–40 km/h Seoul, KR Macro Roadways
SW, LW
58
2019 Motor vehicle Tair , RH – Tainan, TW Macro Roadways
59
2019 Automobile Tair , RH, WS, SR 18–36 km/h Delhi,INDhaka, BDFaisalabad, PK Macro Roadways
60
2019 Wearable Tair , RH Walking speed Lyon, FR Micro Pedestrians
50
2020 Automobile,hexacopter Tair , WSSR, Pr – Sydney, AU Macro Roadways
61
2020 Bicycle Tair , , φ , h 15 km/h Seville, SP Macro Roadways
Table 1. Studies with mobile traverse monitoring methods. Tair is air temperature, RH is relative humidity,
WS and WD are wind speed and direction, SR and LR are short-wave and long-wave incident radiation, P is
pressure, E v is illuminance, is Longitude, φ is latitude, h is altitude and dr is precipitation.
is not trivial, especially because affected by dynamic and granular anthropogenic forcing. Instead, due to the
complex morphology of urban areas, microclimatic conditions have been found to significantly vary not only
among different cities but also among different locations of the very same c ity33. For instance, UHI incidences has
been found not only between urban and rural areas but also between urban and suburban a reas34,35. In general,
the profile of each investigated urban microclimate is determined by the unique characteristics of the correspond-
ing area36. Therefore, the intrinsic inhomogeneity of urban microclimate needs to be in-depth investigated with
respect to the spatio-temporal variations originated from the local morphology, anthropogenic actions, urban
planning, and temporal weather c onditions37–39. For precisely determining the gradient and the intra-urban
deviations of microclimatic variables, their spatial extent needs to be thoroughly delineated. Mapping out each
variable’s footprint can result in a better understanding and evaluation of cities’ function, as well as decreased
biases concerning local phenomena, such as UHI magnitude and its consequent heat stress and risk mapping.
Furthermore, more efficient comparison analysis among relevant studies will be f easible40.
Traditionally, in-situ meteorological stations have been implemented for measuring parameters such as air
temperature and humidity, in and out of the city. For instance, Santamouris et al.41 utilised and retrieved data
from a network of 23 experimental weather station within the city of Athens and gauged the corresponding UHI
magnitude while the same did Yang et al.16 in the city of Nanjing, China and Foisard et al.42 within the city of
Rennes, France by implementing networks of 15 and 22 weather stations, respectively. Similarly, Richard et al.43
employed an extended network of 47 fixed air temperature sensors for identifying thermal zones within the city
of Dijon, France during a 3-week heatwave. Another sensor network of high density is established by the Bir-
mingham Urban Climate Laboratory and comprises 29 sensors distributed within the entire city of Birmingham44.
Results of such studies are of critical importance since not only gauge the magnitude of local phenomena, such
as UHI, but also shed light on the corresponding mechanisms of urban climate and hence help towards efficient
countermeasures. However, since in most cases meteorological stations are sparsely distributed, data retrieved
from this method represent a point-wise momentum of each microclimatic variable and not the overall footprint
and the corresponding spatial patterns16.
To overcome this limitation, recent studies employed remote sensing techniques. In fact, land surface tem-
perature (LST) data from satellites have been widely utilised for measuring the magnitude of microclimatic
variables determining surface UHI mainly due to their high spatial resolution. For example, several studies used
MODIS LST d ata45,46 for assessing UHI and its drivers within high populated cities in China. However, due to
their typically low temporal resolution, together with lack of direct air temperature profiles, data retrieved from
satellites cannot be used for evaluating an extensive intra-urban distribution of UHI.
Under this framework, mobile meteorological units, placed typically on motorized vehicles, are becoming
popular among academics for determining the spatial variability of microclimatic variables within a city. Table 1
gives a brief overview of relevant published scientific works. Unlike fixed units, mobile stations can offer data
acquisition of higher spatial resolution within the desired urban context and thus can be used for identifying
the intra-urban diversifications of the parameters affecting the urban microclimate and consequently human
well-being. For instance, Hart and S ailor47 utilised vehicular temperature traverses in order to determine the
spatial variability of air temperature at two-meter height across the metropolitan area of Portland, US. Santa-
mouris et al.48 developed a mobile weather station on a telescopic mast placed atop of a vehicular van capable of
Scientific Reports | (2021) 11:9732 | https://doi.org/10.1038/s41598-021-88344-y 2
Vol:.(1234567890)
www.nature.com/scientificreports/
Sensor Unit Monitored variable Specifications Orientation
GMX501 1 Tair Accuracy : ±0.3° @ 20° resolution: 0.1° –
Accuracy : ±2% @ 20° (10–60% RH)
RH –
resolution: 1%
Accuracy : ±3% @ 40 m/s resolution:
WS –
0.001 m/s
WD Accuracy : ±3° @ 40 m/s resolution: 1°
Accuracy : ±0.5 hPa @ 25° resolution:
P –
0.1 hPa
SR Spectral range: 300–3000 nm 1 W/mq Downward
Downward, leftward, rightward, forward,
DH2021T 8.1 1, 2, 3, 4, 5 Ev Range: 0–10000 lx
upward
Range: 0–2000 ppm accuracy: ± (50 ppm
EE820 1 CO2 –
+2% of measured value)
PT100 2, 3, 4 Tair Resolution: 0.1° –
Spectral range: 285–3000 nm calibration
SR05 2, 3, 4, 5 SR Leftward, rightward, forward upward
uncertainty: < 1.8%
LCT-12 3 PM10 Resolution: 1/4096 Accuracy: < 1% –
Table 2. Characteristics of the sensors comprised by the station.
measuring air temperature, wind speed, and direction at different heights with time-step of 30 s and performed
a monitoring campaign before and after the implementation of cool pavements in an urban park at the city of
Athens, Greece. Similarly, Busato et al.34 assessed UHI incidences within the city of Padua, Italy through the
development and utilisation of a mobile weather station built on a vehicle and capable to measure air tempera-
ture, relative humidity, and solar global radiation with a time-step of 5 s. Mobile weather units were employed
also in the study of Parece et al.49 aiming to capture spatial patterns of air temperature (2 s time-step) across the
Roanoke, Virginia, USA. Santamouris et al.50 also developed a mobile weather station, called “EnergyBus”, that
measures air temperature, relative humidity, pressure, and wind speed.
Moreover, mobile weather stations have been also developed on human-wearable h elmet37 and trolleys62 in
order to monitor pedestrian pathways and the corresponding thermal comfort. Nevertheless, areas of vehicular
traffic dominate typically the outdoor urban e nvironment63. Hence understanding the differing and localized
patterns of the parameters that regulate the corresponding microclimate through an exhaustive monitoring
techniques is of primary importance. That said, both weather variables, such as temperature, humidity, wind
speed and direction, and parameters, such as materials implemented into the built environment, must be taken
into consideration. Subsequently, thermal environment and comfort can be efficiently accessed and evaluated
for safeguarding the well-being of the citizens.
Under this framework, this study aims to contribute towards detailed monitoring techniques that can iden-
tify the environmental quality of urban areas and hence safeguard fine standards of the corresponding risk and
resilience planning. It presents the application of an advanced mobile weather station within a city of central
Italy. The mobile station can monitor profiles of the main parameters that regulate the lower levels of a typical
urban canopy layer. More specifically, it can monitor not only scalar or vector variables such as air temperature,
humidity, wind profile, and air pollutants’ concentration, but also directionally dependent variables, such as
reflected and diffused shortwave radiation and illuminance that are typically affected by the properties of urban
surfaces. The start-up of the novel methodology is demonstrated through two transect campaigns during the
winter period of 2020 within the historical city of Perugia, Italy. The main variables that define the quality of a
typical urban environment were subsequently mapped and evaluated in terms of intra-urban variations within
districts of different morphology.
Methods
The mobile monitoring station includes five units equipped on the 3D surface of the vehicle (Fig. 1). All units
are placed above a specifically designed wooden base for minimizing possible affections originated from the
van surface. Each unit comprises various sensors (Table 2). The variables measured by the mobile station are
air temperature, relative humidity, solar global radiation, illuminance, CO2 and PM10 concentration, and wind
speed and direction. Incoming short-wave radiation is among the main regulators of urban microclimate and
it is typically measured by a pyranometer facing directly the sky. However, this method is not adequate for
accurately depicting solar radiation at a specific height since it compromises shortwave radiation reflected from
surfaces at lower heights.
For that reason, in order to ensure an accurate point-wise microclimatic representation of the investigated
route, the mobile station presented here is equipped with five pyranometers each one facing towards a different
direction. Similarly, five luxmeters were placed towards different orientations for capturing directional illumi-
nance. In more detail, solar global radiation and illuminance are measured each by five different sensors oriented
towards (1) the sky, (2) the street, the (3) right, the (4) left, and the (5) backside of the vehicle. The sensors are
positioned on the top and back facades of the vehicle so as to minimize both external interferences, e.g. shad-
ing effects, and overlapping incidences. Furthermore, in order to ensure an accurate air temperature profile, a
Scientific Reports | (2021) 11:9732 | https://doi.org/10.1038/s41598-021-88344-y 3
Vol.:(0123456789)
www.nature.com/scientificreports/
Figure 1. Monitoring system scheme.
corresponding probe is placed in each of the five units. It should be mentioned that in the present study the air
temperature probe of unit no. 5 was not utilized. All measurements are taken at the same timestamp every 10 s.
The sensor’s main characteristics, such as operation range, accuracy, and sensitivity error are opted for ensur-
ing the desired level of precision of the corresponding variables. All the main technical characteristics of the
installed sensors are summarized in Table 2. Furthermore, since the station is mobile, apart from monitoring
micrometeorological parameters, data related to the specific position of the sensors are retrieved by a Global
Positioning System (GPS) antenna which is also installed on the vehicle. Therefore, all variable measurements
can be directly linked with the corresponding latitude, longitude, and altitude as collected by the GPS antenna
that has a Circular Error Probability (CEP) of less than 2.5 m in sky clear view conditions. The spatial accuracy
is expected to be lower when the system is located in an urbanized environment, but the error is assumed as
acceptable since data points are collected almost every 50 m and the analysis is focused on areas of monitoring
path length of 1.2 km at the minimum, as better specified in section 2.1 (Table 4). Furthermore, the GPS antenna
is specifically integrated within the wind speed/direction sensor for correcting direction misalignment due to
the vehicle’s motion. Further information about the correction algorithm can be found in64.
Once the transect is concluded, data loggers of the designed configuration automatically generate a “.csv” file
in which all data are saved. Data retrieved from the GPS antenna are also included in the same file and were uti-
lized for intra-urban illustration. In order to minimize overheating incidences and ensure aspiration by vehicle’s
motion to the extent possible, the sensors of temperature were placed and ventilated in a PVC radiation shield.
All sensors utilised in this study are commercially available products, thus are tested, validated and certified in
terms of accuracy by the producing company following the corresponding protocol and standards.
Monitoring campaigns. Apart from the development and presentation of the mobile monitoring station
this study aims to report on two startup monitoring campaigns, performed on weekdays. In order to demon-
strate the suitability of the proposed monitoring architecture both campaigns represent data collection at two
significant day-times for microclimate investigation purposes, i.e. day-time (around solar noon) and night-time
(after sunset and thus in absence of incoming shortwave radiation). The monitoring campaigns were carried out
by the authors during the months of January and February of 2020, i.e. in winter conditions. The winter period is
a rather under-reported period in terms of mobile microclimate monitoring, while the UHI phenomenon could
lead up to +9° in core cities with respect to rural surroundings65. Moreover, during the winter period, the city of
Perugia is characterized by standard anthropogenic actions, e.g. standard working and school schedules, affect-
ing the thermal environment and air quality, whilst during the summer period, possible biases may occur due
to tourism forcing and varied school and working schedules. Previous studies showed that correlations between
microclimate parameters and urban morphology are more accurate in terms of statistical significance during
clear sky conditions and generally stable boundary conditions37. Hence, one clear sky day-time and one clear sky
night-time days were chosen for carrying out the presented monitoring campaigns (Table 3).
Scientific Reports | (2021) 11:9732 | https://doi.org/10.1038/s41598-021-88344-y 4
Vol:.(1234567890)
www.nature.com/scientificreports/
Monitoring day Time of the day Start-time End-time Abbreviation
23/01/2020 Day-time 12:34 13:27 day 1
13/02/2020 Night-time 17:49 19:02 day 2
Table 3. Monitoring days and their abbreviation.
Figure 2. Pathway of monitoring campaigns, made via GPS Visualizer online application (https://www.gpsvi
sualizer.com/).
Clustered area Coverage in progressive distnace in m Abbreviation
Suburbs 0–4600 Suburbs-1
Train 4600–7900 Train-1
Center 7900–14,100 Center
Train 14,100–15,300 Train-2
Suburbs 15,300-end Suburbs-2
Table 4. Clustered areas’ details.
Both monitoring campaigns followed the very same pathway within the city of Perugia, in central Italy.
According to the Köppen and Geiger classification, Perugia is classified as Cfa and is characterized by humid
subtropical climate c onditions66. The pathway (Fig. 2) is almost circular and ends where it starts. It is specifically
planned to pass through and monitor areas characterized by different types of (1) urban morphology, (2) land-
use, and (3) human activity. Under this scenario, three significantly different areas in a radius of almost 2 km
from the main train station of the city were identified. These areas present different building densities, prevailing
built materials, and amount of greenery and were already identified in previously published research of the same
authors in Pigliautile et al.67. More specifically, the case study city of Perugia presents an urban structure that
comprises: (1) a hilly Medieval city center which is densely built, mainly characterized by stones and bricks as
prevailing built materials, and not fully accessible by vehicles; (2) modern urban neighborhoods developed in
proximity of the main train station and the main infrastructures connecting the historical city to its surround-
ings, that are similarly characterized by mid-rise buildings but wider roads, a higher amount of pollutants and
anthropogenic heat sources, and prevailing asphalt and concrete as built materials; (3) suburbs that are outer
Scientific Reports | (2021) 11:9732 | https://doi.org/10.1038/s41598-021-88344-y 5
Vol.:(0123456789)
www.nature.com/scientificreports/
Figure 3. (a) 24 h air temperature profile for both day-1 and day-2, (b) 24 h solar global radiation profile for
both day-1 and day-2.
from the center, sparsely built, and with a higher amount of greenery. Further details of each area with respect to
the monitoring path can be found in Table 4. Moreover, the monitoring path was devised so as to be accessible
by the equipped van and to be completed in less than one hour in order to minimize the environmental data
elapsed time-dependency and thus to focus on spatial v ariability56. However, due to vehicular traffic, the day-2
monitoring transect exceeded the one-hour duration by 10 min.
Concerning mobile monitoring, a vehicle’s speed of 10 km/h is recommended by Oke36, while according to
Taha et al.56 measurements of air temperature at vehicle speed lower than 10 km/h should be discarded. Other
mobile monitoring studies, however, reported vehicle speeds above 30 km/h47,55,57,59. Here, in order to maintain
the lowest possible speed within the city area and get a substantial spatial resolution, vehicle speed was main-
tained around 20 km/h and hence measurements were taken approximately every 50 m.
Results and discussion
Boundary conditions. At first, data derived from a stable weather station built on the roof of the University
of Perugia68 were retrieved for defining the boundary conditions of each monitoring campaign in terms of air
temperature and shortwave radiation. As it can be seen in Fig. 3, profiles of air temperature are rather similar for
both days. The daily-mean air temperature values are 4.5 ◦ C and 7.4 ◦ C concerning day-1 and day-2, respectively.
Furthermore, the mean air temperature values during the time-frame of the monitoring campaigns are 9.4◦ C
and 9.3◦ C concerning day-1 and day-2, respectively, whilst the corresponding standard deviations are 0.4◦ C and
0.5◦ C, respectively. Similarly, the daily-mean value of incoming shortwave radiation is 110 W/m2 concerning
day-1, whilst the corresponding maximum value is 492 W/m2. The mean value of incoming shortwave radiation
during the day-time monitoring campaign of day-1 is 485 W/m2 and the corresponding standard deviation is
8 W/m2.
Intra‑urban profiles of the microclimatic variables. A representation of intra-urban variations of
some of the collected variables can be seen in Fig. 4 where air temperature (images a and d), CO2 (images b and
e), and PM10 (images c and f) profiles across the followed monitoring paths are depicted with respect to day-1
and day-2. Moreover, further information is given by varying dot size with respect to the desired variable. Here,
the size of each illustrated circle-point varies with respect to the corresponding specific humidity (SH) and wind
speed (WS) values concerning the air temperature and air pollutant images, respectively. Through this repre-
sentation, some elementary conclusions can be made, e.g. that high-temperature values occur simultaneously
with high values of specific humidity. Also, localized hot-spots with respect to each variable can be identified.
For instance, within the monitoring duration of day-1, the highest values of temperature were recorded on the
peripheral area of the city center and within the suburbs-2 area. On the night hours of day-2, the higher air
temperature values were recorded also in the area of the railway station and in the center. Similarly, the highest
values of CO2 and PM10 concentration were recorded mainly at both railway and its neighboring areas, espe-
cially on day-1. During the monitoring hours of day-2, the atmosphere within the investigated area was rather
clear in terms of PM10 concentration.
A more precise picture of the variable profiles can be observed through the illustration of the corresponding
time-series. In Fig. 5 the temperature profiles during the two monitoring campaigns are illustrated. A temperature
gradient ( Tmax ≈ 1.5◦ C ) can be seen between Train-1 and Center areas within day-1. An adverse but more
steady gradient can be seen within day-2.
The temperature substantially dropped ( Tmax ≈ −1.5◦ C ) while entering the Center area of the city and
substantially increased when approaching Train-2 area ( Tmax ≈ 1◦ C ). During both days, a steep drop and
increase of temperature can be spotted within the last meters of the Center area. This trend is more evident
within day-1 and is attributed to a substantial tree coverage within the specific street crossed in that area. Unlike
relative humidity, absolute humidity, do not depend on temperature. However, here, a rather stable profile of
Scientific Reports | (2021) 11:9732 | https://doi.org/10.1038/s41598-021-88344-y 6
Vol:.(1234567890)
www.nature.com/scientificreports/
Figure 4. Day-time/Night-time monitoring. (a) Day 1—air temperature (Tair) versus specific humidity (SH),
(b) day 1—CO2 concentration versus wind speed (WS), (c) day 1—PM10 concentration versus wind speed
(WS), (d) day 2—air temperature (Tair) versus specific humidity (SH), (e) day 2—CO2 concentration versus
wind speed (WS), (f) day 2—PM10 concentration versus wind speed (WS). Tair is in ◦ C, SH is in gv /kga, CO2
and PM10 in ppm, and WS in m/s2.
absolute humidity can be observed during both day-1 (Standard deviation = 0.2 g/m3) and day-2 (Standard
deviation = 0.1 g/m3), mainly due to the absence of water areas or large green areas. A similar profile is observed
for specific humidity profile with standard deviation that also do not overpass 0.2 gv /kga and 0.1 gv /kga during
day-1 and day-2, respectively (Fig. 6). Dewpoint temperature (DT) is an alternative way of capturing humidity
and comfort and it is regarded as a more accurate metric since it is an absolute measurement. Moreover, it is also
used to evaluate moisture, especially during spring and summer periods. During day-1 a significant gradient
( DTmax ≈ 0.5◦ C ) towards higher values can be seen as the station was moving from the Center area to the
Train-2 one. A rather adverse profile is observed during day-2. Dewpoint temperature decreased as entering into
Center area ( DTmax ≈ −0.6◦ C) and remained almost stable ( DTmax ≈ 4.8◦ C) up to the end of the campaign.
Figure 7 shows the concentration levels of CO2 and PM10, i.e. two key metrics of air pollution within an urban
microclimate. Concerning CO2, no substantial variations were recorded during both day-1 (Standard Deviation
= 27.4 ppm) and day-2 (Standard Deviation = 12.3 ppm) time monitoring campaigns. However, on day-1, a small
drop ( CO2max ≈ −70 ppm) of CO2 concentration can be noticed within Center area. At the same day and point
a small reduction ( PM102max ≈ −30 ppm) can be observed also for PM10 concentration. This drop is likely
due to the physical characteristics of the specific spot. It is an open-air spot and hence wind could locally remove
Scientific Reports | (2021) 11:9732 | https://doi.org/10.1038/s41598-021-88344-y 7
Vol.:(0123456789)
www.nature.com/scientificreports/

                                            Figure 5.  Air temperature and absolute humidity for (a) day 1, (b) day 2 monitoring. Vertical dotted lines stand
                                            for the boundaries in-between suburban (first and fifth section), train (second and forth section) and center area
                                            of the city.

                                            Figure 6.  Dew-point temperature and relative humidity (a) day 1, (b) day 2 monitoring. Vertical dotted lines
                                            stand for the boundaries in-between suburban (first and fifth section), train (second and forth section) and
                                            center area of the city.

                                            Figure 7.  CO2 and PM10 concentration (a) day 1, (b) day 2 monitoring. Vertical dotted lines stand for the
                                            boundaries in-between suburban (first and fifth section), train (second and forth section) and center area of the
                                            city.

          Scientific Reports |   (2021) 11:9732 |                https://doi.org/10.1038/s41598-021-88344-y                                                 8

Vol:.(1234567890)
www.nature.com/scientificreports/
Figure 8. Solar-wave radiation and illuminance (a) day 1, (b) day 2 monitoring. Vertical dotted lines stand for
the boundaries in-between suburban (first and fifth section), train (second and forth section) and center area of
the city.
Figure 9. Wind speed and direction (a) day 1, (b) day 2 monitoring. Vertical dotted lines stand for the
boundaries in-between suburban (first and fifth section), train (second and forth section) and center area of the
city.
pollutants. Also, a localized and short-term decrease in vehicular traffic might have occurred. Concerning PM10
during day-2, no significant variations were observed (Standard Deviation = 2.7 ppm).
Short-wave radiation regulates urban microclimate during the day-time, whilst illuminance is a good indicator
of anthropogenic action during the later hours of the day when sunlight is absent. Therefore, in Fig. 8 the profiles
of shortwave radiation and illuminance are presented for day-1 and day-2, respectively. The results presented in
this figure represent the average value of the data retrieved from the five sensors for both short-wave radiation
and illuminance. Globally speaking, both solar radiation and illuminance are depending on the climatic zone of
the investigated area, the time of the year, and the overall urban infrastructure. Of course, illuminance is a rather
sensitive variable affected by various boundary conditions and hence its values significantly fluctuate around the
mean value (Evmax = 347 lux and Evmin = 229 lux). Nevertheless, several peaks can be seen within Train-1, 2, and
Center areas where the most anthropogenic activities take place (Fig. 8b). Similar fluctuations were found also
concerning shortwave radiation (Fig. 8a). Overall, shortwave radiation follows a somehow similar profile with
air temperature. For example, an increase ( SRmax ≈ 100 w/m2) can be seen as entering the Train-1 zone, while
a steep drop up to 205 w/m2 can be seen within the Center area when the station turned to a well-shaded street.
The highest values were measured within the substantially unshaded areas of Suburbs-1 and 2.
Day-1 and 2 were specifically chosen for the presented monitoring campaigns due to their relatively stable
boundary conditions. As a result, wind speed deviations were rather small (Fig. 9), i.e. the wind speed standard
deviations were 2.1 m/s2 and 1.8 m/s2 for day-1 and day-2 respectively. Two peaks can be observed as entering
and leaving from the Center area owing to the corresponding open-air location, while inside the historic walls
where the streets are substantially narrower wind speed was lower. Wind direction was in general towards North
either North–East (0◦–90◦ ) or North–West (270◦–360◦ ). It should be noted that the highest values of wind speed
occurred most of the time together with North–East wind.
Figure 10 presents the deviation of air temperature and absolute humidity with respect to the corresponding
mean value. Significant deviations have been found concerning air temperature within both monitoring cam-
paigns. For instance, during day-1 deviations ranged from − 1.1 to 1.3 ◦ C. The peak negative deviation from the
Scientific Reports | (2021) 11:9732 | https://doi.org/10.1038/s41598-021-88344-y 9
Vol.:(0123456789)
www.nature.com/scientificreports/

                                            Figure 10.  Deviations from the mean value. (a) day 1—air temperature and absolute humidity, (b) day 2—air
                                            temperature and absolute humidity. Vertical dotted lines stand for the boundaries in-between suburban (first
                                            and fifth section), train (second and forth section) and center area of the city.

                                            Figure 11.  Cluster analysis of air temperature and air pollutants.

                                            mean value, i.e. 9.9 ◦ C, was recorded as approaching the Train-1 area while the first positive peak deviation was
                                            recorded within the Center area. Even higher positive peak deviation values were recorded within Suburbs-2
                                            area owing to their unshaded and open-air environment. A rather adverse profile can be observed during day-2.
                                            The corresponding deviations ranged from − 1.0 to 0.8◦ C. However, the global positive peak deviation was found
                                            for the Train-1 area while the global negative peak was found for the Center area. On the other hand, absolute
                                            humidity deviations as compared to the average value were found rather low.
                                                In Fig. 11, a cluster analysis of the monitoring path can be seen with respect to different areas of the city.
                                            During day-1, the highest values of air temperature (Fig. 11a) were recorded within the suburbs 2 area. The
                                            air temperature was slightly lower within Train 2 and Center areas. However, concerning the latter area, the
                                            distribution was wider since this area comprises both narrow streets and open places. On the other hand,
                                            during day-2, the lowest air temperature values were recorded in Center area and the highest in the Suburbs
                                            1 (Fig. 11b). Concerning CO2, during day-1, the higher concentration values were recorded within the Train
                                            and Center areas (Fig. 11c), while during the day-2, except for Suburbs 1 area, all areas were found with rather
                                            similar concentration values (Fig. 11d). Concerning PM10, during day-1, the concentration within the Center
                                            area was found slightly lower as compared to the rest areas (Fig. 11e), while during day-2, a rather inverse profile
                                            was recorded Fig. 11f). In Fig. 12 the directional profiles of shortwave radiation (day-1) and illuminance (day-2)
                                            are presented at different spots within the monitoring path. As it can be seen, especially for the shortwave radia-
                                            tion, the direction of the incident radiation varies among different spots within the city, due to the varied urban
                                            morphology, e.g. open-air areas in the suburbs and narrow streets within the center area. On the other hand,

          Scientific Reports |   (2021) 11:9732 |                https://doi.org/10.1038/s41598-021-88344-y                                                  10

Vol:.(1234567890)
www.nature.com/scientificreports/
Figure 12. Directional representation of shortwave radiation (W/m2—left column) and illuminance (lux—
right column). The monitoring path map was made via GPS Visualizer online application (https://www.gpsvi
sualizer.com/).
illuminance levels during night-time transect did not vary substantially in terms of incident light direction but
in terms of absolute value.
Statistical analysis of the experimental data. Descriptive statistics. Figure 13 illustrates the proba-
bility density and the central tendency of the monitored variables during the campaigns. Air temperature within
day-1 is distributed approximately from 8 to 12 ◦ C with a mean value equal to 9.9◦ C, while on day-2 air tempera-
ture is distributed from 10 to 13.4◦ C with a mean value equal to 12.1◦ C. Temperature values were slightly higher
during the night-time monitoring campaign due to the imminent ending of the winter period. On the contrary,
absolute humidity values of day-2 were lower than the ones of day-1 with corresponding mean values equal to
6.9 g/m3 and 6.3 g/m3 respectively. The distributions of air pollutants, i.e. CO2 and PM10, can be seen on Fig. 13.
The widest distribution, as well as the highest values concerning both CO2 and PM10, occurred on day-1, most
likely due to higher vehicular traffic and other human-induced activities that take place more frequently during
the daytime. The corresponding mean values are 484 ppm and 56 ppm concerning CO2 and PM10 respectively.
During day-2 CO2 concentration is distributed within 413–477 ppm with a mean value equal to 443 ppm while
PM10 concentration varies within 2–21 ppm with a mean value equal to 9 ppm. Shortwave radiation values dur-
ing day-1 followed a rather wide distribution owing to urban morphology variations. In fact, shortwave radia-
tion is distributed from 11 to 496 W/m2 with a mean value equal to 196 W/m2. A slightly narrower distribution
is observed concerning illuminance during day-2, with values varying from 229 to 347 lux and a mean value
equal to 274 lux.
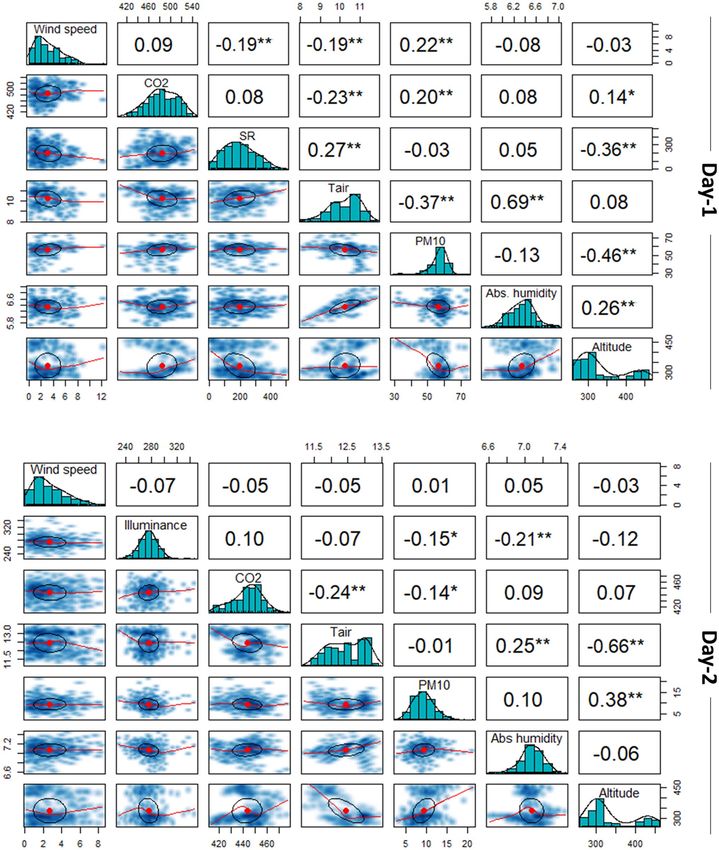
Correlation analysis. A Pearson’s correlation analysis, was performed for investigating possible primary linear
relationships among the measured microclimate variables. The corresponding results are illustrated in Fig. 14.
The diagonal of each matrix comprises variable histograms with kernel density estimations and the correspond-
ing rug plots. On the part above the diagonal, the correlation coefficients are reported, whilst on the part below
the diagonal the corresponding scatter plots with local regression (loess) fitted lines and covariance ellipses for
displaying the strength of the relationship can be seen69,70.
During the day-time monitoring campaign, the most significant relationship was positive and found for air
temperature and absolute humidity, i.e. r = .69, p < .001. Other moderate relationships were found for altitude and
PM10 (r = .46, p < .001) and air temperature and PM10). Likewise, primary relationships within the measured
variables were moderate to low during night-time monitoring. A negative primary relationship was observed
concerning altitude and air temperature (r = − .66, p < .001) on day-2. In addition, during the same day, a posi-
tive relationship can be seen for altitude and PM10 (r = .38, p < .001).
Multiple linear regression analysis. Multiple linear regression was employed to further investigate the rela-
tionship between air temperature, i.e. dependent variable, and the other measured microclimate parameters,
i.e. independent explanatory variables. Air temperature is chosen as the dependent variable since is the main
parameter that directly demonstrates the thermal environment of a typical urban environment. Moreover, data-
Scientific Reports | (2021) 11:9732 | https://doi.org/10.1038/s41598-021-88344-y 11
Vol.:(0123456789)www.nature.com/scientificreports/
Figure 13. Probability density and boxplot of the measured variables within (a) day 1, (b) day 2.
sets of both day-1 and day-2 meet the main assumptions of linear regression, i.e. multivariate normality, no
multicollinearity, and homoscedasticity. The standardized residuals of the regression, i.e. the errors between
observed and predicted values, are normally distributed (Fig. 15a,b). There is no evidence of significant multi-
collinearity since Variance Inflation Factors (VIF) of all explanatory variable are less than 4 and rather close to 1
(Tables 5 and 6) and the correlations among all independent variables have correlation coefficients less than .80
(Fig. 15). In addition, as it can be seen in Fig. 15c,d, the variance of the standardized residuals across the inde-
pendent variables and the Loess-locally fit regression red-line that approximates zero, show now clear patterns
across all levels of the independent variables.
Concerning both day-1 and day-2, the p-value of model’s F-statistic is < 2.2e−16, which is statistically sig-
nificant, i.e. at least one explanatory variable is significantly related to the air temperature. Concerning day-1, a
significant relationship with p < .001 is found between air temperature and each of absolute humidity, PM10, CO2
and short-wave radiation (SR), whilst a significant relationship with p = .003 is found between air temperature
and altitude (h). Concerning day-2, a significant relationship with p < .001 is found between air temperature
and each of absolute humidity, PM10, CO2 , short-wave radiation (SR), and altitude (h), whilst a significant
relationship with p = .001 is found between air temperature and wind speed (WS). The values of the adjusted
R-squared suggest that the models explain a 68% and 58% of the variance of air temperature, concerning day-1
and day-2, respectively.
Conclusions
The current study reports on the application of advanced mobile monitoring techniques within a historical
lively city of central Italy. Locating hot-spots with respect to each microclimate parameter, as well as identifying
possible relationships among them is not trivial. Each city is characterized by its specific peculiarities. Perugia,
Scientific Reports | (2021) 11:9732 | https://doi.org/10.1038/s41598-021-88344-y 12
Vol:.(1234567890)www.nature.com/scientificreports/
Figure 14. Correlation coefficients for day-1 and day-2. One star (‘*’) and two stars (‘**’) denote that the
corresponding variable is significant at 5% and 1% level, respectively. Absence of star denotes no significant
variable.
the city chosen for the present study, is characterized by a diverse morphology. It comprises a city center with
narrow and shaded streets with limited vehicular traffic, a more recent neighborhood developed around the main
train station with substantial anthropogenic action, and several mostly residential suburban areas with open-air
Scientific Reports | (2021) 11:9732 | https://doi.org/10.1038/s41598-021-88344-y 13
Vol.:(0123456789)www.nature.com/scientificreports/
Figure 15. Residual analysis: (a) Histogram of frequency for day-1, (b) Residuals versus fits plot for day-1, (c)
Histogram of frequency for day-2, (d) Residuals versus fits plot for day-2.
Confidence intervals
Estimate Std. Error t value p-value 2.5 % 97.5 % VIF
(Intercept) 0.661 0.807 0.819 0.413 − 0.926 2.248 –
SR 0.002 0.000 5.478 8.76e−08 0.001 0.002 1.336
h − 0.002 0.001 − 3.007 0.003 − 0.003 − 0.001 1.823
CO2 − 0.006 0.001 − 6.431 4.65e−10 − 0.008 − 0.004 1.182
PM10 − 0.032 0.004 − 7.089 8.84e−12 − 0.041 − 0.023 1.550
WS − 0.009 0.012 − 0.726 0.468 − 0.033 0.015 1.095
AH 2.314 0.112 20.716 < 2e−16 2.094 2.534 1.010
F-statistic: 112.1
p-value < 2.2e−16
Adjusted R-squared 0.679
Table 5. Outcomes of the multiple linear regression—day-1. SR is Short-wave radiation, h is altitude, WS is
wind speed and AH is absolute humidity.
Confidence Intervals
Estimate Std. error t value p-value 2.5 % 97.5 % VIF
(Intercept) 13.079 1.119 11.687 < 2e−16 10.879 15.279 –
h − 0.007 0.000 − 21.098 < 2e−16 − 0.007 − 0.005 1.223
CO2 − 0.007 0.001 − 5.163 3.73e−07 − 0.009 − 0.004 1.071
PM10 0.043 0.007 6.224 1.15e−09 0.029 0.056 1.239
WS − 0.031 0.009 − 3.249 0.001 0.056 − 0.012 1.009
AH 0.735 0.129 5.679 2.50e−08 0.481 0.989 1.089
Ev − 0.003 0.001 − 2.450 0.015 − 0.004 − 0.001 1.091
F-statistic: 97.89
p-valuewww.nature.com/scientificreports/
Absolute humidity CO2 concentration Pm10 concentration Solar radiation
Air Temperature (◦ C) (g/m3 ) (ppm) (ppm) (W/m2) Illuminance (lux) Wind speed (m/s2)
Day-1 3.2 1.3 136 45 484.1 – 12.3
Day-2 2.3 0.8 64 19 – 118 8.3
Table 7. Maximum variations of measured variables across the monitoring path.
streets, and greenery. Here, a novel mobile monitoring station is implemented for monitoring the main micro-
meteorological variables that affect climate and environment with high spatial granularity for both microscale,
i.e. neighborhood-scale, and mesoscale, i.e. city-scale. The developed station can be easily adjusted to different
type of vehicles such public transportation, electric cars or other dedicated monitoring vehicles. The main stimu-
lus of its development was to gauge and map intra-urban deviations of the main variables determining urban
microclimate, also imputable to anthropogenic actions. In this view, the scale of the analysis here reported is the
neighborhood scale. Nevertheless, the system’s potentiality in retrieving analysis at higher-granularity is pointed
out as well. Following an observational mobile-transect methodology, the station can access and monitor almost
all areas accessible by car. Unlike mobile monitoring techniques implemented to date on a macro-scale within
urban areas, the presented technique succeeds the detailed monitoring of scalar, vector, and directionally depend-
ent variables. A start-up assessment was carried out in winter conditions, a period under-reported in particular
in terms of mobile monitoring, and UHI studies. Results showed that determinants of urban microclimate and
hence the quality of the urban environment can substantially vary within the very same urban context and with
time (Table 7). Moreover, the direction of the incident shortwave radiation varied substantially among different
spots of the monitoring path during the day-time transect. A directional dependency was found also for the
illuminance levels during night-time transect. Overall, the outcomes of the study may represent a key missing
piece for a state-of-the-art characterization of urban environmental quality. A more accurate discussion upon
spatial accuracy achievable through the monitoring system according to its technical specifics and the data col-
lection procedure is going to be provided in future research pushing forward a finer intra-urban microclimate
variability description. Furthermore, future studies, aiming to extensively monitor and characterize specific
urban environments, with respect also to temporal variations, should comprise a large number of transects dur-
ing various hours of the day. Special focus should be given on the development of standards concerning elapsed
time-correction of the data due to weather boundaries variation with respect to the duration of the transects, as
well as on the seasonal comparison of parameters’ profiles and accurate calibration of the sensors prior to the
monitoring campaigns. Further evaluation of urban environments under the framework of a wide monitoring
network comprising also satellite and stable weather station data or other mobile stations, e.g. bicycle and wear-
able sensing techniques, can contribute towards effective data-driven decision-making policies with respect to
risk and urban resilience planning.
Received: 5 December 2020; Accepted: 5 April 2021
References
1. DESA UN. World urbanization prospects: The 2014 revision. United Nations Department of Economics and Social Affairs, Popula-
tion Division: New York, NY, USA, 41 (2015).
2. Aabshar, U. K. I. & Uttam, K. B. Urbanisation and greening of Indian cities: problems, practices, and policies. Ambio 45(4), 442–457
(2016).
3. Nurwanda, A. & Honjo, T. The prediction of city expansion and land surface temperature in Bogor city, Indonesia. Sustain. Cities
Soc. 52, 101772 (2020).
4. Ghandehari, M., Emig, T. & Aghamohamadnia, M. Surface temperatures in New York city: geospatial data enables the accurate
prediction of radiative heat transfer. Sci. Rep. 8(1), 1–10 (2018).
5. Peng, J., Yaxin, H., Dong, J., Liu, Q. & Liu, Y. Quantifying spatial morphology and connectivity of urban heat islands in a megacity:
a radius approach. Sci. Total Environ. 714, 136792 (2020).
6. Luke, H. The Climate of London, Volume 1. W. Phillips, sold also by J. and A. Arch, 1818.
7. Oke, T. R. City size and the urban heat Island. Atmos. Environ. (1967) 7(8), 769–779 (1973).
8. Stewart, I. D. A systematic review and scientific critique of methodology in modern urban heat Island literature. Int. J. Climatol.
31(2), 200–217 (2011).
9. Kousis, I. & Pisello, A. L. For the mitigation of urban heat Island and urban noise Island: two simultaneous sides of urban discom-
fort. Environ. Res. Lett. 15(10), 103004 (2020).
10. Arnfield, A. J. Two decades of urban climate research: a review of turbulence, exchanges of energy and water, and the urban heat
Island. Int. J. Climatol. J. R. Meteorol. Soc. 23(1), 1–26 (2003).
11. Gao, K., Santamouris, M. & Feng, J. On the cooling potential of irrigation to mitigate urban heat Island. Sci. Total Environ. 740,
139754 (2020).
12. Tsekeri, E., Kolokotsa, D. & Santamouris, M. On the association of ambient temperature and elderly mortality in a Mediterranean
Island—crete. Sci. Total Environ. 738, 139843 (2020).
13. Arghavani, S., Malakooti, H. & Bidokhti, A. A. A. A. Numerical assessment of the urban green space scenarios on urban heat Island
and thermal comfort level in Tehran metropolis. J. Clean. Prod. 261, 121183 (2020).
14. Baró, F. et al. Contribution of ecosystem services to air quality and climate change mitigation policies: the case of urban forests in
Barcelona, Spain. Ambio 43(4), 466–479 (2014).
15. Grennfelt, P. et al. Acid rain and air pollution: 50 years of progress in environmental science and policy. Ambio 49, 1–16 (2020).
16. Yang, X. et al. Impact of urban heat island on energy demand in buildings: local climate zones in Nanjing. Appl. Energy 260, 114279
(2020).
Scientific Reports | (2021) 11:9732 | https://doi.org/10.1038/s41598-021-88344-y 15
Vol.:(0123456789)www.nature.com/scientificreports/
17. Roldán-Fontana, J., Pacheco-Torres, R., Jadraque-Gago, E. & Ordóñez, J. Optimization of co2 emissions in the design phases of
urban planning, based on geometric characteristics: a case study of a low-density urban area in Spain. Sustain. Sci. 12(1), 65–85
(2017).
18. Roxon, J., Ulm, F.-J. & Pellenq, R.J.-M. Urban heat island impact on state residential energy cost and co2 emissions in the United
States. Urban Clim. 31, 100546 (2020).
19. Estoque, R. C. et al. Heat health risk assessment in Philippine cities using remotely sensed data and social-ecological indicators.
Nat. Commun. 11(1), 1–12 (2020).
20. Santamouris, M. Innovating to zero the building sector in Europe: minimising the energy consumption, eradication of the energy
poverty and mitigating the local climate change. Sol. Energy 128, 61–94 (2016).
21. Kousis, I., Laskari, M., Ntouros, V., Assimakopoulos, M.-N. & Romanowicz, J. An analysis of the determining factors of fuel poverty
among students living in the private-rented sector in Europe and its impact on their well-being. Energy Sources Part B Econ. Plan.
Policy 15(2), 113–135 (2020).
22. Founda, D. & Santamouris, M. Synergies between urban heat island and heat waves in Athens (Greece), during an extremely hot
summer (2012). Sci. Rep. 7(1), 1–11 (2017).
23. Pyrgou, A., Hadjinicolaou, P. & Santamouris, M. Enhanced near-surface ozone under heatwave conditions in a Mediterranean
Island. Sci. Rep. 8(1), 9191 (2018).
24. Pyrgou, A., Hadjinicolaou, P. & Santamouris, M. Urban-rural moisture contrast: regulator of the urban heat island and heatwaves’
synergy over a Mediterranean city. Environ. Res. 182, 109102 (2020).
25. Ginbo, T., Di Corato, L. & Hoffmann, R. Investing in climate change adaptation and mitigation: a methodological review of real-
options studies. Ambio 50, 229–241 (2020).
26. Collins, M., Knutti, R., Arblaster, J., Dufresne, J.-L., Fichefet, T., Friedlingstein, P., Gao, X., Gutowski, W.J., Johns, T., Krinner, G.
et al. Long-term climate change: projections, commitments and irreversibility. In Climate Change 2013-The Physical Science Basis:
Contribution of Working Group I to the Fifth Assessment Report of the Intergovernmental Panel on Climate Change, 1029–1136
(Cambridge University Press, 2013).
27. Kawase, H. et al. Enhancement of heavy daily snowfall in central Japan due to global warming as projected by large ensemble of
regional climate simulations. Clim. Change 139(2), 265–278 (2016).
28. Caplin, A., Ghandehari, M., Lim, C., Glimcher, P. & Thurston, G. Advancing environmental exposure assessment science to benefit
society. Nat. Commun. 10(1), 1–11 (2019).
29. Santamouris, M. Recent progress on urban overheating and heat Island research. Integrated assessment of the energy, environ-
mental, vulnerability and health impact. Synergies with the global climate change. Energy Build. 207, 109482 (2020).
30. Kousis, I., Fabiani, C., Ercolanoni, L. & Pisello, A. L. Using bio-oils for improving environmental performance of an advanced
resinous binder for pavement applications with heat and noise island mitigation potential. Sustain. Energy Technol. Assess. 39,
100706 (2020).
31. Sangiorgio, V., Fiorito, F. & Santamouris, M. Development of a holistic urban heat island evaluation methodology. Sci. Rep. 10(1),
1–13 (2020).
32. Kousis, I., Fabiani, C & Pisello, A.L. A study on the thermo-optical behaviour of phosphorescent coatings for passive cooling
applications. In E3S Web of Conferences, vol. 238, 06002 (2021).
33. Alonso, L. & Renard, F. A new approach for understanding urban microclimate by integrating complementary predictors at dif-
ferent scales in regression and machine learning models. Remote Sens. 12(15), 2434 (2020).
34. Busato, F., Lazzarin, R. M. & Noro, M. Three years of study of the urban heat Island in Padua: experimental results. Sustain. Cities
Soc. 10, 251–258 (2014).
35. Yun, G. Y. et al. Predicting the magnitude and the characteristics of the urban heat island in coastal cities in the proximity of desert
landforms. The case of Sydney. Sci. Total Environ. 709, 136068 (2020).
36. Oke, T. R., Mills, G., Christen, A. & Voogt, J. A. Urban Climates (Cambridge University Press, 2017).
37. Pigliautile, I. & Pisello, A. L. A new wearable monitoring system for investigating pedestrians’ environmental conditions: develop-
ment of the experimental tool and start-up findings. Sci. Total Environ. 630, 690–706 (2018).
38. Pigliautile, I. & Pisello, A. L. Environmental data clustering analysis through wearable sensing techniques: new bottom-up process
aimed to identify intra-urban granular morphologies from pedestrian transects. Build. Environ. 171, 106641 (2020).
39. Haddad, S. et al. Holistic approach to assess co-benefits of local climate mitigation in a hot humid region of Australia. Sci. Rep.
10(1), 1–17 (2020).
40. Zhou, D., Zhao, S., Zhang, L., Sun, G. & Liu, Y. The footprint of urban heat island effect in China. Sci. Rep. 5(1), 1–11 (2015).
41. Santamouris, M., Paraponiaris, K. & Mihalakakou, G. Estimating the ecological footprint of the heat island effect over Athens,
Greece. Clim. Change 80(3–4), 265–276 (2007).
42. Foissard, X., Dubreuil, V. & Quénol, H. Defining scales of the land use effect to map the urban heat island in a mid-size European
city: Rennes (France). Urban Clim. 29, 100490 (2019).
43. Richard, Y. et al. How relevant are local climate zones and urban climate zones for urban climate research? Dijon (France) as a
case study. Urban Clim. 26, 258–274 (2018).
44. Chapman, L. et al. The Birmingham urban climate laboratory: an open meteorological test bed and challenges of the smart city.
Bull. Am. Meteorol. Soc. 96(9), 1545–1560 (2015).
45. Yao, R. et al. Interannual variations in surface urban heat island intensity and associated drivers in China. J. Environ. Manag. 222,
86–94 (2018).
46. Zhou, D., Bonafoni, S., Zhang, L. & Wang, R. Remote sensing of the urban heat island effect in a highly populated urban agglom-
eration area in East China. Sci. Total Environ. 628–629, 415–429 (2018).
47. Hart, M. A. & Sailor, D. J. Quantifying the influence of land-use and surface characteristics on spatial variability in the urban heat
island. Theor. Appl. Climatol. 95(3–4), 397–406 (2009).
48. Santamouris, M. et al. Using cool paving materials to improve microclimate of urban areas—-design realization and results of the
flisvos project. Build. Environ. 53, 128–136 (2012).
49. Parece T.E., Li J., Campbell J.B., Carroll D. Assessing urban landscape variables’ contributions to microclimates. Adv. Meteorol.
2016 (2016).
50. Santamouris, M. et al. Heat mitigation technologies can improve sustainability in cities An holistic experimental and numerical
impact assessment of urban overheating and related heat mitigation strategies on energy consumption, indoor comfort, vulner-
ability and heat-related mortality and morbidity in cities. Energy Build. 217, 110002 (2020).
51. Spronken-Smith, R. A. & Oke, T. R. The thermal regime of urban parks in two cities with different summer climates. Int. J. Remote
Sens. 19(11), 2085–2104 (1998).
52. Stewart, I. D. Influence of meteorological conditions on the intensity and form of the urban heat island effect in regina. Can. Geogr.
Le Géographe Can. 44(3), 271–285 (2000).
53. Dimitrova, B., Vuckovic M., Kiesel, K., Mahdavi, A. & Ecology, B. Trees and the microclimate of the urban canyon: a case study.
In Proceedings of the 2nd ICAUD International Conference in Architecture and Urban Design, Tirana, Albania (2014).
54. Makido, Y., Shandas, V., Ferwati, S. & Sailor, D. Daytime variation of urban heat islands: the case study of Doha, Qatar. Climate
4(2), 32 (2016).
Scientific Reports | (2021) 11:9732 | https://doi.org/10.1038/s41598-021-88344-y 16
Vol:.(1234567890)You can also read