Investor Presentation Q1 FY2019 - Presented by Shane Kimpton Eng Chiaw Koon Christian Johnstone - AusGroup
←
→
Page content transcription
If your browser does not render page correctly, please read the page content below
Investor Presentation Q1 FY2019
Presented by
Shane Kimpton
Eng Chiaw Koon
Christian Johnstone               November
Company structure

                                                                    AusGroup Ltd (Singapore)
                                                                    • Investor relations
                                                                    • Bank and noteholders
                                                                      interface

• Provides services across      • Provides access services across    • Supports offshore industry
  the energy, industrial and      the energy and resource sectors      through the provision of fuel &
  mining sectors                  in Australia and Asia                marine services
   _ Core maintenance              _ Scaffolding                        _ Fuel distribution and supply
   _ Construction                  _ Rope Access                        _ Marine logistics
   _ Fabrication                   _ Design, planning and               _ Equipment/module
   _ Painting, insulation and         engineering access systems          transportation
     fireproofing                  _ Labour supply                      _ Asset operation
   _ Refractory                    _ Training
                                                                     • Number of employees: 14
• Number of employees: 821      • Number of employees: 392

                                                                                                    2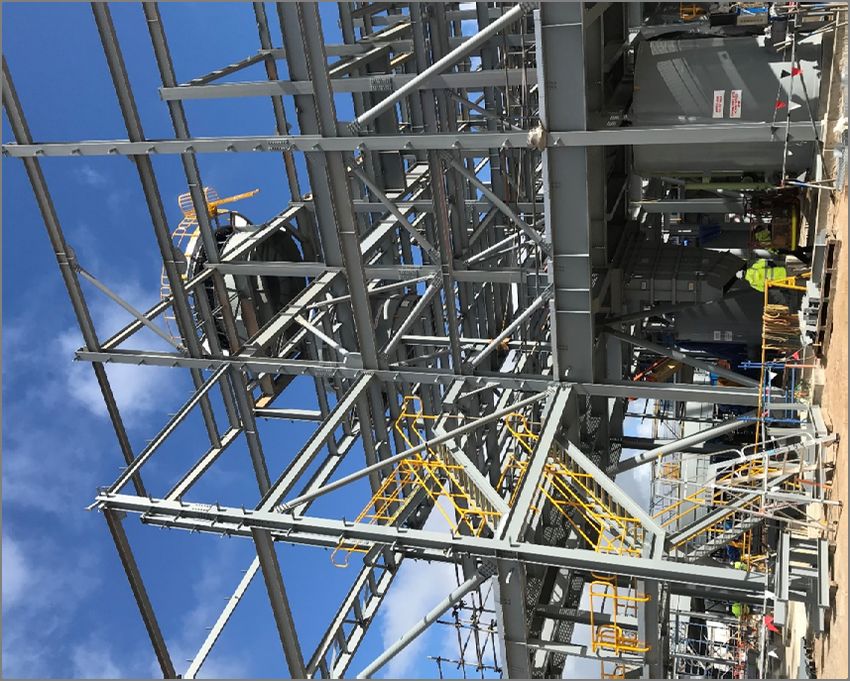
AusGroup at a glance
Founded       Our businesses   Our operations   Perfect Day

1989
                                                LTIFR 0.53
                                                TRIFR 2.67

Our markets

                                                          3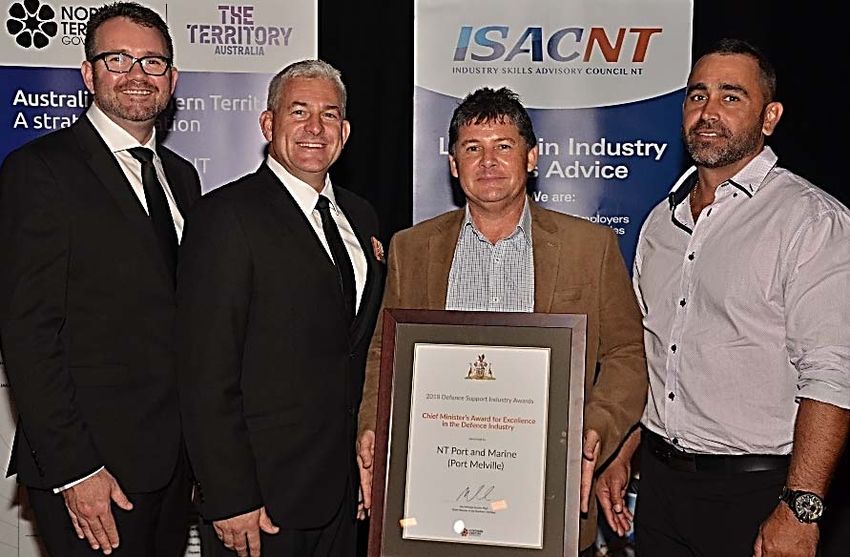
Key investment highlights
Outstanding track record with ability to deliver Chevron, Barrow Island
end-to end asset services
29 years’ experience in the Australian and
South East Asian markets
Capability to provide full end-to-end project delivery:
Planning, construction, hook-up, operations and
maintenance
Lean and flexible business model offering
integrated service delivery
Strong in-house capability that is scalable for growth
Self performing delivery model eliminating interface
management
Industry leading recruitment model with flexibility to
meet business requirements
Solid Australian presence with established customers
Blue chip long term contracts
Positioned to capture future works through strong client
relationships
Clear strategic vision for the future
Experienced core leadership and management team
Strategy set for growth
Visible pipeline of growth in a stabilised market.
4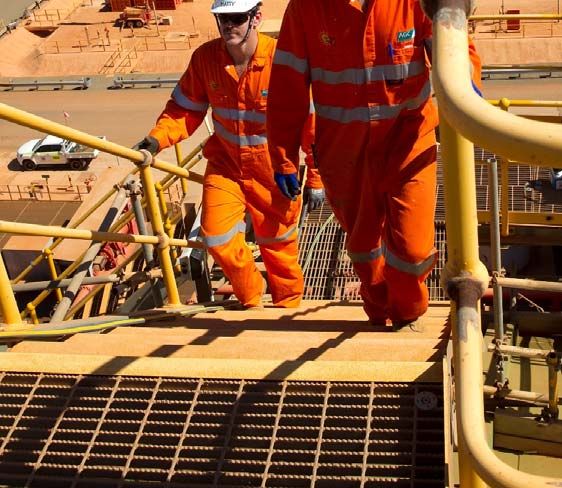
Chevron Australia Master Contract
5 Year Maintenance Agreement
with a 2 + 2 + 1 years extension
Performing works over 3 major
facilities – Gorgon (Barrow
Island)/Wheatstone and
Wheatstone offshore Platform
Key metrics – over 1 million
man-hours spent across all Chevron, Gorgon Project
sites without and LTI’s – Over
60 Ci’s generated in 2018
Currently in shutdown
preparation.
5
Chevron, Barrow Island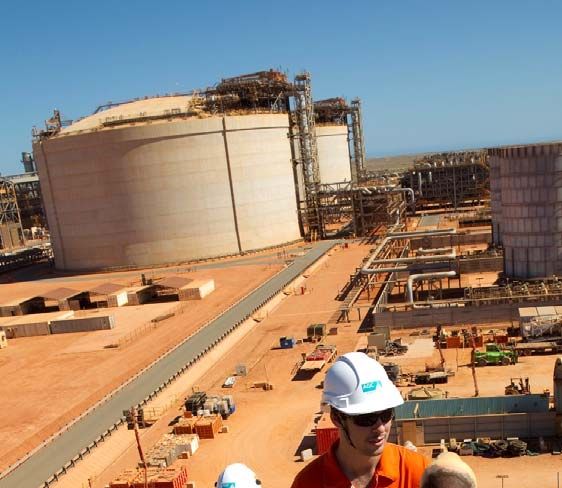
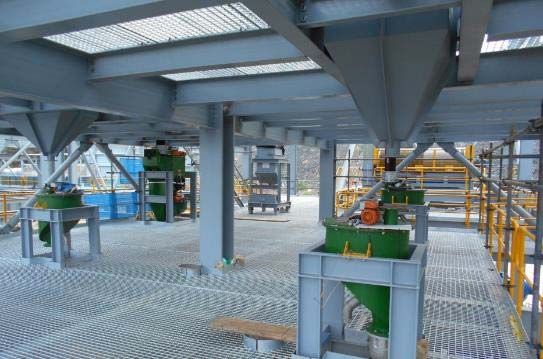
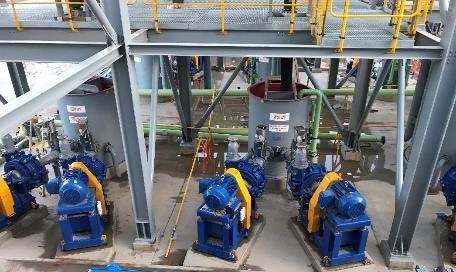
Talison Lithium CGP2 Expansion (MSP)
AUD$40M Structural, mechanical
and piping installation package
Located in Greenbushes, Western
Australia
2,000 tonnes of structural steel
and associated flooring and
cladding
70 tonnes of plate work Talison Lithium CGP2 Expansion
450 pieces of mechanical
equipment
CGP2 will significantly expand
production of lithium oxide
concentrates from Greenbushes,
in response to growing demand.
6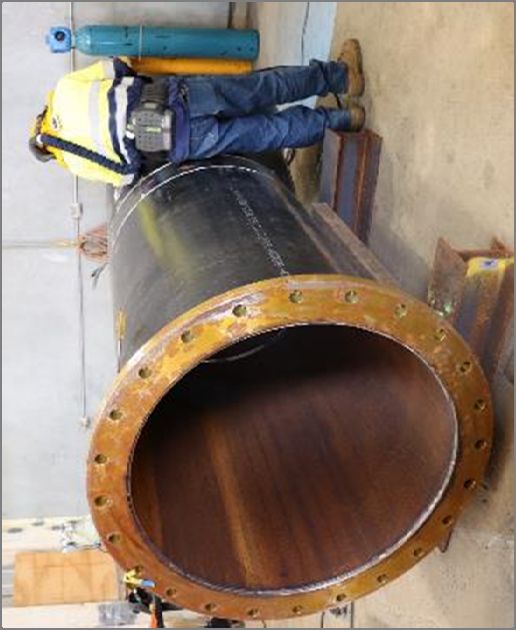
Tianqi Lithium Kwinana LHPP1 (MSP) AUD$9.7M contract for piping and insulation works on the Lithium Hydroxide Processing Plant Crystalliser builder in Kwinana Expected workforce 90 – 100 people Establishment of facilities and laydown area. Talison Lithium CGP2 Expansion Source: The West Australian, 11th Sep, 2- 3 October 2018 7
Australian Lithium Industry
“Kwinana is at the epicentre of a booming “Demand for the mineral [lithium] is
global lithium market opens up new tipped to grow by 18 per cent a year until
economic opportunities for the State.” 2026, and WA is in the box seat as the
largest producer in the world.”
8
Source: The West Australian, 11th Sep, 2- 3 October 2018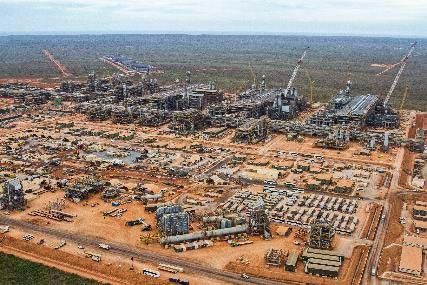
Kwinana facility Five large fabrication bays totalling 10,460m2, with over 30,0002 of uncovered area for laydown storage In-house capability to fabricate >30,000tpa Specialised fabrication work for Woodside, Chevron, Talison and Tianqi Workshop capabilities include: piping, structural steel and heavy plate fabrication, hydro testing, radiographic testing, sheetmetal & insulation workshops, welding school. 9
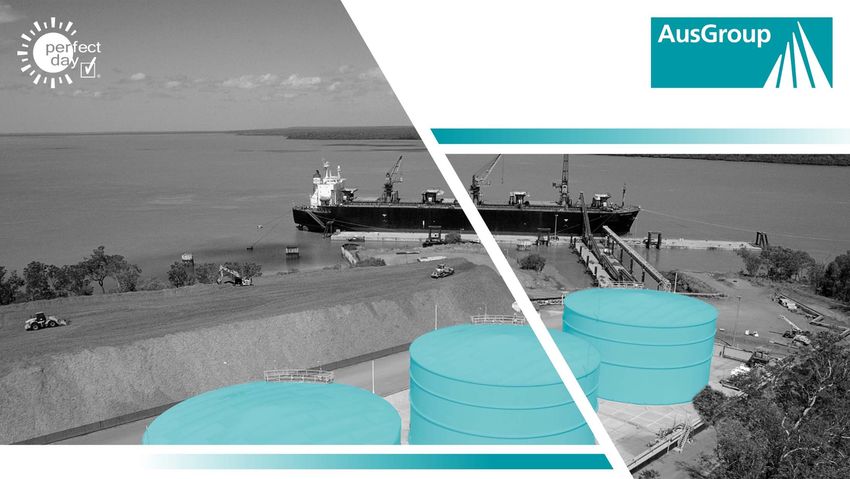
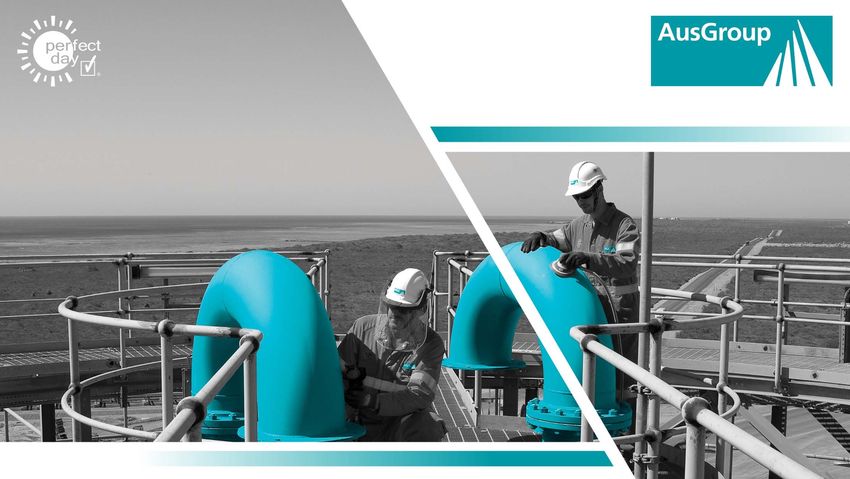
NT Port and Marine update
NT Port and Marine update
Woodchip shipment #14, successfully
loaded on 26 October 2018
Supply of fuel to Plantation
Management Partners, 200,000 litres
has been provided to date.
Awarded the Northern Territory Chief
Minister’s Award for Excellence in
Defence
ConocoPhillips confirmed formal
inspection NT Port and Marine Team
Training Program for local Tiwis –
Two graduates selected to become
maintenance trainees at the Port
MV Alizay 2 Vessel 11Market outlook
12Australian market overview
Long term outlook for
resources and energy
continues to improve
across Australia
Increasing opportunities in
lithium sector
Maintenance services
prospects remain positive
Renewed focus and
growth in iron ore sector.
Talison Lithium CGP2 Expansion (MSP) 13Market share of opportunities
Market share of (weighted) value $637 million Resources
• Iron ore plant fabrication packages
• Focus on shutdown maintenance
• Sustaining capital and fabrication
Port and Marine Industrial/Utilities packages
$39M (6%) $30M (5%)
• Continued expansion of Lithium
projects
Energy
• Steady release of oil & gas
maintenance scopes under framework
Energy agreements
$250M (39%) Resource
$318M (50%)
• Large and complex fabrication scopes
• Multi-year maintenance contracts
being tendered
Port and Marine
• Port and marine activities ramping up
• Oil and gas drilling activities
• Navy force refuelling
• Expansion of logging
Industrial/Utilities
• Increasing industrial processing
opportunities
• Diversified maintenance offerings
Source: AGC pipeline database, as at 31st October 14Financial Performance
Key performance indicators – FY2018 recap

2018                                                           567.0   • Highest revenue in five years.

2017                                       435.0

2016                                            470.8 • Average FY2015 to FY2017 revenue = A$444m.

2015                                      427.4

2014                   302.4
                               Does not include discontinued
       Revenue (A$M)           operations

                                                                                                          16
Financial summary – Q1 FY2019
Total Revenue Total EBITDA EBITDA margin Net Debt
A$86.6m A$6.2m 7.1% A$118.5m
• Revenue of A$86.6m – diversified revenue base providing a solid start to year,
with first lithium contracts now underway.
• EBITDA of A$6.2m – underlying strength in quality of earnings continuing on
from last financial year.
• EBITDA margins higher than in the comparative quarter of Q1 FY2018 as a
result of good performance from maintenance, fabrication and project sectors.
17
18Trading Performance – Q1 FY2019
Q1 2019 Q1 2019
Q1 2019
Q1 2019 Q1 2018 +/(-) % Energy & NT Port &
Total
Process Marine
AU$'000 AU$'000 AU$'000 AU$'000 AU$'000
Revenue 86,557 153,746 (43.7) 85,650 907 86,557
Gross profit 8,126 11,393 (28.7) 9,073 (947) 8,126
Gross margin 9.4% 7.4% 10.6% n.m. 9.4%
Other operating income / (loss) 1,479 546 170.9 1,113 366 1,479
Administration, marketing & other costs (5,332) (5,534) (3.7) (4,431) (901) (5,332)
EBIT 4,273 6,405 (33.3) 5,755 (1,482) 4,273
EBIT Margin 4.9% 4.2% 6.7% n.m. 4.9%
Net gain on debt conversion - 452 n.m. 0 0 0
Finance costs (2,675) (3,297) (18.9) (187) (2,488) (2,675)
Income and withholding tax (286) (354) (19.2) (286) 0 (286)
Discontinued operations - (82) n.m. 0 - 0
Net profit/(loss) for the period 1,312 3,124 -58.0 5,282 (3,970) 1,312
Net Profit Margin 1.5% 2.0% 6.2% n.m. 1.5%
EBITDA and impairments 6,150 8,852 (30.5) 6,995 (845) 6,150
EBITDA Margin 7.1% 5.8% 8.2% n.m. 7.1%
• Revenue lower than prior year due to completion of large major projects. Revenue base now diversified and gross margins
higher than comparative quarter by 27%.
• EBIT margins are consistent with prior periods demonstrating strength in the underlying operational earnings base.
• The ratio of EBIT to Finance costs was 1.6 : 1.0 (a comfortable servicing ability for FY2019).
18
• Net profit for the quarter of $1.3m – another profitable quarter following on the success of last financial year.Key performance indicators
1Q19 86.6 1Q19 6.2 1Q19 1.3
4Q18 126.6 4Q18 22.8 4Q18 2.7
3Q18 136.3 3Q18 9.2 3Q18 3.5
2Q18 150.2 2Q18 9.4 2Q18 4.1
1Q18 153.7 1Q18 8.9 1Q18 3.1
Revenue (A$M) EBITDA (A$M) Net Profit after Tax (A$M)
Does not include discontinued operations Does not include discontinued operations
• Revenue has reduced due to the completion of the large major projects completed in the last
year. Underlying performance from all sectors generating positive growth.
• A good start to the year with another quarter of positive EBITDA. Performance for maintenance
contracts particularly strong and supported by growth in the fabrication volumes.
• Net Profit after tax shows lower return than in previous comparative quarters however the
consistency in the earnings base sets up the year ahead.
• Two years of quarterly profits.
19Balance sheet
(A$ million) 30-Sep-18 30-Jun-18 Variance • Borrowings have stabilised in
23.2 37.8 (14.6)
the quarter with loan
Cash
repayments offsetting –ve
Receivables 102.8 93.4 9.4
Forex movements.
PPE 74.3 75.6 (1.3)
Intangible Assets 44.2 43.7 0.5 • Cash decreased by $14.6m
Other Assets 10.8 12.5 (1.7) due to timing delays in project
related receipts (received in
Total Assets 255.3 263.0 (7.7)
October 2018) .
Payables 82.0 84.8 (2.8)
Debt 122.4 120.9 1.5 • Continuing to strengthen
Other Liabilities 10.4 15.6 (5.2) Balance Sheet.
Total Liabilities 214.8 221.3 (6.5)
• Improved Net Assets by
Net Assets 40.5 41.7 (1.2) $17.2m since FY17 reflecting
Net Tangible Assets (3.7) (2.0) (1.7) continuing profitability in
business.
20Group net debt - deleveraging
AU$ millions
33.9 37.8
22.1 23.2
120.9 122.4
150.7
179.2
18.6 19.3
(101.7) (118.5)
27.1
A$73.8m reduction
35.2 (143.9) since FY2016
6.2
(192.3)
2016 2017 2018 Q1 2019
Non-Bank Debts Borrowings Cash Net
• Net debt reduces by $73.8m from FY16.
• Cash at bank balance decreased by $14.6m in quarter – timing delays on project receipts.
• Short term borrowings repaid and other repayments made since FY16 - $72.7m.
213MTN debt – Current Maturity November 2022
• Noteholders approved extended the maturity date by four years on revised terms
• Effective interest at 6.25% p.a.
MTN Interest Rate
8%
6%
4%
2%
0%
2019 2020 2021 2022
Effective interest rate Interest rate
• 30% principal redemption – expected to be paid by January 2019
22MTN debt – Current Maturity November 2022
Extension Conversion to equity at 4.2 cents
288 notes 14 notes redeemed
30% principal repaid 80.2 million shares to be issued
Outstanding principal after restructure = S$48.6m (at a maximum)
23Share Placement and Rights Issue
• Share Placement is contingent on:
1) Restructuring of the MTN Notes
2) The Share Placement providers subscribing for all of their rights
3) Ezion Holdings extending the term of its existing loan by five years
4) Ezion Holdings approving the Rights Issue and the Share Placement
• Share Placement - 1,050,000,000 shares to raise S$36.8m (at price of
S$0.035 per share). At a minimum, the Rights Issue (at price of S$0.035
per share) will result in an additional funds raised of S$4.9m.
• Total funds raised will be at least S$41.7m.
• Net proceeds will be used for partial redemption of the MTN Notes of
S$21m (30% redemption) and working capital ~ S$19m after costs.
24Extension of debt maturity provides stability
Total debt Sept 18 = $122.4m (pre-note
87.2 restructure, placement and rights issue)
51.2
75.4
AUD$m
48.6
35.2
11.8
Due FY19 Due FY20 Due FY21 Due FY22 Due FY23
MTN DBS Shareholders loan
25Extension of debt maturity provides stability
Total debt Sept 18
(after placement, rights issue and note restructure)
= $91.0m (~$31m reduction) 51.2
73.4
AUD$m
48.8
11.8 Financing breathing space
30.4
11.8
Due FY19 Due FY20 Due FY21 Due FY22 Due FY23
MTN DBS Shareholders loan
26Summary
• Strong safety record
• Highest revenue, EBITDA and NPAT for five years
• Solid pipeline of maintenance work in LNG and Resources
• A$60m of new contracts in the expanding lithium sector
27Disclaimer
AusGroup Limited (“AusGroup”) makes every effort to ensure that information contained in these pages
is accurate. However, the information on this website (including any links to other websites) has been
compiled for reference purposes only and may contain inaccurate, incomplete and outdated information.
You should seek and rely upon your own independent enquiries, assessment and advice in relation to
any information contained in this website.
To the fullest extent permissible pursuant to applicable law, AusGroup disclaim all warranties pertaining
to the information, express or implied, including, but not limited to, warranties of title and implied
warranties of merchantability and fitness for a particular purpose. AusGroup do not warrant that the
functions contained at this site will be uninterrupted or error free, that defects will be corrected, or that
this site or the server that makes it available are free of viruses or other harmful components.
To the maximum permitted by law, AusGroup will not be liable for any damages, losses or
compensation, (including but not limited to indirect, incidental, special or consequential damages or loss
of profits) howsoever arising out of any reliance on the information, use or access of, or any inability to
use or access, this website or any part of it, or any other site linked to this website. In no event shall our
total liability to you for all damages, losses, and causes of action exceed the amount paid by you, if any,
for accessing this site or any linked site.
AusGroup Limited is not responsible for, nor does it endorse, the content or reliability of the linked
websites. AusGroup cannot guarantee that these links will work all of the time and we have no control
over availability of the linked pages.
28You can also read