Israel Natural Gas Demand Forecast 2017-2040 - July 2nd, 2017 - Delek Group
←
→
Page content transcription
If your browser does not render page correctly, please read the page content below
Israel Natural Gas
Demand Forecast
2017-2040

July 2nd, 2017
Disclaimer

This report, the analyses and conclusions are based on information that has been generated or reviewed by BDO
Ziv Haft Consulting & Management Ltd. (hereinafter: "BDO"). The analysis and conclusions contained in this report
are based on various assumptions, which are subject to uncertainty. Future results or values could be different
from the forecasts and analyses contained here.

BDO makes no representations or warranty, express or implied, as to the accuracy or completeness of the
underlying assumptions, estimates, analyses or other information contained in this report, and nothing contained
herein is or shall be relied upon as a promise or a representation, whether as to the past, the present or the future.

The report is based on public information. The study is not a due diligence or a valuation report and the procedures
necessary for conducting due diligence and/or valuation, such as an in depth examination of the Company’s
undertakings and agreements, were not performed in the process of carrying out this study.

The forecasts included in the report are based on BDO’s energy forecast model. The usage rights in the underlying
model are provided on a non-exclusive basis. BDO provides energy sector forecasting services to various third
parties at its discretion, and usage in this report granted is granted without any cause or claim of independence or
conflict. BDO provides audit and consulting services to Tamar and Leviathan project shareholder, including but
not limited to Delek Group, Delek Drilling and Tamar Petroleum.

Prepared by Chen Herzog, Norden Shalabna and Guy Maor

                                                          2
Preface
The State of Israel is marking the 13th year since the beginning of domestic natural gas
production. In the ensuing years, Israel’s energy sector has taken merely the first steps in the
adaptation to the new era of energy self-sufficiency. Israel's oil based power units were
converted from oil to gas, and 30 of the largest industrial plants were connected to the gas
pipeline. In addition, first steps have been taken in reducing coal use. However, during this
entire period Israel has faced supply-side constraints that prevented broader gas utilization.
According to our analysis, there remains a significant potential for continued transformation of
the energy sector. Israel is currently ranked fourth in the OECD in terms of gas and oil reserves
per capita. This creates a comparative advantage for the development of advanced, capital
and energy intensive, as well as environmentally friendly industries. In addition, compared to
other OECD countries Israel should benefit from an economic advantage for increased use of
electric vehicles, gas based transportation and other energy intensive applications.
Our assessment shows that the demand for natural gas and electricity in Israel is still far from
the saturation point. The climatic conditions in Israel, which is the warmest of all OECD
countries, along with the gaps in per capita GDP combined with the low capital intensity level
of the industrial and service sectors in Israel compared to other developed countries, lead to
the conclusion that a simple comparison with other OECD countries is not relevant.
According to BDO's forecast, the demand for natural gas in Israel is expected to double in less
than a decade and reach 20.5 BCM in 2025. The main growth drivers are the continued
structural change of the energy sector, further reduction in coal based power generation, and
a continued 3.5% annual growth rate in demand for electricity.
BDO's electricity and natural gas demand forecast is based on an econometric model using
the bottom-up approach. The forecast is based on a proprietary model developed by BDO
over the past three years. It also relies on knowledge and experience that I acquired during
my joint work with Dr. Yacov Sheinin as vice president at Economic Models Ltd. The model is
based on the Long Range Energy Planning (LEAP) system—a leading international economic
model used for simulation in the energy sector. The macro economic forecasts are based on
the Macro-Analytics model for the Israeli economy.
The undersigned has over 20 years of experience in conducting forecasts and assessing
trends in the Israeli energy sector and is a member of BDO's global forum of energy experts.
This professional experience includes demand forecast and market analysis for Israel Electric
Corp.,Yam Tethys, Tamar and Leviathan partners, independent power producers,
cogeneration producers and government authorities.
According to BDO estimates the energy sector in Israel (expressed in value added terms) will
more than double by 2025 and reach NIS 57 billion. This is equivalent to the entire value added
of the Israeli high-tech sector in 2017. The trend will lead to a real structural change and
comprises significant advantages for the Israeli economy: stimulating economic growth;
increasing government tax receipts; contributing to the environment; increasing energy
independence and realizing the geopolitical benefits of increased trade with neighboring
countries.

Chen Herzog
Chief Economist, Partner
BDO Consulting Group

                                               3
Table of Contents
1.   Executive Summary ............................................................................................................. 5
     Introduction                                                                ................................................... 6
     Methodology                                                                 ................................................... 9
     Gas Demand Forecast Summary                                                 ................................................. 11
     Israel Gas Supply and Demand Balance                                        ................................................. 13
     Electricity Demand Forecast Summary                                         ................................................. 16
     Coal Reduction                                                              ................................................. 20

2.   Electricity Demand in International Perspective ............................................................ 22
     Overview                                                   ................................................. 23
     Influence of Standard of Living                            ................................................. 26
     Irrelevance of the Temporary Demand Effect in 2013-14 ................................................. 29
     The Impact of Weather Conditions                           ................................................. 30
     Electricity Prices Impact on Demand                        ................................................. 34

3.   Electricity Demand Forecast ............................................................................................. 36
     Methodology                                                             ................................................. 37
     Demographic growth                                                      ................................................. 38
     Residential Demand for Electricity                                      ................................................. 39
     Industrial Sector Electricity Demand                                    ................................................. 41
     Railway Electrification                                                 ................................................. 43
     Electricity Demand in the Commercial and Public Sectors ................................................. 44
     Electricity Use for Water Pumping and Desalination                      ................................................. 45
     The Impact of Climate Change - Global Warming                           ................................................. 46
     Electric Vehicles                                                       ................................................. 47
     Palestinian Demand                                                      ................................................. 51

4.   Electricity Supply Forecast ............................................................................................... 53
     Background                                                                ................................................. 54
     Private Producers                                                         ................................................. 56
     Electricity Tariffs                                                       ................................................. 58
     Future Market Reform                                                      ................................................. 61
     Electricity Generation Capacity Forecast                                  ................................................. 63
     Independent Power Producers (IPPs)                                        ................................................. 65
     Cogeneration Producers                                                    ................................................. 66
     Renewable Energy                                                          ................................................. 68
     Coal Reduction                                                            ................................................. 71

5.   Gas Demand Forecast ....................................................................................................... 74
     Overview                                                                  ................................................. 75
     Gas Demand Forecast Summary                                               ................................................. 77
     Gas Demand Growth by 2020                                                 ................................................. 79
     Chemical Industry Gas Demand                                              ................................................. 79
     Gas Demand Forecast Table                                                 ................................................. 82
     Electricity Production Forecast Table                                     ................................................. 83

6.   Regional Gas Supply Dynamics ....................................................................................... 84
     Israel Gas Reserves                                                ................................................. 85
     Israel Gas Supply and Demand Dynamics                              ................................................. 88
     Regional Export Potential                                          ................................................. 91
     Export Potential to Jordan                                         ................................................. 92
     Export Potential to Egypt                                          ................................................. 93

                                                             4
1. Executive Summary
1. Executive Summary

                    5
Introduction
Thirteen years after natural gas started flowing into the Israeli market, the economy is still only
in the initial stages of the structural change to the energy sector. Until 2004, Israel was totally
dependent on imported oil and coal for its entire energy supply. The development of the Yam
Tethys and Tamar reservoirs, in 2004 and 2013 respectively, has resulted merely in the
conversion of Israel's oil based power units to gas. The first step of coal reduction in the
electricity sector took place in 2016. Further gas utilization in the Israeli economy was held
back due to supply side constraints. These constraints included the termination of Egyptian
gas exports to Israel in 2012, the depletion of the Yam Tethys reservoir, hourly capacity
limitations of Tamar, as well as the delay in the development of Leviathan until the resolving
of regulatory issues in 2016.

                    Israel Natural Gas Consumption by Gas Supplier, 2005-2016

       10
        9           Yam Tethys     Egypt     Tamar    LNG
        8
        7
                                     CAGR
        6                            17.5%
 BCM

        5
        4                                                            Gas
        3                                                          shortage
        2
        1
        0
             2005    2006   2007    2008     2009    2010   2011    2012      2013   2014   2015   2016

Source: Natural Gas Authority and BDO analysis

By 2020, with Leviathan's entry into the market, Israel's standing will change. For the first time,
Israel will become a significant gas exporter, as it will have more than adequate gas resources
to meet local consumption. This will enable the Israeli economy to fully utilize the economic
and environmental benefits of domestically produced natural gas.

The availability of sufficient local gas resources will enable Israel to transition into the second
phase of the structural change of its energy market. According to our forecast, the share of
natural gas in Israel's electricity generation fuel mix will increase from 60% today, to 73% in
2020 and 82% in 2025. The Israeli Ministry of Energy , with the support of the Environmental
Protection and Health Ministries, is already committed to the reduction of coal usage in

                                                      6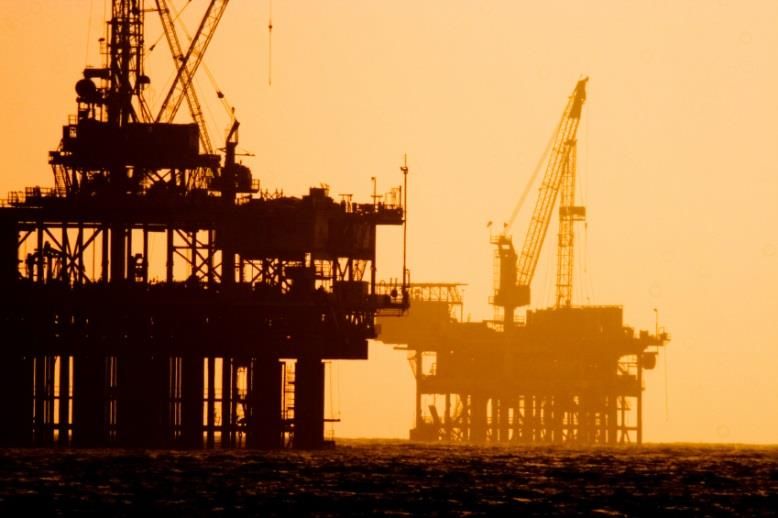
conjunction with the increased availability of gas. In November 2016, the Minister of Energy
publicly declared a target to reach over 80% of the power generation fueled by gas.
Accordingly, we believe that further coal reduction is highly likely due to the economic benefits
to the economy of using local gas instead of imported coal. Additionally, coal reduction is the
most cost-effective means for Israel to fulfill its COP21 obligations for GHG emission
reductions.

Furthermore, the increased availability of natural gas is expected to lead to structural changes
in Israel's energy sources for transportation. Today, diesel and gasoline constitute the only
fuels used for transportation in Israel. Israel Railways, the state owned national railway
system, has begun a process of conversion of its entire network from diesel to electric trains.
A new electric light rail system in Tel Aviv is also under construction, with the first line (the red
line) planned to begin operation in 2021. Additionally, the Israeli government has adopted a
policy aimed to promote CNG and electric vehicles. The government is providing incentives
and subsidies to build CNG based fueling stations and to adopt CNG based vehicles, mainly
in urban truck and bus fleets. For that purpose, the government allocated NIS 65 million (19
million USD) in the recent 2017-2018 budget in the form of direct grants to CNG stations in
order to create a nation-wide spread of stations and to target massive commercial flees in
particular.

Electric vehicles also enjoy significant tax incentives. The adoption in July 2016 of a new
standard that will allow charging of electric vehicles using standard power outlets, rather than
dedicated charging stations, has removed a significant barrier that prevented the adoption of
electric and plug-in vehicles in Israel.

There are several major development plans for cogeneration plants currently underway in the
industrial sector. Many of these projects were postponed in recent years due to a shortage of
gas and the inability to complete financial closure without a long-term firm gas contract.
Leviathan entrance to the market will thus facilitate continued expansion of the Israeli industry,
which without gas suffers from deficiency due to the requirement to use oil while its
competitors abroad use gas.

The Israeli government is also taking steps to expand the gas distribution network, which will
enable small and medium size industrial and commercial customers to shift to gas. In
September 2016, the government declared its intension to provide 300 million NIS (85 Million
USD) in funds to assist the private sector in financing the gas transmission network.

                                                 7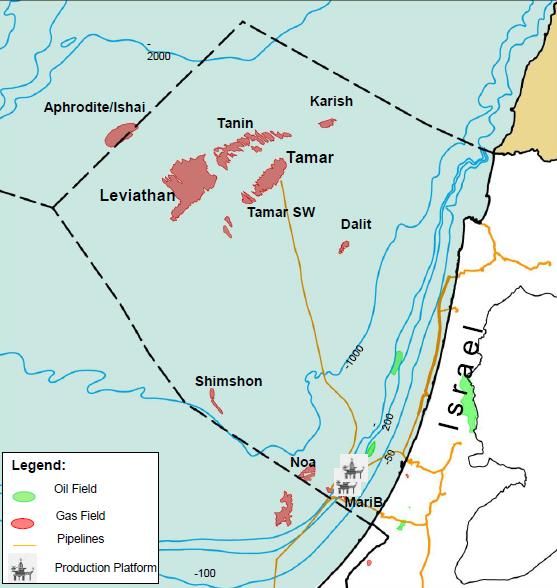
Chemical industries using natural gas as feedstock are also expected to emerge in conjunction
with Leviathan’s entry to the market. The first such plant was planned to be an ammonia
production facility in southern Israel, which we believe will eventually materialize despite
current uncertainty. In addition to the ammonia plant, there are plans for the development of
methane based chemical industries including production of methanol, Dimethyl Oxide (DME)
and urea.

The developments cited in the electricity, industrial, transportation and chemicals sectors
clearly show that the increase in gas supply will enable the Israeli energy market to enter a
new era in terms of its energy consumption. Even with the expected structural changes,
electricity demand will remain the key driver for increased gas consumption. Nearly all the
additional electricity demand in the coming years will be met by gas (except for a relatively
small share of renewables). Currently only 60% of electricity is generated by gas. Hence, in
the coming years every 10% increase in electricity demand will result in a 17% increase in the
demand for gas.

                                              8
Methodology
The report is based on BDO’s model of the Israeli energy sector which includes a dynamic
economic forecast and simulation of the Israel electricity and natural gas markets. The
demand forecast is based on a proprietary multi-factor model, including an electricity demand
model, a supply model, and an economic dispatch model based on a forecasted load duration
curve. In addition to Tamar Petroleum, BDO's energy sector consulting clients, who receive
services based on BDO's energy sector forecasting model include government authorities,
electricity producers, co-generation projects, gas distribution companies and industrial clients.

The report and forecasts are based on our team’s broad experience in analysis of market
demand and trends in the Israeli economy, and in the energy sector. BDO’s team of energy
experts is led by Chen Herzog, partner and chief economist at BDO Israel, and a member of
BDO international’s global energy experts forum. The team has extensive experience in
energy sector forecasting services for the past 20 years, and has provided market review and
forecast services to most large scale financing transactions in the energy sector for the Israel
Electric Corp. (IEC), as well as the Delek & Avner Yam Tethys bond issue in 2005, the
Leviathan-Woodside negotiations in 2012/3, the Tamar bond issue in 2014 and the Leviathan
financing in 2017.

The demand model was developed by BDO’s economic experts using the LEAP - Long-range
Energy Alternatives Planning System technology. LEAP is being widely used worldwide by
government agencies, consulting companies, energy utilities and academics.

The charts below illustrate our methodology. Our demand model includes several main
demand components:

   1. Residential demand for electricity based on demand models for main appliances,
       factoring penetration rates, usage intensity and energy efficiency.
   2. Demand by the government sectors, commerce and services, based on the Israel
       macro-economic model.
   3. Demand by the industry, based on the macro-economic model, factoring in the relative
       energy intensity of various industries.
   4. Demand for desalination and water pumping – based on our macroeconomic and
       demand for water forecasts.
   5. Palestinian demand, including demand in West Bank and Gaza

                                                 9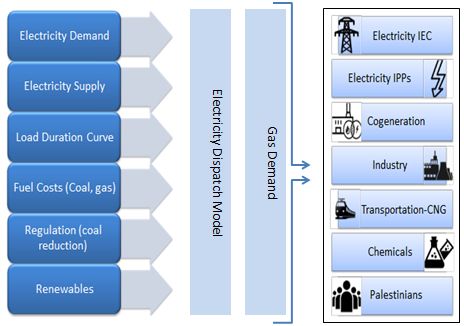
The electricity demand model is based on a bottom-up approach, which includes the effect of
energy efficiency improvement, along with the effect of increased penetration rates and usage
of household appliance and energy intensity in the various sectors.

                      BDO Electricity Demand Model Methodology

                     BDO Natural Gas Demand Model Methodology

                                             10
Gas Demand Forecast Summary
In the past decade, gas demand in Israel increased at an average annual rate of 17.5% per
year, reaching 9.7 BCM in 2016. Gas demand for 2017 is estimated at 10.5 BCM. We forecast
local gas demand to increase by an average annual rate of 8% over the next decade, reaching
14.3 BCM by 2020 and 20.5 BCM by 2025. It should be noted that our gas demand forecast
is based on potential demand, and does not account for supply side limitations. However, as
Leviathan enters the market there should be adequate supply for the entire local demand. In
the shorter term, in case of limited gas resources, local gas supply shortage may be
supplemented by imported LNG or diesel. Electricity demand in Israel is highly sensitive to
weather conditions. Hence it is important to note that our forecast is conducted based on
average expected weather conditions. In any particular year, weather conditions may of
course differ from the average, yielding possible variations (in both directions) in gas demand.
Gas Demand Forecast 2016-2025
In BCM
20
Electricity
Cogen & Industry
CNG & Chemical
15
Further Coal Reduction
10
5
0
2016 2017 2018 2019 2020 2021 2022 2023 2024 2025
Source: BDO Forecast
Based on our estimates, Israel electricity demand will increase by about 3.8% per year in the
next decade, which translates to about an 7% annual increase in gas demand for electricity
generation, with all other factors being constant. Total gas demand growth expected to reach
9.5% per year through 2025. This growth mainly driven by the government's recent decision
to shut down 1,440MW of coal units and increased usage of gas for industrial and
transportation purposes.
11Demand Forecast Summary
Demand by type of Gas Consumer, in BCM
Out of
CNG and Further gas which,
Cogen & Total
Year Chemical due to coal Palestinian
Electricity Industry Demand
Industry reduction Self -
Generation
2015 5.8 2.6 0 8.4
2016 6.7 3.0 0 9.7
2017 6.8 3.3 0 0.3 10.4
2018 6.9 3.9 0.1 0.3 11.2
2019 7.0 4.0 0.2 0.3 11.5
2020 7.1 5.1 0.5 1.6 14.3
2021 7.5 5.2 0.9 2.3 15.9 0.2
2022 8.0 5.4 1.1 3.5 18.0 0.6
2023 8.3 5.4 1.4 3.6 18.7 0.9
2024 8.8 5.5 1.6 3.6 19.5 1.2
2025 9.3 5.7 1.9 3.6 20.5 1.7
2026 9.8 5.8 2.1 3.6 21.3 2.1
2027 10.5 5.9 2.3 3.6 22.3 2.3
2028 11.3 6.0 2.5 3.6 23.4 2.5
2029 11.9 6.1 2.6 3.6 24.2 2.6
2030 12.5 6.2 2.7 3.6 25.0 2.8
2031 13.3 6.3 2.8 3.6 26.0 3.1
2032 14.0 6.4 2.9 3.6 26.9 3.3
2033 14.7 6.5 3.0 3.6 27.8 3.6
2034 15.5 6.6 3.3 3.6 29.0 3.9
2035 16.2 6.6 3.5 3.6 29.9 4.2
2036 17.0 6.7 3.6 3.6 30.9 4.5
2037 18.1 6.8 3.7 3.6 32.2 4.9
2038 18.9 6.9 3.8 3.6 33.2 5.3
2039 19.8 7.0 3.9 3.6 34.3 5.7
2040 20.6 7.1 4.0 3.6 35.3 6.2
*including Palestinians
Source: BDO Forecast
12Israel Gas Supply and Demand Balance
Tamar, which began commercial production in 2013, is currently the only operational gas field
in Israel. Hence Tamar is still the sole source of gas supply to the domestic market, with any
shortage during peak demand or infrastructure limitations being met by imported LNG. The
later accounts for only marginal quantities.
In 2020 with the expected entry of Leviathan and later-on Karish/Tanin to the local market, the
gas market will enter a new phase with multiple suppliers. The entry of new suppliers will not
only lift limitations that currently exist, but also lead to increasing demand in the local market
and the expanding of the use of gas in various sectors of the economy (see chapter 5 below).
Our gas demand analysis shows that Tamar, Leviathan, and Karish/Tanin fields are expected
to face significant demand from local and as well as regional markets. An analysis of the
projected supply and demand for gas in the Israeli market in 2025 (taking into account existing
export agreements) shows that the pace of development of the reservoirs in the coming years
is in line with the expected increase in demand.
Israel Gas Supply-Demand Balance 2025
By Source and Target, in BCM
Gas Source Target Market
Israel Jordan Egypt Total
Tamar 9.5 0.15 1.0 10.7
Leviathan 7.0 3.5 0.7 11.2
Karish/Tanin 3.0 0.0 0.0 3.0
LNG import 1.0 - - 1.0
Total 20.5 3.7 1.7 25.9
Source: BDO forecast
One should note that advanced commercial contacts are underway for a possible marine
pipeline to Turkey and/or export to two LNG facilities in Egypt, also via pipeline. If realized,
these projects will be undertaken in parallel with an expansion of the current producing fields
in Israel, and therefore should not have a substantial impact on the domestic supply and
demand balance.
We assume that any further large-scale gas discoveries will only be developed unless there
is an assured export potential market (such as an export agreement with Egyptian LNG
facilities' owners and/or a pipeline to Turkey), or when local demand exceeds supply.
Financing natural gas projects in Israel is at present based on the project finance model, which
inherently balances the growth in local demand to the development of the reservoirs. This
13guarantees that the building and financing of new gas reservoirs is correlated with the demand
in the relevant markets.
The expected market share of the various reservoirs in the local market is a result of the
structure of the supply agreements, the regulatory conditions and the export quotas that were
allocated to the reservoirs by the government in June 2013. Export quotas were determined
according to the size of the reservoir in order to encourage the development of smaller fields.
Tamar's current infrastructures are 90% designated for the domestic market with the
remaining 10% for export to Jordan’s Arab Potash Company (APC) and to the Egyptian
domestic market. The export to these Jordanian plants had commenced in 2016 and currently
stands at about 0.15 BCM per year. Tamar may be expanded in the future in the event of an
export agreement to the UFG LNG facility in Egypt.
The Leviathan field’s ultimate primary market will mainly be neighboring countries, as part of
the effort to encourage multiple suppliers to the domestic market. Nevertheless, the
development of Phase-1 will be modular, and will consist of two stages, with a larger
percentage (65%) of the first stage (1A) earmarked for the domestic market and the remainder
(35%) for export to Jordan and Egypt via Jordan using existing infrastructures. Leviathan’s
second stage (1B), is designated for export to Turkey, LNG facilities in Egypt or to Europe.
Analysis of the existing discoveries and potential regional demand shows that the entire local
demand can be met through existing fields at least until 2040. The following table illustrates a
possible scenario for the allocation of the demand among the various suppliers.
14Domestic* Gas Supply Forecast By Source
In BCM
Supplier Tamar
Market
Total Local Tamar Leviathan Karish/Tanin LNG Share of
Demand Local Local import/ local
Market Market others demand
2013 6.9 5.5 0 0 0.9+0.5** 80%
2014 7.6 7.6 0 0 0.1 100%
2015 8.4 8.3 0 0 0.1 99%
2016 9.7 9.4 0 0 0.3 97%
2017 10.5 9.8 0 0 0.7 94%
2018 11.2 10.1 0 0 1.1 90%
2019 11.5 10.1 0 0 1.4 88%
2020 14.3 9.5 4.8 0 0 66%
2021 15.9 9.5 3.8 2.6 0 60%
2022 18.0 9.5 5.5 3.0 0 53%
2023 18.8 9.5 6.3 3.0 0 51%
2024 19.5 9.5 7.0 3.0 0 49%
2025 20.5 9.5 7.0 3.0 1.0 46%
2026 21.4 9.5 7.1 3.0 1.8 44%
2027 22.3 9.5 7.1 3.0 2.7 43%
2028 23.3 9.5 7.2 3.0 3.6 41%
2029 24.2 9.5 7.2 3.0 4.5 39%
2030 25.0 9.5 7.3 3.0 5.2 38%
2031 26.0 9.5 7.3 3.0 6.2 37%
2032 26.9 9.5 7.3 3.0 7.1 35%
2033 27.8 9.5 7.3 3.0 8.0 34%
2034 29.0 9.5 7.3 3.0 9.2 33%
2035 30.0 9.5 7.3 3.0 10.2 32%
2036 31.0 9.5 7.3 3.0 11.2 31%
2037 32.1 9.5 7.3 3.0 12.3 30%
2038 33.2 9.5 7.3 3.0 13.4 29%
2039 34.3 9.5 7.3 3.0 14.5 28%
2040 35.3 9.5 7.3 3.0 15.5 27%
Total 594.6 260.3 143.3 59.6 131.5 44%
*Israel and Palestinians
**In 2013, Yam Tethys supplied 0.9 BCM, with additional 0.5 BCM LNG import.
BDO Scenario for Domestic Gas Supply Forecast by Source in BCM
15Electricity Demand Forecast Summary
Electricity demand for Israel is experiencing high growth rates, as the electricity demand level
is still not on par with comparable high-income regions with similar weather conditions. In the
past twenty years, electricity demand in Israel rose by an average annual rate of 4%. This
represents an average annual increase in per capita electricity consumption of 2.2%.
Israel’s relatively low level of electricity consumption is a result of a standard of living that is
30% lower than other comparable developed countries. In line with this, we expect that in the
coming years as the standard of living rises, it will be accompanied by an increase in the
consumption of electricity and a reduction in the gap between Israel and other developed warm
weather regions with high-income levels.
Income Effect on Electricity Demand - International Comparison
Electricity consumption per capita relative to GDP per capita globally (in blue)
compared to Israel’s Electricity and GDP growth forecast (in red)
25,000
22,500 R² = 0.806
20,000
Bahrain
17,500
Kwh per Capita
Finland Canada Qatar
15,000 Kuwait
Sweden
United States
12,500
UAE
Korea, Rep.
10,000 Brunei
Australia
Saudi Arabia OECD New Zealand
AustriaSingapore
Japan Belgium Switzerland
7,500 France
GermanyNetherlands
China
Spain Italy UK Ireland Denmark
5,000 Greece
2,500 Israel At Israel At
2016 2040
0
0 10,000 20,000 30,000 40,000 50,000 60,000 70,000 80,000 90,000 100,000
GDP per Capita
Source: World Bank data, OECD, CBS and BDO analysis
In many economic analyses, OECD countries are used as a benchmark to evaluate the long-
term potential of the Israeli economy. In the case of electricity consumption, the unique climatic
and economic conditions in Israel, as opposed to other OECD countries lead to an over
16simplified comparison of electricity consumption between Israel and the other member states
and is therefore not relevant.
Israel is the warmest country in the OECD. The heat index in Israel, in terms of cooling degree-
days (CDD beyond 22 degrees centigrade1), is more than four times higher than the OECD
average. In fact, there is no other OECD country that is characterized by such a high heat
index as Israel.
Hence, the potential level of electricity consumption in Israel cannot be based on a direct
comparison with OECD countries, and should rather be based on comparison with other warm
regions.
A comparative study of per capita electricity consumption, which takes into account the
climatic conditions in warm regions and countries, shows that per capita consumption in Israel
is 50% lower than the trend line of countries with a warm climate.
Electricity Consumption relative to Heat Index International Comparison,
kWh per capita vs. heat index (CDD22)
20,000
Louisiana
Alabama
18,000 Kuwait
Mississippi South Carolina
16,000 Arkansas UAE (Dubai)
Oklahoma
kWh per Capita
Tennessee
14,000 Kansas Perth Qatar
Texas
Georgia
12,000 Brisbane
Florida
10,000 Adelaide Sydney
Melbourne Israel:2040
8,000
Israel:2016
6,000
0 500 1,000 1,500 2,000 2,500 3,000
CDD 22
Source: World Bank data, BDO analysis
The high growth rate in Israel’s electricity demand is a result of a combination of multiple long-
term characteristics of the Israeli economy: high population growth rate, relatively fast
1
"Cooling degree days 22", or "CDD 22", are a measure of how much (in degrees), and for how long (in days),
outside air temperature was higher than 22 degrees centigrade.
17economic growth, and hot weather conditions. As Israel’s economy continues to grow, both
penetration rate and usage intensity of household electric appliances will continue to increase,
contributing to increased electricity demand.
BDO’s forecast for electricity demand is based on a long-term bottom-up disaggregated
demand model. The model is integrated with the Macro Analytics macroeconomic model of
the Israeli economy.
The demand for electricity in the economic sectors is dependent on several economic
variables. These include income growth, penetration of electrical appliances, the price of
electricity, demographic variables (i.e. population composition, growth rate, household size
etc.) climate conditions as well as efficiency and energy intensity in the various sectors.
The major factors likely to impact growth are an increase in disposable income, an increase
in real wage, growth in the use of electrical appliances (primarily air conditioners for heating
and cooling), and the increased penetration and usage of home appliances. The effect of
energy efficient lighting and appliances as well as energy intensity of the industry are also
factors that have been taken into account.
We predict Israel demand for electricity will grow at an average rate of 3.5% per annum,
reaching 131 billion kWh by 2040. This growth rate represents about a 1.7% annual increase
in electricity consumption per capita. With the additional Palestinian market total demand is
expected to reach 161 billion kWh in 2040.
The demand growth is mainly due to an expected increase in the standard of living, increase
in air-conditioner penetration and usage, increased water desalination, electrification of the
Israeli railway system and increased Palestinian demand.
18Electricity Demand Forecast Summary
In bil. kWh per year*
CAGR
2015 2020 2025 2030 2035 2040
2015-2040
Residential 17.6 20.6 24.9 30.7 36.8 42.7 3.6%
Commercial &
17.6 20.7 25.0 30.4 36.4 42.9 3.6%
Public
Industry 14.3 16.4 18.6 21.3 24.0 26.7 2.5%
Agriculture 1.7 1.9 2.1 2.3 2.7 3.0 2.3%
Water &
4.0 5.1 6.4 7.7 9.0 10.2 3.8%
Desalination
Rail & electric
0.7 1.9 3.6 4.6 5.6 -
vehicles
Israel Total 55.2 65.4 79.0 96.1 113.5 131.1 3.5%
Palestinians 5.2 6.7 8.9 13.4 20.1 30.2 7.3%
Total Israel &
60.4 72.1 87.9 109.4 133.6 161.3 4.0%
Palestinians
Israel mWh Per
6.5 7.0 7.7 8.6 9.3 9.9 1.7%
Capita
Palestinians
1.1 1.3 1.5 1.9 2.6 3.4 4.6%
mWh per Capita
*Demand excludes losses
Source: BDO forecast
Electricity Demand Forecast Summary
Average Annual Growth Rates
2015-2020 2020-2025 2025-2030 2030-2035 2035-2040
Residential 3.2% 3.9% 4.2% 3.7% 3.0%
Commercial & 3.3% 3.8% 3.9% 3.7% 3.3%
Public
Industry 2.8% 2.6% 2.7% 2.4% 2.1%
Agriculture 2.0% 2.1% 2.4% 2.6% 2.6%
Water & Desal. 4.7% 4.9% 3.9% 3.0% 2.5%
Rail 16.8% 7.0% 4.6% 4.0%
Electrification
Electric Car 19.4% 19.0% 5.6% 3.5%
Israel Total 3.5% 3.8% 4.0% 3.4% 2.9%
Palestinian 5.2% 5.8% 8.5% 8.5% 8.5%
Total Including 3.6% 4.0% 4.5% 4.1% 3.8%
Palestinians
Israel Per Capita 1.6% 1.9% 2.1% 1.6% 1.2%
Palestinians per 3.2% 5.8% 5.8% 5.8% 4.6%
Capita
Source: BDO forecast
19Coal Reduction
Israel’s current electricity capacity includes 4,840MW of coal units, 11,800MW of gas based
units and 920MW of renewable solar based energy. In 2016, gas based units constituted 67%
of the Israeli generation capacity (70% accounting for the renewable units’ reduced availability)
but generated only 62% of Israel’s electricity production.
Israel’s coal units were planned and built in the 1980’s and 1990’s, long before the discovery
of Israel’s gas reservoirs. At that time, coal usage for baseload production provided an
economical viable alternative to fuel oil.
The availability of local gas, along with current environmental policy and regulation, call for a
shift in Israel’s electricity energy fuel mix. From the point of view of the national economy,
natural gas is a cheaper alternative, generates less pollution (SOX and NOX) and reduces
GHG emissions, thus allowing Israel to fulfill its international commitments under the COP21
framework. Hence, from an economic and environmental point of view, the optimal operational
regime for Israel’s electricity sector is to shutdown coal production and shift to domestic and
more environmentally friendly gas. We believe that lack of adequate gas supply is the main
constraining factor that currently prevents further coal reduction.
In December 2015, the Ministry of Energy directed the utility to reduce coal usage by 15% in
order to reduce emissions, increasing generation by gas accordingly. Later on, the coal
reduction requirement was increased to 19% from 2017 onwards. In August 2016, after the
regulatory uncertainty that delayed Leviathan’s development was resolved, the ministry
decided to shut down 4 coal units (Rabin A) with a total capacity of 1,440MW, comprising 30%
of Israel’s coal production capacity, no later than June 2022. It was further decided that private
power producers will build the replacement power supply. Our forecast is based on the
assumption that the next stage of coal reduction will take place after Leviathan's entry into the
market in 2020, when adequate gas resources will be available.
As Israel’s gas supply will further increase after Karish/Tanin begin production, we believe that
the Israeli government will continue its policy of reducing coal usage and instruct the IEC to
further reduce the utilization of its coal units. In the longer term, there is strong economic and
environmental logic to completely shutting down the coal units, and maintaining them as
strategic backup units. However, for the purpose of this report, we applied a more conservative
assumption that the coal units (other than Rabin A for which a decision has already been
made), will be kept operational during peak months (summer and winter), and will be shut
down during off-peak periods.
20Electricity Capacity and Generation Forecast by Fuel
In MW*
Gas % of
Total Gas % of
Coal Gas Renewables total
Capacity Generation
Capacity**
2016 4,840 11,828 917 17,585 67% 62%
2020 3,400 15,250 1,550 20,200 80% 73%
2025 3,400 18,600 3,800 25,800 82% 82%
2030 3,400 23,900 6,100 33,400 83% 83%
2040 3,400 36,300 10,600 50,300 86% 84%
* Israel and Palestinian self-generation.
** Effective total capacity, with renewable capacity adjusted by a factor of 1:5 to reflect effective maximum
availability
Source: IEC, PUA and BDO analysis
Such an operational regime is equivalent to a 70% effective reduction in Israel’s coal based
electricity generation relative to 2015 levels – and amounts to reducing coal based generation
from 30 billion kWh per year to 9 billion kWh per year. This operation regime will enable Israel
to meet its target to reduce GHG emissions per capita by 17% in 2030. The resulting increase
in electricity generation by gas, is equivalent to a 4.5 BCM increase in gas demand, 3.6 BCM
beyond current consumption levels.
Coal Reduction Forecast Summary
Coal Based Generation Coal Further Gas* due to coal
(bil. kWh) reduction % reduction in BCM
2015 30.0 -
2016 24.8 15%
2017 24.3 19% 0.3
2018 24.3 19% 0.3
2019 24.3 19% 0.3
2020 18.1 40% 1.6
2021 15.1 50% 2.3
2022 10.4 65% 3.5
2023 9.0 70% 3.6
2024 9.0 70% 3.6
2025 9.0 70% 3.6
*Further gas beyond the 2016 reduction
Source: BDO forecast
212. Electricity Demand in International
Perspective
22Overview
Our analysis shows that the Israeli demand for electricity has not reached saturation levels.
On the contrary, it is in the process of rapid growth. In the past twenty years, electricity
consumption in Israel rose by an average annual rate of about 4%, which corresponds with a
2.2% per capita annual increase in demand.
The high growth rate in Israel’s electricity demand is a result of a combination of multiple long-
term characteristics of the Israeli economy: high population growth rate, relatively fast
economic growth, and hot weather conditions. As Israel’s economy continues to grow, both
penetration rate and usage intensity of household electric appliances will continue to increase,
contributing to increased electricity demand.
It should be noted that the decline in electricity demand in 2013 and 2014 was due to the
influences of one-time factors such as unusually moderate climatic conditions and temporary
changes in the economic environment and do not represent a change in the overall trend of
electricity growth. Indeed, in 2015 and 2016 electricity demand growth picked up with 6.4%
and 3% annual growth (respectively).
Israel Electricity Demand Growth Rate
(The annual percentage increase in the production of electricity expressed in kWh)
Financial One-time
9% Crisis Effects*
7%
CAGR 1995-2016: 4%
5%
3%
1%
-1%
-3%
* In 2013-14: one-time combination of: moderate weather, high electricity prices, regulatory light bulb
replacement and economic slowdown
Source: IEC, CBS and BDO analysisOur analysis shows that the rapid growth in demand for electricity in Israel is due to the fact
that consumption has not reached the saturation point.
The annual electricity consumption per capita in Israel stands at 6,500 kWh, which by
comparison represents only 50% of the level in regions of the world with similar climatic
conditions to Israel but with higher income levels. These gaps are expected to diminish
gradually along with an increase in Israel’s standard of living (GDP/capita).
The annual growth rate in electricity consumption in Israel is inherently higher compared to
other OECD nations. It is due to a number of unique characteristics of the Israeli economy: a
high demographic growth; a high rate of growth in per capita GDP; a lower level of penetration
of electrical appliances; and climatic conditions.
Due to the unique characteristics of the Israeli economy, a direct comparison with the
stagnation in electricity demand that is apparent in some other OECD member states in
Europe and in the U.S is inappropriate. Population growth in Europe is close to zero and the
penetration rate of air conditioners in most European countries is very low, due to the cold
climatic conditions. In addition, the heating of homes in Europe is usually by natural gas or
diesel rather than electricity. Because of these characteristics, the level of electricity
consumption in Europe is inherently lower on a relative basis to warm regions where there is
a high level use of air conditioning. High air-conditioning penetration in Israel, along with lack
of residential natural gas infrastructure, result in typical usage of air-conditioners in Israel also
for heating in the winter. Therefore, Israel’s electricity demand potential differs when compared
to other OECD countries, not only in summer but also in winter.
The U.S. characterized by a GDP per capita level that is 50% higher than that of Israel and
per capita electricity consumption that is about 100% higher than the level in Israel.
Israel is still a long way from a level of income where the growth in electricity consumption
levels off. The penetration level in Israel of electric appliances such as air conditioners,
dishwashers, dryers and similar products is still rising. With the rise in the standard of living,
there is also an increase in the intensity of usage of many of these electrical appliances.
Therefore, the rise in electricity consumption is not just the result of increased penetration but
also greater usage intensity. These usage patterns are gradually changing in Israel as income
levels continue to rise.
In addition, population growth in Israel is the highest of OECD nations, and this alone means
that about a 2% annual increase in electricity production is needed just to meet the annual
growth in the number of households. In terms of demographic growth, Israel is the fastest
24growing country in the OECD. Israel’s annual population growth rate stood at 2% in 2016,
which is more than three times the OECD average which is around 0.6%. This is due to high
fertility rates and a net migration level of Jews from abroad.
Israel has the highest fertility rate in the OECD by a considerable margin. The Israeli average
is 3 children per woman compared to the OECD average of 1.7.
Over the long term, our electricity demand forecast is based on the assumption that population
growth rate will decline slightly. Recent trends point to a drop in fertility rates in the Israeli
Arab population that represents 20% of the total. Over the past decade, the annual population
growth in the Israeli Arab population has declined from around 3% to less than 2.2% in
2016. The growth rate among Jews has actually increased over the same period from 1.4%
to 1.9%, largely due to the higher birth rate among ultra-Orthodox (Haredi) Jews.
According to Israel's Central Bureau of Statistics (CBS) latest projections, published in May
2017, Israel’s population is projected to reach 13.2 million by 2040, compared to 8.6 million
today. This translates into a 56% increase in 24 years, an average annual growth rate of
1.8%. The high population growth rate ensures a substantial minimal level of growth in the
demand for electricity which is required just to maintain the current standard of living level,
before accounting for additional growth drivers, such as the projected increase in standard of
living.
25Influence of Standard of Living
The demand for electricity is influenced by the economic activity in the various sectors of the
economy, and is effected by the level of investment and activity in the economy, by disposable
household income and by public sector expenditure. Hence, economic growth or slowdown
has a significant effect on electricity demand.
Electricity is characterized by high income-elasticity. The analysis of comparative international
data shows that a 10% increase in the GDP per capita correlated with a 10% rise in demand
for electricity. This means that the elasticity of demand in relation to income is almost one.
The following chart presents an international comparison of electricity consumption in relation
to GDP per capita. It shows the correlation between electricity consumption and the standard
of living and underscores that the level of consumption in Israel is far from reaching the
saturation point. According to the projection based on the Macro Analytics macro-economic
model of the Israeli economy, GDP per capita is expected to reach $57,000 in real terms by
2040. Based on international comparison, the appropriate per capita consumption of electricity
that corresponds with this income level is 13,200 kWh as illustrated in the chart below. The
red line in the chart illustrates Israel’s electricity demand forecast through 2040 relative to the
GDP/capita forecast. The chart shows that an increased electricity demand forecast in Israel
is consistent with the global demand trend line.
26Income Effect on Electricity Demand - International Comparison
Electricity consumption per capita relative to GDP per capita globally (in blue)
compared to Israel’s Electricity and GDP growth forecast (in red)
25,000
0.9328x0.4836y =
22,500 0.806 =² R
20,000
Bahrain
17,500
Kwh per Capita
Finland Canada Qatar
15,000 Kuwait
Sweden
United States
12,500
UAE
Korea, Rep.
10,000 Brunei
Australia
Saudi Arabia OECD New Zealand
AustriaSingapore
Japan Belgium Switzerland
7,500 France
GermanyNetherlands
China
Spain Italy UK Ireland Denmark
5,000 Greece
2,500 Israel At Israel At
2016 2040
0
0 10,000 20,000 30,000 40,000 50,000 60,000 70,000 80,000 90,000 100,000
GDP per Capita
Source: World Bank data, OECD and BDO analysis
It is important to note that the above chart presents the average consumption without
adjustment to climate conditions. In general, warm countries are expected to have electricity
consumption that is above average and to be above the curve, while countries with moderate
climates would be expected to be below the curve. It should be noted that our forecast reflects
a conservative assumption, that Israel’s positioning relative to the global trend line will not
improve over the years.
In comparison to the U.S., there is substantial potential for growth in Israel for the penetration
of many household appliances. For example, the rate of households in the U.S. with
dishwashers and dryers is two times higher than in Israel, ownership of deep freezers is 50%
higher and the number of households with two television sets or more 40% higher in the U.S.
These examples underscore the lower standard of living in Israel, due to lower income
levels. Consequently, the gradual increase in the standard of living in Israel will lead to
increased ownership of these appliances.
In Europe, the level of ownership of some of these household appliances is lower than in the
U.S. However, we believe this is mainly the result of smaller households and lower fertility
27rates. The fertility rate in Israel is the highest of developed nations and therefore the need and
effectiveness in the use of appliances like dishwashers and dryers is much higher. Hence,
we believe that the US represents a more relevant benchmark to assess the potential
penetration and usage patterns of household appliances in Israel. The growth in ownership
and use of household appliances is expected to continue the upward trend..
Home Appliances Penetrations Rates – Israel vs. USA*
Israel USA
Dishwasher 40% 78%
Dryer 41% 79%
Air conditioner 89% 96%**
Deep freezer 22% 31%
More than one TV set 55% 78%
Gaming consoles 14% 80%
*Sources: Israel – 2015 CBS, US – Freedonia 2016, and DOE 2009
**Southern States
Israel is among the fastest growing countries among developed nations and consistently has
one of the highest growth rates in the OECD. Israel’s annual growth rate since 2004 has
averaged around 4% (about 2% per capita) and we believe this is in line with the country’s
medium term growth potential.
Israel’s growth rate was adversely impacted in the last three years by the international
slowdown along with the strengthening of the Shekel. Despite these factors, Israel has
managed to maintain relatively high growth rates compared to most OECD nations. The Bank
of Israel has declared its intentions to keep interest rates low at near zero levels while the U.S.
Federal Reserve has gradually begun to raise interest rates. The expected gap between US
and Israeli interest rates should yield a devaluation of the Shekel against foreign currencies,
thus stimulating the Israeli economy by increasing the competitiveness of Israeli exports while
reducing competitiveness of imports to Israel compared to local production.
28Average GDP Real Annual Growth 2010-2016
6%
3.9%
4%
2.0%
2%
0%
-2%
-4%
European Union (28…
Korea
Estonia
Mexico
Latvia
Germany
Austria
Portugal
Turkey
Poland
OECD - Total
Switzerland
Japan
France
Chile
Iceland
Luxembourg
United States
Hungary
Denmark
Netherlands
Finland
Spain
Ireland
Israel
Sweden
Australia
Canada
Slovenia
Italy
New Zealand
Belgium
Greece
Czech Republic
Norway
Slovak Republic
United Kingdom
Source: OECD and BDO Analysis
Irrelevance of the Temporary Demand Effect in 2013-14
In the decade between 2002 and 2012, the demand for electricity in Israel rose on average by
3.8% annually. This represents a per capita annual growth rate of 1.9%, similar to our long-
term growth forecast.
In the years 2013 and 2014, the trend reversed itself and demand for electricity actually
fell. Our analysis shows that the decline in those two years was a result of one-time factors
that do not reflect a change in the upward trend of electricity consumption in
Israel. Appropriately, it should be noted that in 2015 demand for electricity rose rapidly, by
6.4%. Subsequently, in 2016, the demand for electricity continued growing by 3.0%.
29Electricity Generation in Israel
In billion kWh
68
66
64
62
Bil.kWh
60
58
56
54
52
50
2009 2010 2011 2012 2013 2014 2015 2016
Source: CBS, IEC and BDO Analysis
Based on our estimates, the slowdown in the demand for electricity in the years 2013-2014 is
due to a series of one-time events, and does not represent a change in the trend. These events
included:
A. A sharp rise in electricity rates due to a shortage of natural gas in 2012 which required
a temporary shift back to oil (before a rate cut that went into effect in January 2015)
B. Mild weather conditions in both years
C. Regulations that required the rapid switchover to energy efficient lighting
D. A slowdown in economic activity
Our analysis shows that with these four one-time factors being neutralized, the growth in
electricity demand in 2013 and 2014 would have been within the range of 3.8% to 4%, similar
to the multi-year growth rate.
The Impact of Weather Conditions
In many economic analyses, OECD countries are used as a point of reference to evaluate the
long-term potential of the Israeli economy. In the case of electricity consumption, however,
due to the unique weather conditions in Israel compared to other OECD countries, a
comparison of electricity consumption between Israel and the other member states is not
relevant.
30Indeed, Israel is the warmest country in the OECD. The heat index in Israel, in terms of cooling
degree-days (beyond 22 degrees centigrade), is more than four times higher than the OECD
average. In fact, there is no other OECD country that is characterized by such a high heat
index as Israel.
The irrelevance of comparison with OECD countries
Heat index in OECD countries and Israel
(Cooling degree-days - CDD22, average over the past five years)
1,000
900
800
700
Cooling Degree Days
600
500
400
300
200
100
0
Estonia
Israel
Czech Republic
Australia
Luxembourg
Netherlands
Mexico
Austria
Japan
Norway
Spain
Turkey
Italy
Greece
Portugal
Slovakia
France
Finland
Chile
Canada
Switzerland
Denmark
Korea
Belgium
Slovenia
Sweden
Ireland
Iceland
United States
Hungary
Poland
Germany
United Kingdom
New Zealand
Coolonig degree days above 22 degree celcius Average without Israel
Source: BDO Analysis and Degree Days.net
The only country where the heat index approaches that of Israel is Greece. However, Israel’s
per capital GDP is 40% higher than that of Greece, and ownership of air conditioners in Greece
is substantially lower than in Israel – 87% in Israel compared to less than 40% in Greece.
Therefore, none of the OECD countries represents a relevant comparison benchmark for
Israel’s potential electricity demand.
Hence, it is not possible to base the potential level of electricity consumption in Israel on a
direct comparison with OECD countries. Appropriate examination of the Israeli potential
electricity demand should be carried out by comparison to other hot regions around the world.
31A comparative study of per capita electricity consumption, which takes into account the
climatic conditions in warm regions and countries, shows that per capita consumption in Israel
is 50% lower than the trend line of countries with a warm climate.
The chart below presents the inter-dependence between the climatic conditions (as expressed
in cooling degree-days) and per capita electricity consumption in warm regions
worldwide. The comparison includes regions with an average per capita income level above
$50,000 a year.
Electricity Consumption relative to Heat Index
International Comparison, kWh per capita vs. heat index (CDD22)
20,000
Louisiana
Alabama
18,000 Kuwait
MississippiSouth Carolina
16,000 Arkansas UAE (Dubai)
Oklahoma
Tennessee
Qatar
kWhper Capita
14,000 Kansas Perth Texas
Georgia
12,000 Brisbane
Florida
10,000 Adelaide Sydney
Melbourne
8,000
Israel:2015 Israel:2040
6,000
0 500 1,000 1,500 2,000 2,500 3,000
CDD 22
Source: World Bank and BDO analysis
Note that we have not included a similar comparison for heating degree-days, as such a
comparison would not account for the fact that in most developed countries residential winter
heating is based predominantly on boilers running on gas or diesel. In contrast, Israel has no
residential gas distribution system. Therefore, in contrast with other developed countries, air-
conditioners in Israel provide the main source for both heating and cooling.
This relatively low level of electricity consumption in Israel is a result of a standard of living
that is 50% lower than other comparable warm countries. In line with this, we expect that in
the coming years the standard of living in Israel will rise and be accompanied by an increase in the
consumption of electricity as well as by closing of the gap between Israel and other developed
warm weather countries with high-income levels.
32The effect of weather conditions on electricity consumption is evident when analyzing
electricity demand levels in various U.S. states. There is a high variability in climatic conditions
in different regions in the United States. This high variance leads to large differences in
electricity consumption patterns. In the south, where the climate is hot and humid, and similar
to Israel, per capita electricity consumption is nearly twice the level of Israel. We believe that
the main reason for the low per capita consumption in Israel is the result of the gap in the
standard of living. The consumption gap is expected to be reduced as the per capita income
level rises.
According to this analysis, and assuming Israeli electricity tariffs are in line with the average,
Israeli per capita consumption of electricity is expected to reach the level of 12,500 kWh when
per capita income levels reach $60,000 annually. Our more conservative forecast assumes
that Israel’s demand per capita will reach 10,000 kWh when GDP reaches $57,000 in 2040.
33Electricity Prices Impact on Demand
According to our econometric analysis of past years trend, the elasticity of demand for
electricity in relation to price in Israel stands at approximately 0.352. This means that a 10%
increase in price will lead to a 3.5% drop in demand and vice versa, a 10% drop in rates will
lead to a 3.5% increase in demand with all other variables being equal. The process of
adjustment of demand to a change in price is gradual over a period of around three years.
Electricity prices in Israel are below average compared to EU countries. The low electricity
prices are mainly a result of the dense and urban nature of Israel, which results in lower
transmission network costs, as well as lack of carbon taxes.
Residential Electricity Prices – International Comparison, 2016
35
30
25
Euro cents/kWh
20
15
10
5
0
Italy
Portugal
Spain
Greece
France
Cyprus
Finland
Slovakia
Croatia
Estonia
Latvia
Israel
Bulgaria
Denmark
Belgium
Ireland
Czech Republic
Romania
Sweden
Luxembourg
Netherlands
Lithuania
Germany
Austria
United Kingdom
Slovenia
Poland
Malta
Hungary
Source: Eurostat and BDO Analysis (Including VAT)
In the years 2010-2013, the electricity tariff in Israel rose by about 18%, due to the temporary
shortage of natural gas and the use of more expensive fuels. The impact of the elasticity of
demand in relation to price in this case led to about a 5.5% decline in demand during those
years.
The conclusion is that the slowing of the trend in the demand over those three years was
partially due to the influence of rate hikes caused by a shortage of natural gas, and not from
a change in consumption patterns for electricity.
2
Similar price elasticity coefficients were estimated by Milken Institute Research, 2012.
34You can also read


