LABORATORY EXPERIMENTS AND GRAIN BASED DISCRETE ELEMENT NUMERICAL SIMULATIONS INVESTIGATING THE THERMO-MECHANICAL BEHAVIOUR OF SANDSTONE - EARTHARXIV
←
→
Page content transcription
If your browser does not render page correctly, please read the page content below
Laboratory experiments and grain based discrete
      element numerical simulations investigating the
         thermo-mechanical behaviour of sandstone

James Woodmana,b,∗, Audrey Ougier-Simoninc , Anastasios Stavroud , Ioannis
    Vazaiosd , Willliam Murphya , Mark E. Thomasa , Helen J. Reevesb
       a University  of Leeds, School of Earth & Environment, West Yorkshire, UK
                b Jacobs  Engineering Group Inc., 1 City Walk, Leeds, UK
        c British Geological Survey, Environmental Science Centre, Keyworth, UK
                 d Ove Arup & Partners Ltd, 13 Fitzroy Street, London, UK

    This manuscript is a non-peer reviewed preprint submitted to
                            EarthArXiv.

     The manuscript has been submitted to the Journal of Rock
            Mechanics and Geotechnical Engineering.

Abstract
     Thermo-mechanical loading can occur in numerous engineering geological
environments, from both natural and anthropogenic sources. Different miner-
als and micro-defects in rock cause heterogeneity at a grain scale, affecting the
mechanical and thermal properties of the material. Changes in strength and
stiffness can occur from exposure to elevated temperatures, with the accumu-
lation of localised stresses resulting in thermally induced micro-cracking within
the rock. In this study we investigated thermal micro-cracking at a grain scale
through both laboratory experiments and their numerical simulations. We per-
formed laboratory triaxial experiments on specimens of fine grain sandstone at
a confining pressure of 5 MPa and room temperature (20 ◦C), as well as heat-
ing to 50 ◦C, 75 ◦C and 100 ◦C prior to mechanical loading. The laboratory
experiments were then replicated using discrete element method simulations.
The geometry and granular structure of the sandstone was replicated using a
Voronoi tessellation scheme to produce a grain based model. Strength and stiff-
ness properties of the Voronoi contacts were calibrated to the laboratory spec-
imens. Grain scale thermal properties were applied to the grain based models
according to mineral percentages obtained from quantitative X-ray diffraction

  ∗ Correspondingauthor
   Email address: jameswoodman@protonmail.com (James Woodman)

Preprint submitted to Journal of Rock Mechanics & Geotechnical Engineering May 30, 2020
analysis on laboratory specimens. Thermo-mechanically coupled modelling was
     then undertaken to reproduce the thermal loading rates used in the laboratory,
     before applying a mechanical load in the models until failure. Laboratory results
     show a reduction of up to 15% peak strength with increasing thermal loading
     between room temperature and 100 ◦C, and micro-structural analysis shows the
     development of thermally induced micro-cracking in laboratory specimens. The
     mechanical numerical simulations calibrate well with the laboratory results, and
     introducing coupled thermal loading to the simulations shows the development
     of localised stresses within the models, leading to the formation of thermally
     induced micro-cracks and strength reduction upon mechanical loading. Subse-
     quently the potential for up-scaling the results for inclusion in future engineering
     design is discussed.
     Keywords: thermo-mechanical, micro-crack, triaxial, grain based DEM

     1. Introduction

         Coupled thermo-mechanical processes present engineering challenges in a
     number of geological environments. Climate and weather can induce thermo-
     mechanical loading in surface rock, with diurnal temperature fluctuations caus-
5    ing strength and stability issues due to progressive damage (Lamp et al., 2017;
     Collins and Stock, 2016). Thermal loading due to the geothermal gradient is
     paramount in deep mining, for instance the TauTona gold mine currently op-
     erating at a depth of 3.9 km under average temperatures of 60 ◦C (Neingo and
     Tholana, 2016), as well as deep tunnelling with rock temperatures of 46 ◦C at
10   the Gotthard Base Tunnel situated at a depth of 2.5 km (AlpTransit, 2016; Ry-
     bach and Pfister, 1994). Additionally, the introduction of anthropogenic heat
     sources, such as the heat generated by radioactive decay of high-level radioactive
     waste in geological environments, is projected to induce local thermal loading
     of approximately 60 ◦C in addition to the natural geothermal gradient, peaking
15   approximately 50 years after emplacement and decreasing thereafter (Quintessa,
     2012).
         Research into the thermo-mechanical loading of rock began in the 1970s, with
     studies focussed on the Earth’s crustal behaviour. These early studies primarily
     investigated crustal lithologies such as granite, gabbro, dolerite and rhyolite and
20   found that thermally loading specimens from room temperature up to tempera-
     tures as high as 800 ◦C induced micro-cracking and caused irrecoverable thermal
     expansion. This thermal micro-cracking was attributed to result from localised
     stress concentrations induced by the thermal expansion heterogeneity of adja-
     cent minerals with different thermal expansion coefficients, and occurred in the
25   absence of a thermal gradient across a rock specimen (Richter and Simmons,
     1977). Subsequently thermal micro-cracking was shown to occur under confin-
     ing pressures (up to at least 600 MPa) (Wong and Brace, 1979; Heard and Page,
     1982; Bauer and Handin, 1983). Adding mechanical and physical measurements
     to testing protocols showed that thermally induced micro-cracking was found to

                                              2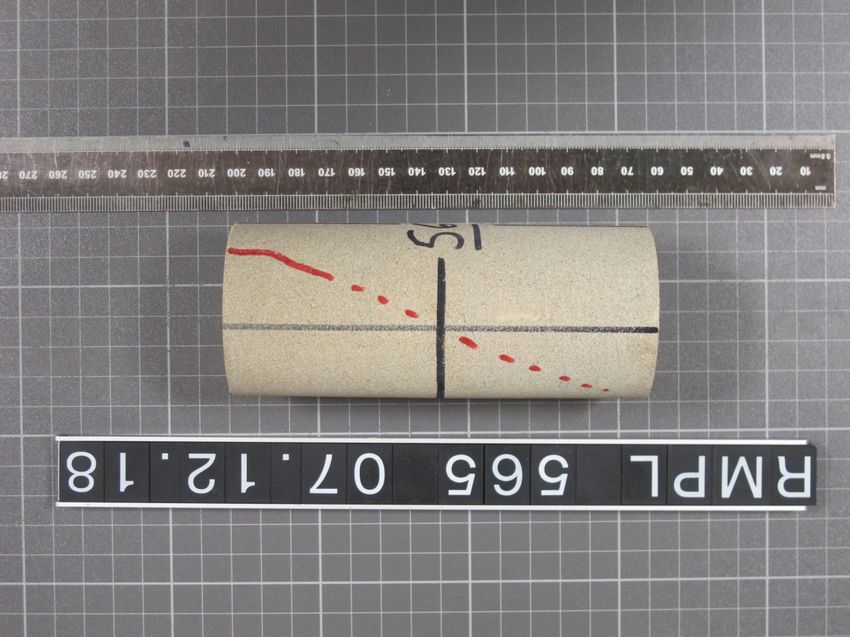
30   be significant enough to affect Young’s modulus (Simmons and Cooper, 1978;
     Bruner, 1979; Heard and Page, 1982), ultrasonic velocities (Johnson et al., 1978),
     seismic attenuation (Johnson et al., 1978; Clark et al., 1981), fracture toughness
     (Meredith and Atkinson, 1985), permeability (Bauer and Johnson, 1979) and
     produce acoustic emissions (Johnson et al., 1978; Chen and Wang, 1980).
35       In comparison to studies focussed on crustal processes, there are fewer studies
     exploring thermo-mechanical effects at temperatures and pressures applicable to
     geo-engineering environments. Multiple large scale in-situ heater experiments
     have been undertaken to examine the effects of thermo-mechanical loading on
     rock masses (Barton, 2007). But little work examining the small scale processes
40   underpinning any macroscopic damage related to rock engineering practices
     exist. Recently Siegesmund et al. (2018) studied the thermal expansion of 65
     granitic lithologies up to 100 ◦C, with implications for the use of granitoids
     as building stones and façade materials. Plevová et al. (2011) and Zhou et al.
     (2016) both undertook thermal studies on different sandstones. All three of these
45   recent studies have shown that progressive damage can occur due to thermal
     loading at temperatures applicable to rock engineering environments.
         Over the last 30 years, there have been significant advancements in the ability
     of different discrete modelling techniques to simulate the progressive damage,
     and micro-mechanical processes that occur during brittle rock failure. For a
50   comprehensive review of the development and capabilities of different discrete
     modelling techniques we refer the reader to Lisjak and Grasselli (2014). In tra-
     ditional Discrete Element Method (DEM) simulations, rock failure is captured
     through plastic yielding of rock blocks, or displacement on pre-existing discon-
     tinuities. However, Lorig and Cundall (1989) showed that Voronoi tessellation
55   could allow the micro-structure of rock to be represented, with the development
     of micro-cracks occurring when the stress level at Voronoi block contacts exceeds
     a predefined threshold. Many studies have since shown the ability of these grain
     based modelling (GBM) methods to capture the progressive fracturing and fail-
     ure behaviour of different rock types due to mechanical loading over a range of
60   stresses within the brittle field (Christianson et al., 2006; Gao and Stead, 2014;
     Damjanac et al., 2007; Stavrou and Murphy, 2018; Farahmand, 2017). DEM
     GBMs have also proven to be a useful tool to scale the mechanical behaviour of
     intact rock at the laboratory scale to the behaviour of rock blocks at an engi-
     neering scale (Stavrou and Murphy, 2018; Stavrou et al., 2019). The effects of
65   thermo-mechanical loading have also been demonstrated in GBMs. Lan et al.
     (2013) simulated a large scale in-situ thermal loading experiment (the Äspö
     Pillar Stability Experiment (Andersson, 2007; Andersson et al., 2009)), using
     a thermo-mechanically coupled tunnel scale Voronoi based GBM to capture
     thermo-mechanically induced displacements and provided new insights to the
70   localised stress distribution and micro-cracking in a thermo-mechanically loaded
     rock mass. (Park et al., 2015) created laboratory scale thermo-mechanically cou-
     pled Voronoi GBM simulations of the Hwangdeung granite, again showing the
     development of displacement due to thermal expansion and the formation of
     thermally induced micro-cracking, however no laboratory data were provided to
75   allow comparison of the strength and deformation properties at elevated tem-

                                             3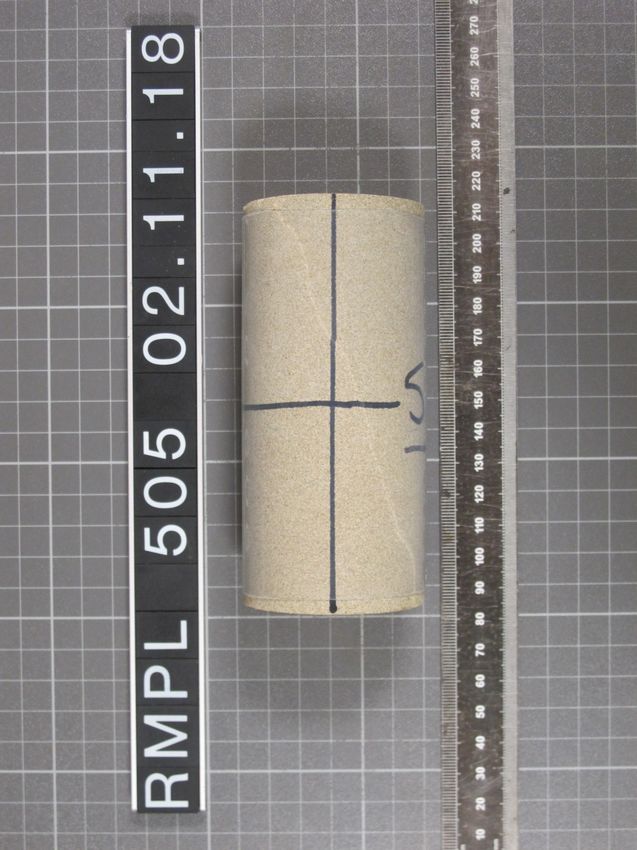
Table 1: Properties obtained from baseline characterisation testing of the Thornhill Rock
      (Woodman et al., 2018; Woodman, 2020). The standard deviation is the measure of variability
      reported with the mean values.
                       Property                                Unit          Mean value
                     Density (ρ)                              kg m−3       2250.0 ± 22.12
                     Porosity (ϕ)                                %           15.5 ± 0.02
        Unconfined compressive strength (UCS)                  MPa          50.80 ± 8.20
                Young’s modulus (E)                            GPa           8.70 ± 1.26
                  Poisson’s ratio (ν)                            -           0.22 ± 0.02
                 Tensile strength (σt )                        MPa           4.20 ± 0.60
                     Cohesion (c)                              MPa               9.63
                                                                  ◦
                  Friction angle (φ)                                            49.73

      peratures.
          In this study, we undertake elevated temperature laboratory triaxial tests
      to investigate induced thermo-mechanical effects on sandstone microstructure
      and brittle failure micromechanisms. Experiments were conducted at a confin-
80    ing pressure of 5 MPa and temperatures ranging from 20 to 100 ◦C to represent
      conditions for deep geo-engineering environments. We then further explore the
      progressive damage processes through thermo-mechanically coupled numerical
      simulations using DEM GBMs to represent the microstructure of the tested labo-
      ratory rock specimens to provide the first simulations of such thermo-mechanical
85    experiments.

      2. Laboratory testing

      2.1. Laboratory specimens and methods
          Specimens used in this study were of Thornhill Rock, a light brown fine-
      grained sandstone from the Pennine Middle Coal Measures Formation (Lower
90    Carboniferous), in West Yorkshire, UK Stone et al. (2010). Blocks of dimen-
      sion stone were obtained from Britannia Quarry, Leeds (53◦ 43’55” N 1◦ 35’49”
      W). Basic mechanical properties of the Thornhill Rock from this location have
      previously been characterised through laboratory testing and are summarised
      in Table 1. Eight specimens from one block of dimension stone were prepared
95    in accordance with International Society for Rock Mechanics (ISRM) suggested
      methods Ulusay (2014). Specimens were cored perpendicular to bedding with
      a diamond impregnated coring drill to 54 mm diameter and sawn to approxi-
      mately 120 mm in length. Both ends were then ground flat to an accuracy of
      ±0.02 mm, not departing from perpendicularity to the axis of the specimen by
100   more than 0.025 mm in 25 mm using a diamond sintered grinding wheel, thus
      preventing an uneven disctribution of stress on the specimen ends during exper-
      imentation Hawkes and Mellor (1970). Specimens were oven-dried at 40 ◦C for
      at least 48 h prior to testing.

                                                  4
Elevated temperature triaxial testing was undertaken at the Rock Mechan-
105   ics and Physics Laboratory, British Geological Survey (BGS). Test procedures
      were designed to replicate thermo-mechanical boundary conditions that may
      be expected in a deep rock engineering scenario, such as a deep tunnel, mine
      or generic geological disposal facility with the emplacement of heat generating
      radioactive waste. The worst case thermal load on the rock mass in any of these
110   cases is likely to be approximately 100 ◦C. Tests were therefore undertaken at
      ambient room temperature (≈ 20 ◦C), 50 ◦C, 75 ◦C and 100 ◦C, with two speci-
      mens tested at each temperature. All tests were undertaken at 5 MPa confining
      pressure. Depending on the density of overburden, ground saturation, the re-
      gional stress field and the coefficient of lateral earth pressure, this equates to a
115   depth of between 200 and 500 m depth.
          The test apparatus consisted of a servo-controlled stiff frame (maximum axial
      load up to 4600 kN), with a confining pressure vessel (capable of pressure up to
      140 MPa). The confining cell was fitted with external heater bands and utilised
      cascade control from internal and external thermocouples (accurate to ± 0.5 ◦C)
120   (Fig. 1). A 1500 kN capacity force transducer (accurate to 0.32% of load) was
      used to measure the axial load. After preparation, the specimens were placed
      between two hardened steel platens encased in two layers of 0.5 mm Polytetraflu-
      oroethylene (PTFE) heat shrink tubing and sealed using self-amalgamating sil-
      icone tape and stainless steel locking wires to prevent the ingress of confining
125   fluid. The specimens were instrumented with two axial extensometers (accurate
      to ± 0.01%), positioned diametrically opposite each other, and a circumferential
      chain extensometer (accurate to ± 0.01%) positioned mid-length. A spherical
      seated platen was used between the specimen and the capacity force transducer
      to prevent eccentric loading. Finally a thermocouple was positioned inside the
130   cell as close to the specimen as possible.
          An initial axial pre-load of 2.3 kN was applied to specimens, to ensure a stable
      contact and alignment of the platens. In tests undertaken above ambient room
      temperature a confining pre-load of 0.5 MPa was then applied whilst heating
      was undertaken. Heating was undertaken at 1.5 ◦C min−1 to the desired thermal
135   load of either 50 ◦C, 75 ◦C or 100 ◦C. A loading rate of 1.5 ◦C min−1 ensured
      specimens were not thermally shocked, and ensured a low temperature gradient
      across the specimens. Slight temperature overshoot occurred in tests at 50 ◦C
      and 75 ◦C, due to the temperature cascade control being calibrated at 100 ◦C
      and fluctuations in room temperature. Based on a thermal conductivity (k) of
140   2.3 W m−1 K−1 , density (ρ) of 2250 kg m−3 and specific heat capacity (cp ) of
      700 J g−1 K−1 , thermal diffusivity (κ) can be calculated as:
                                                 k
                                          κ=                                          (1)
                                               ρ · cp
         thermal diffusivity of specimens is given as approximately 1.4 × 10⁻⁶ m2 s−1 ,
      and specimen radius (r) is 2.7 × 10⁻² m, therefore the time constant for temper-
      ature equilibrium (r2 /κ) Wang et al. (2013), is approximately 900 s. To ensure
145   thermal equilibrium across the specimen, temperature and pre-loads were held

                                               5
Stiff crosshead
a) b)
Pressure
vessel
Load cell
Hemispherical
seat
Heater
bands
Specimen with axial
& circumferential
extensometers
Thermocouples
Cable feedthroughs
Baseplate
Hydraulic actuator piston
Figure 1: a) Schematic diagram of an instrumented specimen set up in the pressure vessel for
triaxial testing. b) Photograph of a specimen set up in the pressure vessel for triaxial testing.
constant for 30 min prior to loading the specimen in axial extensometer con-
trol at an axial strain rate of 5 × 10⁻⁶ s−1 . When the specimen began to yield
and dilate volumetrically, control was switched to circumferential extensometer
control at 1 × 10⁻³ mm s−1 to better control the radial dilation of the specimen
150 and capture the failure process. After the specimen failed and residual strength
was reached, the test was terminated at 2 mm circumferential extension.
Micro-structural analysis was also undertaken on laboratory specimens. Pol-
ished thin sections were prepared from specimens after thermo-mechanical load-
ing, however the mechanical deformation was seen to overprint any thermal
155 micro-cracking. Therefore two new specimens were prepared. One specimen
(# 601) was prepared and oven dried at 40 ◦C for 48 h as with specimens pre-
pared for triaxial testing. The second specimen (# 602) was prepared and oven
dried at 40 ◦C for 48 h, before being thermally loaded in a convection oven at
1 ◦C min−1 to 100 ◦C, and held for one hour before being left to passively cool.
160 Specimens were epoxy impregnated under vacuum to preserve deformation prior
to polished blocks being made suitable for micro-structural analysis. Scanning
Electron Microscopy (SEM), consisting of back scattered electron (BSE) and
SEM-Cathodoluminescence (SEM-CL) imaging was undertaken using an FEI
Quanta 650 Field Emission Gun SEM operated at 20 kV.
165 2.2. Laboratory results
Results of the eight thermo-mechanical triaxial tests undertaken in this study
are tabulated in Table 2. The raw data from each test were processed, separat-
6ing the thermal and mechanical loading portions of each test. Fig. 2 shows data
from the thermal loading phase of a test undertaken at 100 ◦C. For the thermal
170 loading of all specimens, a lag is observed in the first 1000 s between the heating
command at 1.5 ◦C min−1 and the heating of the specimen measured from the
thermocouple within the triaxial pressure vessel. This is due to the initial heat-
ing of the steel pressure vessel and mineral oil confining fluid prior to heating of
the specimen itself. Heating then occurs at a slightly slower rate (1.1 ◦C min−1 )
175 than the heating command (1.5 ◦C min−1 ), before the servo-control feedback re-
duces the heating rate and it plateaus to the desired temperature. Due to the
calibration of the feedback on the temperature servo-controller, all tests under-
taken at 50 ◦C overshot the target temperature and were actually undertaken in
the region of 53 ◦C to 56 ◦C. All thermally loaded tests above 50 ◦C show a peak
180 in the confining pressure and axial stress during heating (≈ 4000 s on Fig. 2c &
d) of approximately 0.1 MPa, which is due to manual repriming of the confining
pressure intensifier, necessary due to the thermal expansion of the confining oil.
Fig. 2 shows specimen deformation due to thermal expansion up to 100 ◦C.
The axial extensometers do not show expansion, and instead record compaction
185 during the heating phase. This may be as a result of increased ductility of the
PTFE jacket resulting in slipping of the specimen within the jacket, and slipping
of the extensometers on the jacket. This same result occurred during calibration
testing on aluminium dummy specimens Woodman (2020). However, the cir-
cumferential strain recorded from the circumferential chain extensometer shows
190 dilation throughout heating. Isotropic thermal expansion is therefore assumed
and the circumferential extensometer deformation (εc ) is used to calculate the
linear thermal expansion coefficient (αL ) for each specimen as:
εc
αL = (2)
∆T π
where ∆T is the change in temperature.
ID Temp. Length Diam. Peak diff. stress E ν CI CD αL
(◦C) (mm) (mm) (σ1 − σ3 ) (MPa) (GPa) (MPa) (MPa) 10−6 K−1
565 24.0 128.80 54.02 99.45 13.81 0.20 38.93 74.45 —
566 20.1 124.71 54.04 97.21 15.90 0.19 40.03 74.76 —
504 56.3 119.79 53.98 89.09 15.55 0.20 37.05 66.82 3.15
503 53.4 117.65 53.98 89.41 15.64 0.20 35.68 67.00 4.29
501 75.2 121.46 53.99 85.72 15.78 0.21 35.40 63.67 3.78
505 74.8 119.22 53.99 87.57 15.77 0.21 36.23 64.64 2.99
562 100.0 124.46 53.98 83.32 15.47 0.21 35.22 62.38 3.43
563 100.0 129.97 54.00 82.94 15.00 0.22 33.84 61.31 3.19
Table 2: Results of thermo-mechanical triaxial testing on specimens of Thornhill Rock. (E =
Tangential Young’s modulus. ν = Poisson’s ratio. CI = Crack initiation. CD = Crack
damage. αL = Coefficient of linear thermal expansion).
All specimens subjected to thermal loading under pre-load conditions of
195 1 MPa axial stress and 0.5 MPa confining pressure displayed similar deformation
during thermal loading, with linear thermal expansion coefficients ranging from
2.99 × 10⁻⁶ K−1 to 4.29 × 10⁻⁶ K−1 .
7a)
100
Temperature (°C)
80
60
Temperature inside triaxial cell
40
Temperature control command
20
0 1000 2000 3000 4000 5000 6000 7000 8000 9000
Time (s)
b) 0.05 100
Temperature (°C)
Strain (%)
0 Volumetric strain 80
Axial strain
-0.05 Circumferential strain 60
-0.1 40
-0.15 20
0 1000 2000 3000 4000 5000 6000 7000 8000 9000
Time (s)
c) 1.1 100
Temperature (°C)
Axial stress (MPa)
1.05 80
1 60
0.95 40
0.9 20
0 1000 2000 3000 4000 5000 6000 7000 8000 9000
Time (s)
d) 0.6 100 Temperature (°C)
pressure (MPa)
80
Confining
0.55
60
0.5
40
0.45 20
0 1000 2000 3000 4000 5000 6000 7000 8000 9000
Time (s)
Figure 2: a) Thermocouple data on the heating of Specimen # 562 within the triaxial pressure
vessel, compared with the 1.5 ◦C min−1 heating command. b) Volumetric, axial and circum-
ferential deformation of the specimen during heating due to thermal expansion. c) Constant
axial stress of 1 MPa maintained during thermal loading. d) Constant confining pressure of
0.5 MPa maintained during thermal loading.
8The stress-strain curves (Fig. 3) for all temperatures display typical com-
pressive brittle behaviour (Hoek and Bieniawski, 1965). The repeat tests at
200 each temperature show good repeatability, as expected from homogeneous spec-
imens. Young’s modulus (E) (tangential modulus) and Poisson’s ratio (ν) were
calculated at 50% of the peak stress Jaeger et al. (2007); Ulusay (2014) us-
ing measurements from the axial and circumferential extensometers. The crack
damage (CD) threshold for each specimen was taken at the point of maximum
205 volumetric compaction, and the crack initiation (CI) threshold was calculated
using the lateral strain response method Nicksiar and Martin (2012).
100
90
80
Axial differential stress (MPa)
70
60
50
40
30
20 peak stress CI CD
20°C (average peak stress = 98.33 MPa)
50°C (average peak stress = 89.25 MPa)
10 75°C (average peak stress = 86.64 MPa)
100°C (average peak stress = 83.13 MPa)
0
-2.0 -1.5 -1.0 -0.5 0.0 0.5 1.0 1.5
Strain (%)
Figure 3: Axial stress vs. radial and axial strain data for triaxial tests on specimens of
Thornhill Rock, carried out at 5 MPa σ3 and temperatures of 20 ◦C, 50 ◦C, 75 ◦C and 100 ◦C.
(CI = crack initiation. CD = crack damage).
A strength reduction is observed with increasing thermal loading. The peak
differential strength reduces by approximately 17% between testing at room
temperature and at 100 ◦C. Photographs of specimens after testing (Fig. 4)
210 show the formation of a single shear plane fracture at all temperatures tested.
The shear plane did not develop well in the tests undertaken at 100 ◦C, and
the shear plane at 50 ◦C is not distinctly different from tests undertaken at
20 ◦C or 75 ◦C, despite the large stress drop post-peak. All developed fractures
are planar, with little undulation or lobing and form at angles between 18◦
215 and 28◦ from the vertical. It is important to note the ingress of oil to some
specimens. This typically occurred at elevated temperatures as the PTFE jacket
9became more ductile, allowing ingress of oil to the specimen from the platens.
However, the specimens are not saturated, suggesting the oil ingress occurred
after the confining pressure had been removed during unloading. Consequently,
220 this is not considered to affect the thermo-mechanical behaviour observed in the
experiments.
3. Grain based modelling
Following on from laboratory thermo-mechanical triaxial testing on speci-
mens of Thornhill Rock, Universal Distinct Element Code (UDEC) v6.0 Itasca
225 (2014) was used to build Discrete Element Method (DEM) grain based models
(GBM) representing the micro-structure of the laboratory specimens, allowing
further investigation of the fundamental mechanisms of progressive damage un-
der thermo-mechanical loads.
Conventionally in UDEC rock failure is captured either through plastic yield-
230 ing of the rock matrix, or through sliding on explicitly modelled discontinuities
Lisjak and Grasselli (2014). This means that the formation of fractures through
intact rock cannot be simulated. However, Lorig and Cundall (1989) introduced
Voronoi tessellation to UDEC. The UDEC GBM utilises a Voronoi tessellation
of deformable blocks to represent mineral grains, bonded at their contacts to
235 represent the micro-structure of crystalline or granular rock. Fracture damage
and development can therefore occur at the block boundaries when a stress
level at the interface is exceeded either through thermal or mechanical loading
Lisjak and Grasselli (2014). The strength and stiffness of a GBM is governed
by the grain contact micro-properties, as well as the grain size and grain size
240 distribution of the Voronoi blocks, with the explicit generation, propagation and
accumulation of micro-cracks. When a thermal or mechanical load is applied
to the model, a perturbation is induced and a series of mechanical interactions
between Voronoi blocks leads to the development and transmission of contact
forces, the generation of localised heterogeneous stresses and eventually motion
245 causing disturbance to the equilibrium of the system. The propagation speed of
the movement depends on the physical micro-properties of the Voronoi elements
within the discrete system. Further details on the equations of motion, conser-
vation of momentum and energy equations, contact detection schemes, block
deformability equations, and mechanical damping schemes for the 2D distinct
250 element method utilised in UDEC can be found in Itasca (2014).
In all models in this study each Voronoi block is treated as an elastic con-
tinuum, sub-divided into triangular finite difference zones. Voronoi contacts
obey a linearly elastic-perfectly plastic model, with normal and shear deforma-
bility represented by normal (kn ) and shear (ks ) stiffnesses (Fig. 5). The shear
255 strength of the Voronoi contacts follow the Mohr-Coulomb criterion. In all
simulations, if the induced contact forces exceed the tensile or shear strength of
Voronoi contacts, a plasticity flag is set to declare the irreversible plastic state of
the contact. Instantaneous softening then occurs with the micro-cohesion (cm )
and micro-tensile strength (σtm ) of the Voronoi contact reduced to zero and the
260 micro-friction angle (φm ) of the Voronoi contact reduced to a residual value.
10a) b)
20°C 50°C
c) d)
75°C 100°C
Figure 4: Photographs of specimens of Thornhill Rock after themo-mechanical triaxial testing,
all tests were undertaken at 5 MPa σ3 . Note slight oil ingress to specimens a) & d).
11Forces are then redistributed allowing the relocalisation of stresses, which may
in turn induce further micro-crack propagation and eventually macroscopic fail-
ure. This failure process allows the GBM to realistically capture the progressive
failure process of micro-cracking in brittle crystalline and granular lithologies.
Shear
Force
Contact
Breakage
ks
1
Shear Displacement
Contact
Breakage
kn
ks kn
Compression
1
Extension
Fs
Fn
Overlap
Figure 5: Voronoi structure and Mohr-Coulomb constitutive behaviour of the Voronoi contacts
in the UDEC GBM. After Stavrou and Murphy (2018).
265 3.1. Numerical model set up
Specimens for numerical modelling were generated at the same scale as in
the laboratory. Rectangular specimens (representing the cylindrical laboratory
specimens in 2D plane strain) of 54 × 120 mm were generated for uniaxial and
triaxial compression testing, and 54 mm diameter circular specimens were gen-
270 erated for indirect tension Brazilian disc testing, for calibration purposes (Fig.
6). Both specimen types were bounded by steel platens top and bottom.
Specimens were discretised into Voronoi tessellations with an average grain
edge length of 3 mm. Different Voronoi block size and block size distributions
are known to result in differing mechanical behaviour, as fractures can only form
275 along contacts between adjacent Voronoi blocks, thus controlling the failure pat-
tern. This phenomenon also results in models with a smaller block size having
less effect on the failure pattern. Gao and Stead (2014) found that a 160 mm
tall model with a Voronoi block size of 4 mm block size allowed for represen-
tative failure mechanisms of both axial splitting and shear failure. Therefore
12a)
b)
54 mm
120 mm
Monitoring Locations
Axial Stress
30 mm Axial Strain
54 mm Axial & Lateral Strain
Figure 6: Model dimensions, boundary conditions and monitoring locations for numerical
simulations. a) Uniaxial and triaxial compression testing simulations. b) Indirect tension
Brazilian disc testing simulations.
13280 despite the grain size in laboratory specimens of Thornhill Rock being in the
range of 63 to 250 µm, in this study a Voronoi block size of 3 mm is utilised to
allow for representative failure mechanisms, whilst maintaining computational
efficiency, and also satisfying the recommendation that the specimen diameter
in uniaxial compression testing should be at least ten times greater than the
285 size of the largest grain Ulusay (2014). The Voronoi tessellation was developed
with a relatively uniform grain size distribution to mimic the micro-structural
homogeneity of the Thornhill Rock.
In uniaxial and triaxial compression testing simulations, the axial stress was
measured using a FISH function at an imaginary crack within the upper platen.
290 A grid of history points was created over the central 50 mm of the specimen (to
simulate the area over which the axial and circumferential extensometers ob-
tain measurements in the laboratory) and axial and radial strain measurements
were monitored at these points (Fig. 6a). In indirect tension Brazilian disc
simulations, the axial stress was monitored at an imaginary crack within the
295 upper platen, and axial strain was calculated from the differing displacement
between two monitoring points located at the top and bottom of the specimen.
In addition, a FISH function was written to monitor the accumulation of tensile
and shear micro-cracks during loading.
In the uniaxial and triaxial compression simulations, no pre-load was ap-
300 plied as is customary in laboratory experiments. The axial loading was ap-
plied as a constant velocity of 0.01 m s−1 in the y-direction at the upper platen
whilst the lower platen was fixed in both the x and the y-directions. Although
this is much faster than the rate that is applied in the laboratory (axial strain
rate of 5 × 10⁻⁶ s−1 ), loading rate sensitivity analyses have shown that simu-
305 lated strengths converge to consistent values when the loading rate is less than
0.25 m s−1 Tatone (2014); Mahabadi et al. (2010). In the case of triaxial com-
pression testing, constant axial and confining pressures of equal magnitudes (i.e.
hydrostatic stress) were applied at the specimens upper and lateral boundaries,
and the models were taken to static equilibrium prior to the initiation of axial
310 loading.
3.2. Mechanical model calibration
The micro-parameters controlling the deformability (micro-Young’s modu-
lus (Em ), micro-Poisson’s ratio (νm ), normal stiffness (kn ) and shear stiffness
(ks )) and strength (micro-cohesion (cm ), micro-friction angle (φm ) and tensile
315 strength (σtm )) behaviour of the Voronoi micro-block assembly were estimated
using a multi-stage parametric analysis in which the model response was cali-
brated against the deformability (E, ν) and strength (c, φ, σt ) macro-mechanical
properties of the Thornhill Rock. The iterative trial and error process approxi-
mately followed the procedures outlined by Christianson et al. (2006); Kazerani
320 (2011); Gao and Stead (2014); Farahmand and Diederichs (2015); Stavrou and
Murphy (2018). A series of unconfined compression tests, triaxial compression
tests and indirect tensile Brazilian disc tests were carried out to calibrate the
Voronoi contact and block micro-properties to produce macro-properties repre-
sentative of the laboratory specimens.
14Property Units Value
Elastic Properties of Voronoi Blocks
Young’s modulus (Em ) GPa 27.90
Poisson’s ratio (νm ) - 0.22
Bulk modulus (Km ) GPa 16.61
Shear modulus (Gm ) GPa 11.43
Elastic Properties of Voronoi Contacts
Normal stiffness (kn ) GPa m−1 21235.36
Shear stiffness (ks ) GPa m−1 5308.84
Stiffness ratio (kn /ks ) - 4.00
Strength Properties of Voronoi Contacts
Cohesion (cm ) MPa 48.0
Friction angle (φm ) ◦ 27.0
Tensile strength (σtm ) MPa 8.0
Residual cohesion (cmr ) MPa 0.0
Residual friction angle (φmr ) ◦ 15.0
Residual tensile strength (σtmr ) MPa 0.0
Table 3: Calibrated micro-mechanical properties of the Voronoi blocks and contacts.
Property Units Laboratory UDEC GBM % Difference
Density (ρ) kg m−3 2250.00 2250.00 0.00%
Uniaxial compressive strength (UCS) MPa 50.80 50.69 0.22%
Young’s modulus (E) GPa 8.70 8.80 1.15%
Poisson’s ratio (ν) - 0.22 0.22 0.00%
Bulk modulus (K) GPa 5.18 5.23 0.97%
Shear modulus (G) GPa 3.57 3.61 1.12%
Tensile strength (σt ) MPa 4.20 4.22 0.48%
Cohesion (c) MPa 9.63 9.99 3.74%
Friction angle (φ) ◦ 49.73 48.00 3.48%
Table 4: Comparison of properties derived from laboratory characterisation testing and from
calibrated mechanical UDEC GBM simulations.
325 The calibrated micro-properties are tabulated in Table 3. A comparison be-
tween the mechanical properties obtained through laboratory characterisation
testing and the calibrated macro-mechanical properties from numerical simula-
tions are shown in Table 4. A good agreement is shown between all parameters,
with the difference between laboratory and numerical simulation values being
330 less than the sample variability seen in the laboratory (Table 1). To examine the
repeatability of the mechanical behaviour five different random Voronoi tessella-
tions were generated and tested, the results show good repeatability and prove
the mechanical behaviour is independent of the generated Voronoi tessellation
(Fig. 7).
335 3.3. Thermo-mechanical model set up
Following the successful mechanical calibration of Voronoi GBM simulations
to the mechanical behaviour of the Thornhill Rock in laboratory characterisa-
15a) b)
60
Laboratory
Voronoi Generation #1
50
Voronoi Generation #2
Voronoi Generation #3
Axial stress (MPa)
Voronoi Generation #4
40 Voronoi Generation #5
30
20
10
0
0 0.1 0.2 0.3 0.4 0.5 0.6 0.7
Axial strain (%)
Figure 7: a) Axial stress strain data from unconfined compression tests on five different
Voronoi generations of UDEC GBM models calibrated to the properties of the Thornhill Rock,
compared to a laboratory unconfined compression test on a specimen of Thornhill Rock. b)
UDEC GBM model after an unconfined compression test showing the formation of conjugate
shear planes and axial splitting.
tion testing, thermal properties were also added to the Voronoi GBM, and the
simulations were thermo-mechanically coupled.
340 UDEC allows the simulation of transient heat conduction, and the devel-
opment of thermally induced displacements and stresses. Using the explicit
calculation scheme, at every thermal timestep, equations for conductive heat
transfer (Fourier’s law) are solved numerically. Heat transfers across Voronoi
block contacts without resistance, provided that the blocks are in contact. The
345 thermal calculation procedure is coupled uni-directionally to the mechanical
stress calculations through the linear thermal expansion coefficients applied to
the Voronoi blocks Itasca (2014). The confining fluid surrounding the spec-
imen used to apply a confining pressure and thermal load during laboratory
testing is not included in numerical simulations, therefore thermal loading was
350 applied directly to the specimen and platens. The temperature for the start
of all thermo-mechanical simulations was initialised at 20 ◦C. Thermal loading
was then applied to the outer 1 mm of the specimen and platens in 1.5 ◦C incre-
ments. A thermal timestep of 3.0 × 10⁻⁵ s was chosen and cycled for 3,000,000
thermal timesteps at every 1.5 ◦C increment. Thermo-mechanical coupling was
355 set to occur every 1,000 thermal timesteps and 100,000 mechanical timesteps
(or when mechanical equilibrium was solved).
Whilst only one set of mechanical properties were applied to all Voronoi
blocks and contacts within the mechanical simulations, multiple different ther-
mal properties corresponding to the mineralogy of the Thornhill Rock were
16Mineral Linear thermal Thermal Specific heat Thornhill Rock
expansion conductivity capacity mineral
coefficient (k) (cp ) percentage
(αL ) Wm−1 K−1 J g−1 K−1 (%)
10−5 K−1
Quartz 1.60 7.69 698 65
Muscovite 1.16 2.32 760 15
Albite 0.54 2.31 709 10
Chlorite 0.90 5.14 600 5
Kaolinite 1.86 0.30 945 5
Table 5: Thermal properties of minerals, and mineral percentages for Thornhill Rock used in
thermo-mechanical simulations, obtained from quantitative XRD analysis.
360 applied in the thermo-mechanical Voronoi GBM simulations. This allows for
heterogeneous thermal loading to occur within the specimen. Whole rock min-
eral percentages for the Thornhill Rock were obtained from quantitative X-
ray diffraction (XRD) analysis and used to apply mineral percentages to the
thermo-mechanical simulations (Table 5). The minor mineral constituents were
365 not considered for thermal properties and the major mineral constituents were
rounded to the nearest 5% for implementation of thermal properties. Thermal
properties were randomly assigned to Voronoi blocks for different minerals in
the relevant mineral percentages (Fig. 8).
Numerical simulations were thermally loaded to the same temperatures as
370 used in laboratory testing (of 50 ◦C, 75 ◦C and 100 ◦C). Following the comple-
tion of coupled thermo-mechanical loading to the desired temperature, mechan-
ical loading of the specimens was undertaken as in laboratory experiments. A
confining pressure of 5 MPa was applied to the specimens and mechanical equi-
librium was reached prior to initiating axial loading as in the triaxial mechanical
375 calibration simulations.
3.4. Thermo-mechanical simulation results
The selected thermal loading rate of 1.0 ◦C min−1 in the numerical simu-
lations was marginally lower than the observed thermal loading rate in the
laboratory of ≈ 1.1 ◦C min−1 . However UDEC automatically over-rides and re-
380 duces the thermal timestep to maintain numerical stability dependent on the
edge lengths of the Voronoi generation. This resulted in a slightly increased
thermal loading rate. The temperature throughout each model was monitored
at a grid of history points over the central 50 mm of the specimen (equal to the
strain monitoring locations on Fig. 6). Fig. 9 shows the thermal loading in
385 numerical simulations at three different places within the specimen compared
to the heating command and thermocouple reading within the triaxial cell dur-
ing a laboratory experiment. It is observed that the thermal gradient across
specimens in the numerical simulations is less than 2 ◦C and that, apart from
the initial heating lag observed in the laboratory, the thermal loading rate in
17Quartz (65%)
Muscovite (15%)
Albite (10%)
Chlorite (5%)
Kaolinite (5%)
Figure 8: UDEC GBM with thermal material properties applied to Voronoi blocks in miner-
alogical percentages for the Thornhill Rock.
18390 numerical simulations is concordant with the thermal loading rate in the labo-
ratory.
100
90
80
Temperature (°C)
70
60
50 Laboratory thermocouple reading
Laboratory heating control command
40 UDEC 0.0 mm into specimen
UDEC 13.5 mm into specimen
30 UDEC 27.5 mm into specimen
20
0 1000 2000 3000 4000 5000 6000 7000 8000 9000
Time (s)
Figure 9: Monitoring of thermal loading throughout the model during numerical simulations
compared with the thermal loading during laboratory experiments. Representative laboratory
heating curve from a specimen tested at 100 ◦C (Specimen # 562).
The development of localised thermally induced stresses, and the propaga-
tion and accumulation of thermally induced micro-cracks was monitored during
thermal loading. Micro-cracking was monitored by tracking the development of
395 plasticity flags within the model (i.e. contacts reaching the irreversible plastic
state as described by the constitutive model), and also the normal load present
on those contacts, to deduce shear or tensile failure.
Fig. 10b shows the development of thermally induced micro-cracking within
numerical simulations of the Thornhill Rock with increasing thermal loading.
400 At 50 ◦C, only approximately 0.5% of Voronoi contacts within the model have
cracked (approximately 25 Voronoi contacts out of a total of 5,000 contacts in
the model). This increases to ≈ 2.5% of Voronoi contacts by 75 ◦C, and ≈ 6.0%
of Voronoi contacts by 100 ◦C. The micro-cracks are seen to develop randomly
throughout the specimen, with the exception of the outer 5 mm of the model on
405 the vertical edges, where horizontal displacement is free to occur and thermally
induced stresses do not develop. All thermally induced micro-cracks form in
tension and appear to have no preferred orientation, although further cracking
nucleates and propagates from already existing micro-cracks.
Micro-cracking is seen to initiate between 38 ◦C and 42 ◦C dependent on
410 Vorronoi generation (Fig. 11). Micro-cracks accumulate slowly initially up
to 60 ◦C, accumulating approximately linearly thereafter up to 100 ◦C. Upon
mechanical loading after heating to 50 ◦C, 75 ◦C and 100 ◦C, a reduction in
peak strength is observed (Fig. 12b & c). No change is observed in Young’s
19a)
σxx stress contours
-6.0 MPa
-4.0 MPa
-2.0 MPa
0.0 MPa
2.0 MPa
4.0 MPa
6.0 MPa
8.0 MPa
thermal
micro-crack
3 mm
b)
50°C 75°C 100°C
~ 0.5% ~ 2.5% ~ 6.0%
Percentage of Voronoi contacts micro-cracked thermal micro-crack
Figure 10: a) A subset of a numerical simulation thermally loaded to 100 ◦C showing x -
component stresses (σxx ). The left hand edge of the subset is the edge of the model. Negative
stresses are compressive. b) The amount of thermally induced micro-crack development in
numerical simulations thermally loaded to 50 ◦C, 75 ◦C and 100 ◦C.
20modulus with increasing thermal loading, and it is not possible to apply the
415 same methods for calculating the CI and CD thresholds as in the laboratory.
7
Percentage of Voronoi contacts thermally micro-cracked (%)
Voronoi generation 1
6 Voronoi generation 2
Voronoi generation 3
5
4
3
2
1
0
20 30 40 50 60 70 80 90 100
Temperature (°C)
Figure 11: Percentage of thermally micro-cracked Voronoi contacts with increasing thermal
loading. Simulations were run with three different random Voronoi generations.
21a)
100 20°C (peak stress = 98.33 MPa)
50°C (peak stress = 89.25 MPa)
90
75°C (peak stress = 86.64 MPa)
100°C (peak stress = 83.13 MPa)
Differential stress (σ1 - σ3) (MPa)
80
70
60
50
40
30
20
10 Laboratory
0
0 0.2 0.4 0.6 0.8 1 1.2 1.4
Axial strain (%)
b)
100 20°C (peak stress = 100.26 MPa)
50°C (peak stress = 90.24 MPa)
90
75°C (peak stress = 86.59 MPa)
100°C (peak stress = 81.94 MPa)
Differential stress (σ1 - σ3) (MPa)
80
70
60
50
40
30
20
10 UDEC GBM
0
0 0.1 0.2 0.3 0.4 0.5 0.6 0.7 0.8
Axial strain (%)
c) 105
Laboratory
σ1 - σ3 = -0.1924T + 101.46
100
Differential stress (σ1 - σ3) (MPa)
UDEC GBM
σ1 - σ3 = -0.2154T + 103.09
95
90
85
80
20 30 40 50 60 70 80 90 100
Temperature (°C)
Figure 12: a) Axial stress. vs. axial strain data for laboratory thermo-mechanical triaxial tests
on intact specimens of Thornhill Rock. b) Axial stress vs. axial strain data for UDEC GBM
simulations of thermo-mechanical triaxial tests. c) Comparison of peak strengths obtained
for specimens subjected to different amounts of thermal loading in the laboratory and in
numerical simulations.
224. Discussion
4.1. Laboratory testing
Our laboratory triaxial testing data show that increased thermal loading
causes reduced strength in the studied Thornhill Rock (Fig. 12c), in line with
420 experimental observations of strength reduction due to thermal loading in sim-
ilar lithologies (Siegesmund et al., 2018; Plevová et al., 2011; Zhou et al., 2016;
Zhang et al., 2013). The reduction in strength with thermal loading can be
explained through the formation of thermally induced micro-cracks. The het-
erogeneous thermal expansion of the mineral grains is large enough to allow
425 localised stresses to accumulate within the specimens, to a point at which inter-
granular tensile micro-cracking occurs Fredrich and Wong (1986). The CI and
CD thresholds are also seen to reduce with increasing thermal loading, pro-
portionally with the peak strength, confirming that the weakening is occurring
prior to mechanical loading due to thermal micro-cracking during the thermal
430 loading phase of the experiments. An increase in Poisson’s ratio is observed
with increasing thermal loading, however, little change is observed in Young’s
modulus. The increase in Poisson’s ratio must therefore occur due to increased
radial deformation. The pre-load mechanical conditions applied during thermal
loading were not hydrostatic. It is therefore likely that tensile micro-cracking
435 will preferentially occur parallel to the axial load, causing increased radial de-
formation.
Micro-structural analysis of specimens subjected to just thermal loading,
further validate the development of thermally induced micro-cracking. The
specimen not subjected to thermal loading except to drive off moisture (# 601)
440 shows largely planar contacts between quartz grains (Fig. 13a). Minor micro-
cracking is observed between quartz grain contacts, and at boundaries between
quartz grains and pore space, likely due to the specimen preparation. However,
the specimen loaded to 100 ◦C (# 602) shows considerable micro-cracking (Fig.
13b & c). Micro-cracking dominantly occurs at the edge of quartz grains, parallel
445 to grain boundaries, and micro-cracks have increased apertures compared to
those observed in Specimen # 601. Fig. 13d shows the same image as Fig.
13c in SEM-CL. Quartz grains are shown to have multiple phases under SEM-
CL, with authigenic overgrowths into the pore space occurring on the detrital
quartz. The micro-cracking is largely limited within these overgrowths, and
450 rarely propagates through the detrital grains, which may suggest heterogenous
thermal and mechanical properties within the crystallographic structure of the
quartz grains.
4.2. Numerical simulations
The thermo-mechanical triaxial simulations of the Thornhill Rock show com-
455 parable results to laboratory testing, with thermal loading alone causing pro-
gressive damage to specimens through the propagation and accumulation of
tensile micro-cracks. Micro-cracking initiates at approximately 40 ◦C, and apart
from the initial 15 ◦C the micro-cracks accumulate linearly with increasing tem-
perature up to 100 ◦C. This linear behaviour is expected, as assigned thermal
23a) b)
qtz
pore
qtz space
micro-
qtz
cracking
det mag HV HFW WD spot 100 µm det mag HV HFW WD spot 50 µm
vCD 1120 x 20.00 kV 267 µm 12.3 mm 4.0 vCD 1583 x 20.00 kV 188 µm 12.4 mm 4.0
c) d)
qtz qtz
micro-cracking qtz
qtz
authigenic
growth boundaries
det mag HV HFW WD spot 100 µm det mag HV HFW WD spot 100 µm
vCD 1027 x 20.00 kV 291 µm 12.4 mm 4.0 PMD 942 x 20.00 kV 317 µm 18.1 mm 4.0
Figure 13: a) BSE image of Specimen # 601 (oven dried at 40 ◦C). b) BSE image of Specimen
# 602 (thermally loaded to 100 ◦C). c) BSE image of Specimen # 602 (thermally loaded to
100 ◦C). d) SEM-CL image of Specimen #602 (the same view as BSE image shown in c)).
24460 properties were assumed and applied to be linear over the temperature range
tested. Fig. 10a shows a subset of the model contoured with the x -component
of the stress tensor (σxx ) after thermal loading to 100 ◦C. As expected, no hori-
zontal stresses occur at the model boundary (left hand edge) as no confinement
is yet applied, and horizontal displacement is possible as thermal expansion oc-
465 curs. However, further within the model, it can be seen that localised stresses
start to develop, with regions both in tension and compression, and the for-
mation of micro-cracks in areas of tension, where the tensile strength (σtm =
8.0 MPa) of the Voronoi contacts is exceeded.
When assessing the mechanical strength of specimens after thermal loading,
470 simulations of the Thornhill Rock show good agreement with the loss of strength
observed in the laboratory, with the existing thermally induced micro-cracks
acting as nucleation points for further progressive damage to occur (Fig. 12).
Overall, the thermo-mechanically coupled calibrated GBMs can capture
micro-cracking as a mechanism of progressive damage, reproducing the stress-
475 strain behaviour of laboratory specimens. Whilst good agreement is found be-
tween laboratory results and numerical simulations, the simulations are simpli-
fications and neglect other potential mechanisms of progressive damage such as
pore collapse and grain comminution. The simulations also neglect porosity and
heterogeneous mineralogical mechanical and thermal grain properties, which as
480 shown by microstructural analysis of laboratory specimens are likely important
factors in the progressive damage that occurs in laboratory specimens.
5. Concluding remarks
In this study we undertook elevated temperature laboratory triaxial test-
ing on specimens of fine grained sandstone. Increased thermal loading caused
485 reduced strength upon mechanical loading, attributed to progressive damage
through thermally induced tensile micro-cracking. Microstructural analysis
showed the thermally induced micro-cracking to occur along quartz-quartz grain
boundaries, and at boundaries between quartz grains and pore space, with
micro-cracking dominantly occurring within authigenic overgrowths of the quartz
490 grains. Thermo-mechanically coupled DEM GBM simulations were undertaken
representing the microstructure of the laboratory specimens. Numerical sim-
ulations showed the onset and development of tensile thermal intra-granular
micro-cracking due to the accumulation of localised thermal stresses from het-
erogeneous thermal properties of the polymineralic specimens. The thermal
495 micro-cracking caused reduced strength with subsequent mechanical loading,
with the strength reduction correlating well with laboratory results, showing
the ability of a DEM GBM to capture representative thermo-mechanical be-
haviour of brittle granular rock.
Interesting questions can be posed for future work regarding up-scaling the
500 results of this study. It is widely recognised that the strength of intact rock
decreases with increasing scale due to increased heterogeneity and the presence
of critically orientated micro-defects (Hoek and Brown, 1997; Tsur-Lavie and
Denekamp, 1982; Stavrou and Murphy, 2018). However, whether the increased
25heterogeneity and micro-defects may also allow for increased thermally induced
505 micro-cracking to occur, or whether micro-defects may inhibit the accumulation
of localised thermally induced stresses is currently unknown.
Acknowledgements
This study was part of an Engineering and Physical Sciences Research Coun-
cil (EPSRC) Industrial Cooperative Awards in Science & Technology (iCASE)
510 funded PhD in partnership with Arup (RCUK Studentship 1652177). Thanks
are given to the British Geological Survey for the use of the Rock Mechanics
and Physics Laboratory, and Calder Masonry for the supply of dimension stone.
The authors also thank Harri Wyn Williams for preparation of thin sections and
polished blocks, and Dan Morgan, Geoff Lloyd and Richard Walshaw for advice
515 on microstructural analysis.
References
AlpTransit . Project data - raw construction Gotthard Base Tunnel. Technical
Report; 2016.
Andersson JC. Rock Mass Response to Coupled Mechanical Thermal Loading.
520 Äspö Pillar Stability Experiment, Sweden. Ph.D. thesis; Royal Institute of
Technology, Stockholm, Sweden; 2007.
Andersson JC, Martin CD, Stille H. The Äspö Pillar Stability Experiment:
Part II— Rock mass response to coupled excavation-induced and thermal-
induced stresses. International Journal of Rock Mechanics and Mining Sci-
525 ences 2009;46(5):879–95.
Barton N. Thermal over-closure of joints and rock masses and implications
for HLW repositories. The Second Half Century of Rock Mechanics, 11th
Congress of the International Society for Rock Mechanics 2007;:109 –16.
Bauer SJ, Handin J. Thermal expansion and cracking of three confined water-
530 saturated igneous rocks to 800C. Rock Mechanics and Rock Engineering
1983;16(3):181–98.
Bauer SJ, Johnson B. Effects of slow uniform heating on the physical proper-
ties of the westerly and charcoal granites. In: Proceedings of the 20th U.S.
Symposium on Rock Mechanics. 1979. p. 7–18.
535 Bruner WM. Crack growth and the thermoelastic behaviour of rocks. Journal
of Geophysical Research 1979;84(B10):5578–90.
Chen Y, Wang CY. Thermally induced acoustic emission in Westerly Granite.
Geophysical Research Letters 1980;7(12):1089–92.
26Christianson M, Board M, Rigby D. UDEC Simulation of Triaxial Testing of
540 Lithophysal Tuff. In: The 41st U.S. Symposium on Rock Mechanics, 17-21
June, Golden, Colorado. 2006. .
Clark VA, Spencer TW, Tittmann BR. The effect of thermal cycling on the
seismic quality factor Q of some sedimentary rocks. Journal of Geophysical
Research 1981;86(B8):7087–94.
545 Collins BD, Stock GM. Rockfall triggering by cyclic thermal stressing of exfo-
liation fractures. Nature Geoscience 2016;9(5):395–400.
Damjanac B, Board M, Lin M, Kicker D, Leem J. Mechanical degradation
of emplacement drifts at Yucca Mountain—A modeling case study: Part II:
Lithophysal rock. International Journal of Rock Mechanics and Mining Sci-
550 ences 2007;44(3):368–99.
Farahmand K. Characterisation of rock mass properties and excavation dam-
age zone (EDZ) using a synthetic rock mass (SRM) approach. Ph.D. thesis;
Queen’s University; 2017.
Farahmand K, Diederichs M. A calibrated Synthetic Rock Mass (SRM) model
555 for simulating crack growth in granitic rock considering grain scale hetero-
geneity of polycrystalline rock. In: 49th US Rock Mechanics/Geomechanics
Symposium 28th June to 1st July, San Francisco, California. 2015. .
Fredrich JT, Wong Tf. Micromechanics of thermally induced cracking
in three crustal rocks. Journal of Geophysical Research: Solid Earth
560 1986;91(B12):12743–64.
Gao F, Stead D. The application of a modified Voronoi logic to brittle fracture
modelling at the laboratory and field scale. International Journal of Rock
Mechanics and Mining Sciences 2014;68:1–14.
Hawkes I, Mellor M. Uniaxial testing in rock mechanics laboratories. Engineer-
565 ing Geology 1970;4(3):179–285.
Heard HC, Page L. Elastic moduli, thermal expansion, and inferred permeabil-
ity of two granites to 350C and 55 MPa. Journal of Geophysical Research
1982;87(B11):9340–8.
Hoek E, Bieniawski ZT. Brittle Rock Fracture Propagation In Rock Under
570 Compression. International Journal of Fracture Mechanics 1965;1(3):137–55.
Hoek E, Brown E. Practical estimates of rock mass strength. International
Journal of Rock Mechanics and Mining Sciences 1997;34(8):1165–86.
Itasca . The Universal Distinct Element Code (UDEC), Ver. 6.0. 2014.
Jaeger J, Cook N, Zimmerman R. Fundamentals of Rock Mechanics. 4th ed.;
575 volume 1. Blackwell Publishing Ltd, 2007.
27Johnson B, Gangi A, Handin J. Thermal cracking of rock subjected to slow,
uniform temperature changes. In: Proceedings of the 19th U.S. Symposium
on Rock Mechanics, 1-3 May, Reno, Nevada. 1978. p. 259–67.
Kazerani T. Micromechanical Study of Rock Fracture and Fragmentation under
580 Dynamic Loads using Discrete Element Method. Ph.D. thesis; Ecole Poly-
technique Federale de Lausanne; 2011.
Lamp JL, Marchant DR, Mackay SL, Head JW. Thermal stress weathering
and the spalling of Antarctic rocks. Journal of Geophysical Research: Earth
Surface 2017;122(1):3–24.
585 Lan H, Martin CD, Andersson JC. Evolution of in situ rock mass damage in-
duced by mechanical-thermal loading. Rock Mechanics and Rock Engineering
2013;46(1):153–68.
Lisjak A, Grasselli G. A review of discrete modeling techniques for fractur-
ing processes in discontinuous rock masses. Journal of Rock Mechanics and
590 Geotechnical Engineering 2014;6(4):301–14.
Lorig LJ, Cundall PA. Modeling of reinforced concrete using the distinct ele-
ment method. In: Fracture of Concrete and Rock, SEM-RILEM International
Conference. Springer Verlag; 1989. p. 276–87.
Mahabadi O, Lisjak A, Grasselli G, Lukas T, Munjiza A. Numerical modelling
595 of a triaxial test of homogeneous rocks using the combined-finite discrete
element method. In: Zhao J, Labouise V, Dudt J, Mathier , J.F. , editors.
Rock Mechanics in Civil and Environmental Engineering. London: Taylor and
Francis Group; 2010. p. 173–6.
Meredith PG, Atkinson BK. Fracture toughness and subcritical crack growth
600 during high-temperature tensile deformation of Westerly granite and Black
gabbro. Physics of the Earth and Planetary Interiors 1985;39(1):33–51.
Neingo P, Tholana T. Trends in productivity in the South African gold mining
industry. Journal of the South African Institute of Mining and Metallurgy
2016;116(3):283–90.
605 Nicksiar M, Martin CD. Evaluation of methods for determining crack initia-
tion in compression tests on low-porosity rocks. Rock Mechanics and Rock
Engineering 2012;45(4):607–17.
Park JW, Park C, Ryu D, Park ES. Numerical simulation of thermo-mechanical
behavior of rock using a grain-based distinct element model. In: ISRM Re-
610 gional Symposium EUROCK 2015 - Future Development of Rock Mechanics.
October 7 - 10, Salzburg, Austria. 2015. p. 707–12.
Plevová E, Vaculı́ková L, Kožušnı́ková A, Daněk T, Pleva M, Ritz M, Simha
Martynková G. Thermal study of sandstones from different Czech localities.
Journal of Thermal Analysis and Calorimetry 2011;103(3):835–42.
28You can also read