Lafayette REGIONAL DEVELOPMENT PLAN - September 30, 2021 - Greater Lafayette IND
←
→
Page content transcription
If your browser does not render page correctly, please read the page content below
Lafayette
REGIONAL DEVELOPMENT PLAN
                            September 30, 2021
TABLE OF CONTENTS
4    Section I. Executive Summary
8    Section II. Defining the Region
10   Labor Shed
11   Section III. Current State of the Region
11   Pulse of the Business Community
12   A Commitment to Action from Planning
14   Investments in the Core
15   Investments in Residents
16   Investments in Business
19   A Track Record of Public and Private Partnerships
20   State of the Region in 2021
21   Economic Conditions
23   Population Characteristics
25   Education Attainment
23   Personal Per Capita Income, Labor Force Participation
26   Poverty
27   Housing Occupancy Status
28    Housing Units Totals and Types
31   Economy
32   Sector Growth Pre-COVID
33   Sector Impacts Pre-COVID
34   Average Quarterly Change in Employment
35   Projections for Growth
35   Occupations
36   Innovation
36   Business Indices
37   Technology Indices
37   Technology Indices, Purdue Patents
39   Section IV. Stake Holders and Execution
39   Greater Lafayette Regional Plan Implementation and Evolution
40   Greater Lafayette Regional Plan
41   Community Engagement, Leadership Engagement, Broad Based Outreach
43   V. Regional Vision
44   Greater Lafayette’s Strengths, Weaknesses, Opportunities and Threats
45   Telling the Greater Lafayette Story
47   VI. Trends
49   VII. Impact on Rural Communities
50   VIII. Goals and Objectives
53   IX. Alignment with the State’s Specific Economic Development Priorities
53   Semiconductor Infrastructure & Facilities (Quality of Opportunity)
54   Project Big Drum (Quality of Opportunity)
55   Regional Broadband (Quality of Opportunity)
56   Runway for Growth: LAF Airport Expansion (Quality of Place and Life)
57   Celebrating the Wabash (Quality of Place and Life)
58   A Place to Call Home: Greater Lafayette Regional Residential
     Development Plan (Quality of Place and Life)
60   Wabash River Greenway Plan (Quality of Place and Life)
62   A Co-Working & Maker Space to Build a Stronger Future (Innovation and
     Entrepreneurship)
63   Regional Innovation Center Development (Innovation and
     Entrepreneurship)
64   Quality of Life Business Incubator (Innovation and Entrepreneurship)
65   Innovation in the Animaltech Ecosystem (Innovation and
     Entrepreneurship)
66   INVets Partnership to Welcome Veterans (Talent Attraction and
     Development)
67   Smart Relocations: Regional Talent Attraction Project (Talent Attraction
     and Development)
68   Regional Destination Guide for Prospective Neighbors (Talent Attraction
     and Development)
69   Upskilling for Industry 4.0 (Talent Attraction and Development)
70   Supporting Our Families
71   Appendix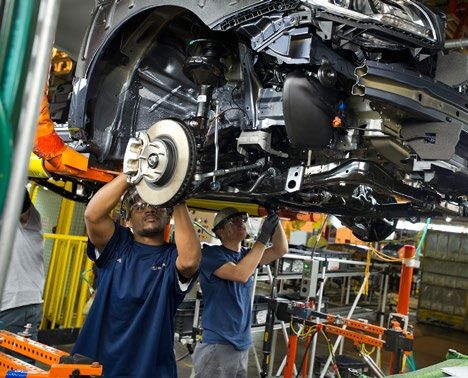
Section I

    EXECUTIVE SUMMARY
    The Greater Lafayette Region is writing Indiana’s next great story! Growth has        The Greater Lafayette Region demonstrates key assets that are helping continue to
    been accelerating over the past decade earning the region national acclaim,           grow its population and economy:
    the Indiana Chamber of Commerce’s 2021 Community of the Year Award,
    and a reputation as one of the Midwest’s smartest working regions. Anchor               ¡ A 2.87% increase in the labor force over the past decade, compared to
                                                                                                 Indiana’s 2.0% increase
    institutions, like Purdue University and Ivy Tech Community College, continue to
    expand, driving innovation and providing outstanding educational opportunities          ¡ A median household income of $59,563 versus the state’s median of $57,617
    to the region’s residents and workforce. Private corporations and local                 ¡ Higher education attainment rates than state averages
    communities are retaining talent, considering expansion, and investing in the           ¡ A diverse economy with manufacturing, education, and healthcare as
    infrastructure, amenities, and services needed to support, sustain, accelerate               strengths
    the Greater Lafayette Region’s growth.
                                                                                          We also recognize we have room for improvement, as we seek to address:
    The region’s existing companies, and those who are considering locating here,           ¡ Lower rates of per capita income
    need a workforce ready to meet their needs for technically-savvy, skilled talent.       ¡ A lack of new housing development across the region, which is limiting our
    This plan shares how the Greater Lafayette Region plans to use high-tech tools               ability to attract new residents
    to attract new workers and develop new affordable housing options for the mid-          ¡ An aging housing stock, with costs creating financial burdens for owners
    skill workers in highest demand, both today and into the future. All this will be       ¡ An aging population that drives a need for replacement workers
    done while revitalizing our communities by leveraging the richness and diversity
    of our natural and cultural amenities.
                                                                                          Big Goals
    The Greater Lafayette Region is home to a growing population of over 264,500          The plan is defined by a set of measurable and sustainable goals, which is outlined in
                                                                                          Section VIII. Among others, our goals include:
    residents and a labor force of over 133,000. Tippecanoe County, with its cities of
    Lafayette and West Lafayette (the home of Purdue University), accounts for 70%           ¡ Growing our population at a rate 150% faster than the previous decade
    of the region’s population. It is also the economic, social, and cultural center of      ¡ Increasing the labor force by 8,000 workers by 2030
    the region.                                                                              ¡ Increasing housing stock 10% over the next decade
                                                                                             ¡ Accelerating the adoption of digitization/Industry 4.0
    Lafayette and West Lafayette have made strategic investments that have been              ¡ Doubling the number of visitors to our region annually
    recognized nationally and made the cities the region’s growth centers. More
    importantly, the communities are attracting new residents and jobs, resulting in         ¡ Increasing labor force participation rates to 64%
    a 7.8% growth rate over the last decade, outpacing the state’s impressive 4.7%           ¡ Increasing per capita personal income to higher than the state’s
    growth rate. Now, growth is beginning to pay dividends for our region’s rural
    communities, as people start to look for new work, housing, and entertainment         To accomplish these goals we are seeking $50M in matching funding from the
    options.                                                                              State of Indiana through its Regional Economic Acceleration and Development
                                                                                          Initiative (READI).

4   Greater Lafayette Regional Development Plan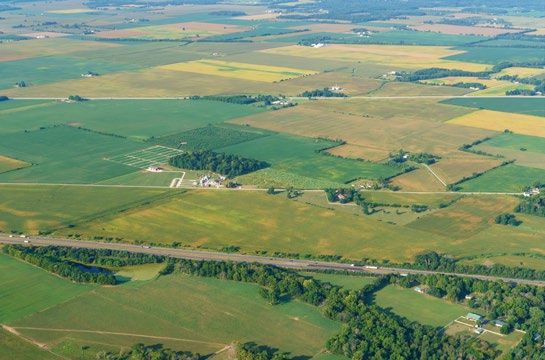
A full analysis is included later in this plan that includes a look at the region’s       Unprecedented Collaboration
Strengths, Weaknesses, Opportunities, and Threats (SWOT). Through this planning           The region’s community leaders recognize collaboration is critical to foster
process, and others, we are defining our priorities and investing in them. Hundreds       further growth. This regional development plan represents unprecedented
of regional business and industry leaders participated in this process, weighing in on    collaboration between the urban and our more rural parts of our
the region’s top priorities through interviews and surveys.                               community. County commissioners, mayors, local economic officials,
                                                                                          and independent organizations like the Wabash Heartland Innovation
An Aligned Portfolio of Regional Projects                                                 Network (WHIN), Purdue University and Ivy Tech, met for the first time
County commissioners, mayors, local economic developers, Wabash Heartland                 as region-wide collaborators in May. Each agreed to a memorandum
Innovation Network (WHIN), Purdue, and Ivy Tech leaders met for the first time in         of understanding, which designated the Greater Lafayette Commerce
May, 2021 to discuss the READI program. Working together, they selected the Greater       Community and Economic Development Foundation as the entity through
Lafayette Commerce Community and Economic Development Foundation as the                   which the collaboration will take place.
coordinating organization for the region They also created a Board of Directors for
the Greater Lafayette Region. Doing so ensures broad regional collaboration and           The regional development plan’s board of directors includes six county
business and industry engagement.                                                         commissioners, six mayors, six local economic development leaders,
                                                                                          and representatives from Purdue and Ivy Tech. The board also formed
Through broad community outreach we received a significant level of interest and          a Working Group that included the local LEDOS, local city development
identification of projects and programs that could support talent attraction, quality     directors, as well as additional representatives from GLC, WHIN, Purdue
of place and growth. Forty-five projects are included in our Regional Development         University, Purdue Research Foundation, and Ivy Tech Community College.
Plan submittal. In total these projects can leverage $2.2 billion in private investment   This governance model has helped build relationships between the
with $100 million in local match (to date) with $139 million in requested READI or        various county and city leaders that crafted the vision and steered the
other state funds.                                                                        development of this plan.

Sustainability of the Plan
As has been emphasized by the state, sustainability was a key consideration for                                              2021
the board as it reviewed the projects proposed herein. The region’s leaders are
also working to refine the organizational structure that will enable continued                                     COMMUNITY
collaboration as a regional development authority, a regional economic development
partnership as a 501c3, or the creation of a regional planning commission, with a
                                                                                                                   OF THE YEAR
Certified Economic Development Strategy (CEDS) through which EDA and other                                           AWARD
federal funding may be attained.
                                                                                                                    INDIANA
                                                                                                                   CHAMBER

                                                                                                                       Greater Lafayette Regional Development Plan       5
BOARD OF DIRECTORS Additional supporting representatives and staff
Our thanks to each board member, and the supporting staff, for their insight, Dennis Carson - City of Lafayette
commitment, and contribution to this regional effort. Erin Easter - City of West Lafayette
Cristina Farmus - Purdue University
Clearly, the vision and an action plan, align with the IEDC’s priorities and goals Paul Moses - Greater Lafayette Commerce
of growing the state’s population, attracting new talent, and driving economic Trent Fletcher - Greater Lafayette Commerce
growth in the State of Indiana. We believe it is truly a plan that will make us Jim Olds - Greater Lafayette Commerce
“Greater.” Andrea Schwartz - Ivy Tech
Johnny Park - Wabash Heartland Innovation Network
Mike Freeland - Benton County Commissioner
Bill Brown - Carroll County Commissioner Greater Lafayette Region-readi project map
Tom Murtaugh - Tippecanoe County Commissioner RE GIONA L PR OJEC TS
Jim Davis - White County Commissioner 2 6 18 36
43
Monon
Clay Andrews - Warren County Commissioner 3
4
10
11
22
28
39
40
Brenda Hardy - Fountain County Commissioner 5 15 32 44
6
26
Monticello
Duane Roderick - Mayor, City of Attica Re ynolds
30
13
Brad Crain - Mayor, City of Covington
Anita Werling - Mayor, City of Delphi 6
Tony Roswarksi - Mayor, City of Lafayette Fowler Broo ks to n
16 29
Cathy Gross - Mayor, City of Monticello 12
Delphi
John Dennis - Mayor, City of West Lafayette Boswell
25
Battleground
Paul Jackson - Benton County Economic Development We st Laf ayet te
Jake Adams - Carroll County Economic Development Corporation 7
42
9
6
8 33 34
Laf ayet te
1
Brent Bauerband - Fountain County Economic Development 45
35 37 38 41
14 24
Scott Walker - Greater Lafayette Commerce (Chair) Williamsport
27 31
Ben Dispennett - Warren County Advantage (Vice Chair) 21
23
6
17 20
Randy Mitchell - White County Economic Development Corporation Attic a
David Broecker - Purdue University/PRF
Aaron Baute - Ivy Tech Community College 6
Covingto n
Veedersburg
6 Greater Lafayette Regional Development Plan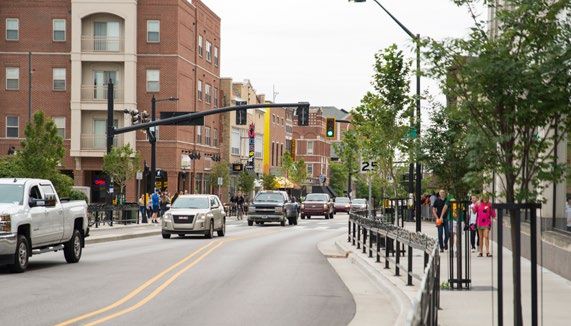
The Greater Lafayette Region is Indiana’s next great story. Growth has been
                                         accelerating over the past decade earning the area its reputation as one of the
                                         Midwest’s smartest working regions. Anchor institutions, like Purdue University
                                         and Ivy Tech, continue to expand, driving innovation and providing outstanding
                                         educational opportunities to the region’s workforce. Private corporations
                                         and local communities are retaining talent, considering expansion, and eager
                                         to welcome new residents. This regional development plan is our collective
                                         blueprint for investing in the infrastructure, amenities and services needed to
                                         support, sustain, and accelerate the Greater Lafayette Region’s growth.

                                         Our existing companies, and those who are considering locating here, need a
                                         workforce ready to meet their needs for technically-savvy, skilled talent. This
                                         plan shares how the Greater Lafayette Region plans to use high-tech tools to
  “This is a community with a long-      attract new workers to our community, develop new affordable housing options
                                         for the mid-skill workers in highest demand, both today and into the future. All
standing tradition of collaboration      this will be done while revitalizing our communities by leveraging the richness
                                         and diversity of our natural and cultural amenities.
and community involvement                        between
                   The Greater Lafayette Region is home to a growing population of over 264,500
   municipalities,residents
                    companies                        and
                             and a labor force of over 133,000. Tippecanoe County, with its cities of
                   Lafayette and West Lafayette (the    home of Purdue University), accounts for 70%

  institutions to solve
                   the region. problems.”
                   of the region’s population. It is also the economic, social, and cultural capital of

			 W. David Lafayette
                   Lasater,          Non-Profit
                              and West Lafayette have made  CEOstrategic investments that have made
                                         them the growth centers for our region. They have created an award-winning
                                         environment through strategic investments. More importantly, the communities
                                         are attracting new residents, resulting in a 7.8% growth rate over the last decade,
                                         outpacing the state’s impressive 4.7% growth rate. Now, growth is beginning to
                                         pay dividends for our region’s rural communities, as people start to look for new
                                         work, housing, and entertainment options.

                                         The Greater Lafayette Region demonstrates key assets that can continue to grow
                                         our population and regional economy:
                                            ¡ An increase in labor force over the past decade of 2.87% versus Indiana’s
                                                2.0%
                                            ¡ A median household income of $59,563 versus the state median income
                                                                           Greater Lafayette Regional Development Plan         7
Section II

    DEFINING THE REGION
    The Greater Lafayette Region includes most     as the fiscal agent for Indiana’s Technology
    of the contiguous counties that make up        Corridor (ITC) to receive previous IEDC
    the Greater Lafayette labor shed, which        grants, and more recently the State of
    is centered around Tippecanoe County.          Indiana’s certification of Greater Lafayette
    The county governments from Benton,            as a 21st Century Talent Region, and other
    Carroll, Fountain, Tippecanoe, Warren, and     workforce development, quality-of-life and
    White counties, as well as the Monticello,     business retention and recruitment efforts.
    Attica, Covington, Delphi, Lafayette and
    West Lafayette city governments, have
    worked together to create this Regional
                                                   Geographically, the Greater Lafayette
                                                   Region stretches east and west of the I-65                                           21 ST
    Development Plan and are pleased to submit     corridor, midway between Indianapolis
                                                                                                               CHICAGO              CENTURY
                                                                                                                                  TALENT REGIO
    it through the Greater Lafayette Community     and Chicago. Its economy thrives based                                                     N
    and Economic Development Foundation.           largely on the advanced manufacturing
                                                   sector, which employs more than 20,000
    Past regional collaborative efforts have       people. Purdue University and its robust
    included those led by the Lilly Endowment-     research and development, corporate
                                                                                                   WABASH                INDIANAPOLIS

    funded Wabash Heartland Innovation             relationships, and entrepreneurial efforts     HEARTLAND
    Network (WHIN) and the regional economic       are also among the region’s (and the           INNOVATION
    development group known as Greater             State of Indiana’s) economic drivers and        NETWORK
    Lafayette Economic Alliance.                   the largest employer. Combined with the
                                                   rich agricultural heritage that anchors the
    Greater Lafayette Commerce (GLC), a            surrounding counties, the Greater Lafayette
    not-for-profit local economic development      Region offers a diverse and vibrant quality
    organization and chamber of commerce           of life. From rural and small towns to the
    serving several governmental units, as         more urban college-town experiences of
    well as local businesses and other regional    downtown Lafayette and West Lafayette,
    stakeholders, has led the Greater Lafayette    this part of the Midwest shines as one of
    Region READI effort. GLC has historically      the smartest working communities in the
    led similar collaborations, including acting   United States.

8   Greater Lafayette Regional Development Plan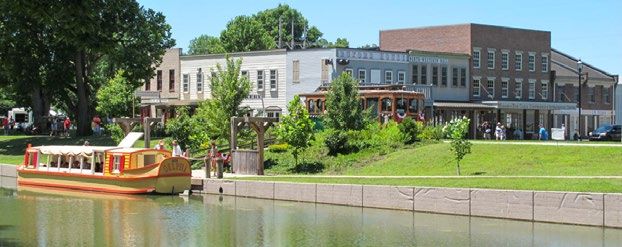
⁶
              COUNTIES
                                  BENTON

                                  WARREN
                                                WHITE

                                              TIPPECANOE
                                                             CARROLL

 20K ADVANCED
  MANUFACTURING
                                   FOUNTAIN

    EMPLOYEES

                   10
267K
Regional
                  PARTICIPATING
                  COMMUNITIES

POPULATION

                                                           Greater Lafayette Regional Development Plan   9
Labor Shed
     About half of the total number of regional workers both live and work within the region. The
     remaining half is almost evenly divided into those that live in the region but commute out
     for work, or live outside the region and commute in. This suggests the region is a job center   Inflow/Outflow Job Counts in 2018
     itself, which is consistent with the presence of Purdue University in Tippecanoe County.

     The Greater Lafayette Region’s largest private-sector employers include world leaders
     in advanced manufacturing, such as Subaru of Indiana Automotive (SIA), Caterpillar, GE
     Aviation, Saab, Harrison Steel, Wabash National Corporation, and many others. Greater
     Lafayette is also home to several high-growth industry clusters, including advanced
     materials, biomedical and biotechnology. Defense and security, information technology,
     telecommunications, energy, and arts and entertainment are growing rapidly, as well. These
     and other innovation-driven enterprises are driving growth in the region that positions it to
     compete globally.

     Combined with the diversity of the arts, guest lectures, cultural and BIG10 sporting events
     on and around Purdue’s campus, the region features major recreational amenities. Among
     the many others, these include Indiana Beach, the Badlands Off-Road Park, Prophetstown
     State Park, Lake Freeman and Lake Shafer, as well as the natural beauty of the Wabash River
     valley, all of which draw hundreds of thousands of visitors annually.

     To ensure the Greater Lafayette Region’s plan is strengthened by diverse perspectives, a
     wide range of stakeholders are actively engaged in this process beyond the governmental          38,502 Employed in Selection Area, Live Outside
     entities already mentioned, including Purdue University, Purdue Research Foundation, Ivy         75,139 Employed and Live in Selection Area
     Tech Community College, the Wabash Heartland Innovation Network, and local economic              38,977 Live in Selection Area, Employed Outside
     development organizations from each participating county. Through this sustained
     collaboration, the Greater Lafayette Region will continue to grow its population, attract,
     educate, and expand its workforce, and draw new businesses to Indiana. All this will
     happen while improving the quality of life for the diverse range of people who make us
     greater, those who learn, live, and work in Greater Lafayette.

10   Greater Lafayette Regional Development Plan
Section III
CURRENT STATE
OF THE REGION 2021 Greater Lafayette Business
Retention & Expansion Report
1%
Overview 2%
2%
We have learned through previous planning efforts and ongoing community dialogue 15%
the region’s main challenges include continuing to attract more company investment 3%
and talent to the area. Small business is important to our local economy, and we 5%
also compete globally with much larger metropolitan areas for jobs and other private
corporate investment. Some have said we compete out of our class, but we have had
great success in recent years as foreign companies look to expand into the U.S. market 7% 13%
and domestic companies seek new sources of quality talent. We recognize that we
are competing with other regions around the country for talent and that people are
attracted to regions that support a higher quality of life. Infrastructure and amenity 7%
upgrades have been prioritized to support the population growth necessary for
corporate and community expansion. 9% 13%
9% 10%
Pulse of the Business Community
Greater Lafayette Commerce interviewed two dozen business leaders and developed ¢ Quality of Life
¢ Sense of Community Support
a summary report of the resulting analysis in early 2021 titled, Business Retention ¢ Purdue University ¢ Local School Corporations
and Expansion Report. It showed leaders, among other things, appreciate the region’s ¢ Workforce ¢ Diversity
¢ Location Between Indianapolis and Chicago ¢ IU Health Arnett and Franciscan
sense of community and trust the teams working to make the region greater. ¢ Housing
¢ Local Officials/Leadership Abilities
¢ Greater Lafayette Commerce ¢ Mental Health Awareness
The survey also showed quality-of-life, good schools, and public amenities are key to ¢ Community Growth/ Proactive ¢ Lower Cost of Living
economic growth, as well as talent attraction and retention. ¢ Pro-Manufacturing ¢ Reasonable Tax Structure
¢ Access to I-65
Greater Lafayette Regional Development Plan 11Such key feedback from business leaders and the community has prompted the
Greater Lafayette Region to strongly engage with the Wabash River Enhancement
Corporation (WREC), a consortium including Lafayette, West Lafayette, Tippecanoe
County, and Purdue University. Their first project, completed in 2020, was the
Riverfront Promenade, which overlooks the Wabash River. WREC has since
completed a series of Master Plans for the other counties and communities in the
region along the Wabash River corridor.
A Commitment to Action
from Planning
The tremendous progress of the last five years is a direct result of planning which
began in the early 2000s when community leaders recognized Greater Lafayette STATE OF
THE AR
MANUFACTUTRIN
was uniquely positioned to compete globally for talent and company investment.
That is when Greater Lafayette Vision 2020 was created. In support of this
believe, six local community economic development organizations came together G
and formed Greater Lafayette Commerce, which leveraged and streamlined FACILITIES
the region’s community and economic development work. The Lafayette, West
Lafayette, and Tippecanoe County governments, as well as Purdue University, and
Ivy Tech Community College were inspired to work alongside Greater Lafayette
Commerce and its regional partners. Together they began to address critical
issues and economic development in a more comprehensive manner that built on
each other’s strengths and expertise.
In 2011, Greater Lafayette Commerce and its community partners launched the
Greater Lafayette Good to Great Plan, with a renewed emphasis on quality of
life. This long-term vision had a dramatic impact, in that it helped convince GE
Aviation to invest ($100M) in a state-of-the-art manufacturing facility, producing
LEAP engines, the next generation of jet/airline engines utilized by both Boeing
and Airbus. Since then, the community has been able to position itself as an
aerospace hub with new investments by SAAB ($37M) and Rolls Royce ($3.5M),
in a dedicated Aerospace focused research park ($30M). That park will soon also
be home to a new Hypersonics Research Facility ($41M), as well as a Hypersonics
Ground Test Center.
12 Greater Lafayette Regional Development PlanSIA (Subaru of Indiana Automotive), Wabash National, Arconic, Dana Fairfield, Nanshan, and Caterpillar, are among numerous other local employers. Together
they form a high-technology, R&D, and advanced manufacturing base that employs tens of thousands of local workers. They provide good-paying jobs and draw
capital and talent from around the world, creating wealth locally, regionally, and elsewhere across the state of Indiana.
2021 Greater Lafayette Business Retention & Expansion Report
Are there any reasons this community would not be
considered for future expansion? If yes, why?
4%
8%
8% 23%
33% 8%
63%
15% 23%
15%
¢ Economic Competition ¢ Mid-High-Level Housing
¢ Yes ¢ No ¢ Don’t Know ¢ Housing in General ¢ Decreased Skilled Workforce
¢ Federal Legislation NOT Locally Driven ¢ Electricity Costs
¢ Increase in Rail Cost
More than two-thirds of those polled say they saw no barriers to possible local expansion. Among the minority indicating possible barriers, available housing and skilled workforce topped the list of local variables.
Greater Lafayette Regional Development Plan 13Investments in the Core
As a growing community, we must keep pace with demand but more
importantly, we know that potential residents, businesses, and visitors
have many choices on where and when to locate. To that end, the Cities
of Lafayette and West Lafayette, and Tippecanoe County have made
PARK &
significant improvements in the last five years totaling $873M. A
significant portion was dedicated to the improvement of the communities’
parks and recreation system. Similarly, the local school corporations have
invested more than $355M in enhancement and expansion projects to RECREATION
accommodate the new families drawn to the market by the new corporate IMPROVEMEN
expansion and quality of life improvements. TS
Together, the schools buildt the Greater Lafayette Career Academy (GLCA).
GLCA is a state-of-the-art education facility. It provides hands-on training
to high school students preparing for college, a career, and the workforce
in a broad array of career fields, from engineering and nursing, to computer
science, advanced manufacturing, fire & rescue, and others.
Other notable investments were made in Lafayette’s Columbian Park, a
regional destination.
These include:
¡ Loeb Stadium – After nearly 80 years this baseball-only facility
has been replaced with a $22M multi-purpose/sports stadium
featuring state of the art playing surfaces, equipment, and facilities Amenities are consistently being upgraded and added that include the Matt Racer water
that will seat 2,500 people, and include a children’s play area, full slide and Aqua loop which was a $3.8M investment.
concessions, fan experience retail, and corporate suites. ¡ Other key improvements include a complete renovation of Memorial Island, which pays
¡ Lafayette has one of Indiana’s oldest accredited zoos, where recent homage to our veterans. The redevelopment of the fishing lagoon/pond, paddle boat
and improvements included a warm-weather Penguin exhibit for a experiences, and a new $6.9M amphitheater. Lafayette is also bringing back its beloved
$2.7M investment plus other investments to fulfill the Zoo’s Master carousel, which will be housed in an enclosed in a $2M facility for year-round enjoyment.
Plan creating an experience that features animals, their habitats,
and conservation efforts underway around the world.
All of these improvements have been very well received driving increased visitors from the
¡ Tropicanoe Cove is one of the region’s water park destinations. community and from outside the region.
14 Greater Lafayette Regional Development PlanInvestments in Residents
Greater Lafayette has also emerged as a leader in Workforce Development programming
that encourages collaboration between employers to facilitate both face-to-face and virtual
recruiting efforts. The region also leads the way with new interactive K-12 programs, like
Robotics in Manufacturing Summer Camps, CoderDojo, and Manufacturing Week that
encourage students across the entire region to explore careers in manufacturing, the trades,
and high-tech disciplines. Combined with minority and veteran-focused programs, the region
is set up to both expand its current workforce and attract new workers.
Both Lafayette and West Lafayette have also invested millions in the ongoing redevelopment
of their downtowns. Lafayette’s downtown development plan has so far resulted in more than
$50M worth of new private investment. The results include 350 new housing units and 25,000
square feet of commercial/retail/office space and at least $60M more is planned. The city’s
Five Points Plan is attracting a lot of interest to a difficult-to-develop area with a couple of
new projects already in the works.
Key to supporting this growth and development is strategic investments in infrastructure
such as roads, water, sewer and industrial parks.
Greater Lafayette Regional Development Plan 15support these endeavors. This pilot program in Lafayette and Fort Wayne will
Investments in Business be a model for other programs across the state and has allowed MatchBOX to
offer a myriad of technical assistance programs to support entrepreneurship
In response to the pandemic, the various regional governments developed multiple and small business development creating and retaining Indiana’s creative and
programs to support the local businesses. Lafayette, West Lafayette and Tippecanoe tech talent that can be replicated regionally and even statewide.
County each made available nearly $1M of special pandemic funding in the form
of forgivable loans, or grants, to 95 small businesses that had seen their sales and Growth has been so robust in the region over the last three to five years, it
revenue significantly decline. Greater Lafayette Commerce created numerous technical is challenging to surmise the totals invested. On top of the aforementioned
assistance programs to help small businesses navigate what the uncharted territory and investments, another big move that fostered both public and private
find ways to pivot and sustain and even grow their business. This included direct grants investment was West Lafayette’s State Street Project, a partnership between
to support small businesses, Fresh Air Eats, and other programs. the city and Purdue University.
The City of Lafayette helped start one of Indiana’s first coworking studios, MatchBOX, The State Street Project enabled the redevelopment of State Street
to support local tech and innovation. Today, MatchBOX Coworking Studio has nearly through the heart of Purdue’s campus. This project included the complete
300 members and offers a variety of programs, events, and technical assistance reconfiguration and reconstruction of State Street, putting an emphasis on
to encourage and support entrepreneurs of all types. This has been leveraged with pedestrian traffic and alternative forms of transportation. Amenities included
partnerships with Purdue University, including alliances with their programs such as the sidewalk and streetscape improvements with new plazas and public gathering
Purdue Foundry entrepreneurial program and the Purdue Railyard Coworking space. spaces. Also constructed were dedicated cycle lanes, along with basic
infrastructure including water and sewer. The improvements were the first
With local state legislators, Senator Brian Buchannan and Representative Sharon Negele step in a 30-year, $1.2B transformation of West State Street and Discovery Park
(Lafayette), MatchBOX’s co-founders championed legislation for a pilot program, the District. They also spurred the development of the Aerospace-focused research
Entrepreneur and Enterprise District, which leverages local incentives and state funds to park, which is adjacent to Purdue University Airport, just west of U.S. 231.
16 Greater Lafayette Regional Development PlanAll of this complements the world-renowned rocket science
and other high-pressure combustion work being done at
Maurice J. Zucrow Labs. It has also led to the recruitment of
new companies to the region and the expansion programs
led by companies like GE Aviation, Rolls Royce, and Saab.
The improved infrastructure enabled new privately funded
housing and commercial development. Among them were
Hub on State ($57M), The Rise ($80M), Campus Edge ($54M),
HiVine ($12M), State Street Corner/Target/Munzier Building
($10M) and Margerum City Hall ($16M). The City of West
Lafayette also recently opened a new $34M Wellness Center
that supports the area’s rapidly growing workforce and area
citizens.
Other development activity, which includes Continuum,
SUPPORTING
a private $42M development that includes 250 luxury BUSINESSES
apartments and 15,000 square feet of street-level
commercial space; Aspire, an $85M, 800-bed privately & HOUSING
led student housing development; Convergence, a five-
story, $32M office complex that also includes retail and
co-working, a new $20M production facility for Schweitzer
Engineering Labs; and Provinance, a $130M private
investment developing single-family townhomes and retail
spaces.
Other major investments include the redevelopment of the
Tippecanoe County Fairgrounds ($24M) and a Master Plan
for future industrial development and job growth in the
decades to come along the new Hoosier Heartland Highway.
The City of Lafayette and Tippecanoe County have created a
joint tax increment finance (TIF) district for investment and
infrastructure in the area, including a proposed $9M regional
sewer district that will undoubtedly spark future investment
in that part of Greater Lafayette.
Greater Lafayette Regional Development Plan 17“Greater Lafayette is an amazing place
to live, lots of job opportunities with
large corporations, connection with a
Big Ten university and a community that
supports local and small businesses.”
Keri Jeffers, Event Planning Professional
18 Greater Lafayette Regional Development PlanA Track Record Of Initially funded through the use of tax increment
finance (TIF) dollars, corporate entities stepped up to
The coalition’s existence and the partners’ proven
ability to collaboratively address challenges also
Public and Private lead individual developments that will re-fund the TIFs. enabled the community to lobby the state legislature
Partnerships Along the west end of state street, a new TIF district
was created. A private entity, the Purdue Research
to modify the use of the local Innkeeper’s Tax revenue.
For more than a decade a portion of that revenue had
Foundation (PRF), fronted the funds so infrastructure been committed to developing a new state park. Now
Both private and public sectors have come together as work could begin. PRF will recover the investment over that the park is well established, the community is
equal partners to create synergies that would not be time as the increment is created in the TIF by privately- committing 20% of the local innkeepers tax revenue
possible alone. The public sector’s role is to provide the led developments. An existing TIF district funded the to support Greater Lafayette’s marketing efforts.
vision and guidance for investment and growth, along City of West Lafayette’s $60M commitment to the State
with the funding necessary to support that growth. Street project. That mature TIF had already secured Another shining example of public/private partnership
There are many plans, like the Lafayette Downtown enough new property tax increment to meet the city’s is Lafayette’s Downtown Streetscape effort ($15M).
Development Plan, the Hoosier Heartland Development half of the project. Projects completed included enhancements for
Plan, the Five Points Development Plan, and the Wabash
pedestrian traffic, sidewalk improvements, art
River Enhancement Plan, that are all examples of this. Other examples of public-private development include installations, and outdoor dining facilities amenities,
The West Lafayette and Purdue University State Street housing developments in both downtown Lafayette as well as roadway improvements. Ultimately,
Project highlights how this works. and West Lafayette. The Marq ($15M), Pullman Station property owners shared in the cost of the sidewalk
($12M), and The Press ($5M) are urban projects and improvements made in front of their buildings, with
The State Street Corridor is the major connector that others are currently under development, as well. LUNA the majority of the improvements being paid by TIF
runs through the heart of West Lafayette and Purdue ($20M), The HUB, RISE, The Ellsworth ($15M), and other investments.
University’s campus. The $120M effort transformed developments, including a new urban Target store have
State Street. For decades it had been a four-lane created housing and shopping that accommodates
vehicle-only state highway that created a barrier Purdue’s rapid growth. The cities of West Lafayette
between the north and south side of Purdue’s Campus. and Lafayette supported these developments using TIF
The project reduced automotive lanes and integrated funds.
other modes of transportation. It included public
transit bus pull-offs, wider sidewalks and bike paths, Other significant partnerships include the development
increasing safety and outdoor seating for local retailers of the Greater Lafayette Marketing Coalition. A truly
and restaurateurs. At the same time, it enabled regional effort, this group has already invested nearly
upgrades to the water and sewer infrastructure and set $1M researching and developing a new brand for the
the stage for the redevelopment of West State Street region. Elements of the new brand are used in the
and Discovery Park District. The effort has led to both graphic layout of this plan. They compliment, refine,
additional privately developed housing and office and expand Greater Lafayette’s ability to market itself.
facilities, as well as helped expand the community’s
parks, walking, and bike trail system.
Greater Lafayette Regional Development Plan 19State of the Region 2021
The following pages describe the demographic and economic state of the Greater Lafayette region.
Demographics
COUNTY TIPPECANOE WHITE CARROLL FOUNTAIN BENTON WARREN REGION INDIANA
Total Population 2020 186,251 24,688 20,306 16,346 8,741 8,265 264,597 6,785,528
Population Growth or 7.8% 0.2% 0.7% -5.2% -1.3% -2.9% 4.9% 4.7%
Decline 2010 to 2020
Households 2019 70,526 9,879 8,002 6,974 3,432 3,357 102,170 3,319,010
High School Diploma or More 91.6% 88.8% 88.4% 89.0% 89.9% 92.0% 90.8% 88.8%
Percent of Adults 25+ 2019
Bachelor's Degree or More 38.7% 16.4% 16.7% 14.9% 16.1% 19.4% 31.2% 26.5%
Percent of Adults 25+ 2019
Source: STATS Indiana, using data from the Indiana Department of Workforce Development
The Greater Lafayette Region varies in population growth and demographic trends. Notably, Tippecanoe County accounts for over 70% of the region’s
population and thus drives many of the overall outcomes. For example, despite population losses from 2010 to 2020 in four of the six counties, the overall
region grew by 4.9%, given Tippecanoe’s above state average gains. This divergence is also seen in educational outcomes. While high school attainment
is fairly consistent across the region, Tippecanoe’s percent share of the population with a Bachelor’s Degree or more is at least double that of all other
counties in the region.
20 Greater Lafayette Regional Development PlanEconomic Conditions
Economic growth
COUNTY TIPPECANOE WHITE CARROLL FOUNTAIN BENTON WARREN REGION INDIANA
Labor Force persons 2020 94,147 13,254 9,659 7,752 4,268 4,001 133,081 3,319,010
Labor Force Change 2010-20 8.8% 2.1% -5.8% -9.9% -8.5% -4.8% 2.87% 2.0%
Unemployment Rate 2020 6.3% 5.0% 6.0% 6.5% 5.2% 5.4% 6.1% 7.1%
Per Capita Personal Income 2019 $39,525 $44,008 $43,432 $41,412 $42,135 $45,202 $43,669 $48,678
Median Household Income 2019 $51,228 $58,295 $58,965 $55,337 $55,016 $64,109 $59,563 $57,617
Annual Individual Poverty Rate 2019 16.1% 10.3% 8.7% 12.5% 8.7% 9.4% 12.5% 11.9%
Individual Population in Poverty 2019 28,094 2,452 1,728 2,025 746 757 35,802 775,823
Average Wage per Job 2020 $51,901 $42,226 $42,822 $37,815 $41,525 $45,406 $43,466 $51,925
Source: STATS Indiana, using data from the Indiana Department of Workforce Development
Tippecanoe’s Per Capita Income and Median Household Income are both the lowest in the region. Additionally, the reported poverty rate is the highest in
Tippecanoe County. However, an analysis by the Purdue University Center for Regional Development, using data for 2013-2017, found that adjusting the rate to
account for college and graduate students reduced the poverty rate for Tippecanoe County from 20.7% to 10.9%, and the rate for Indiana was also reduced to
12.6% from 14.2%.
Greater Lafayette Regional Development Plan 21labor force Growth
Greater Lafayette Region Indiana
140,000 3,400,000
Grater Lafayette Labor Force
Similar to population trends, Tippecanoe stands out in the labor force 135,000 3,300,000
Indiana Labor Force
gains from 2010 to 2020 while much of the rest of the region saw losses.
130,000 3,200,000
Excluding the changes in the Labor Force for 2020 driven by the unusual
dynamics of the COVID-induced recession, the region’s labor force grew 125,000 3,100,000
steadily through 2018, with a slight loss of less than 400 workers between
2018 and 2019. 120,000 3,000,000
2011 2012 2013 2014 2015 2016 2017 2018 2019
Monthly data on the labor force provides more information on the COVID-
induced recession and recovery. The largest decrease of nearly 14,000
workers occurred between March and April of 2020. By June of 2021 those changes in labor force
Greater Lafayette Labor Force Indiana Labor Force
losses have nearly been erased and the region is only 3,400 workers below 3,500,000
145,000
the peak in May of 2018. Compared to Indiana, the region’s labor force
Greater Lafayette Labor Force
exhibited a more severe “V-shaped” decline and recovery than the state as 140,000 3,400,000
a whole.
Indiana Labor Force
135,000 3,300,000
130,000 3,200,000
125,000 3,100,000
120,000 2018-Jan. 3,000,000
2018-Mar.
2018-May.
2018-July.
2018-Sept.
2018-Nov.
2019-Jan.
2019-Mar.
2019-May.
2019-July.
2019-Sept.
2019-Nov.
2020-Jan.
2020-Mar.
2020-May.
2020-July.
2020-Sept.
2020-Nov.
2021-Jan.
2021-Mar.
2021-May.
Source: U.S. Bureau of Labor Statistics, Local Area Unemployment Statistics
22 Greater Lafayette Regional Development Planpopulation characteristics
Apart from Tippecanoe, county age
age breakdowns
breakdowns are largely consistent with
state averages. Tippecanoe is home to a Tippecanoe
larger share of young people, particularly
college students (24.2%), given the location ¢ Preschool (0 to 4)
of Purdue University and a regional Ivy Rest of Counties
¢ School Age (5 to 17)
Tech campus. For counties other than ¢ College Age (18 to 24)
Tippecanoe in the region, older adults and ¢ Working Age (25 to 64)
retirees make up 47% of the population, 7% Region ¢ Retirement Age (65 +)
higher than the state average.
The region is majority White and non- Indiana
Hispanic, surpassing state averages in
almost all counties. Outside of Tippecanoe, 0% 25% 50% 75% 100%
the region is 92.8% White. Tippecanoe is the
most diverse, but still has a Black or African
American population of only 5% compared Racial and Ethnic Makeup
to 9% for the state. All categories reflect a
single selected racial identity. Those with
multiple identities are captured within the Tippecanoe
multiple racial identities category.
¢ White, Not Hispanic
Rest of Counties ¢ Black or Africa American,
Purdue’s campus does provide additional Not Hispanic
diversity to the region with faculty, staff, ¢ Hispanic or Latino
and students from over 100 countries. ¢ Asian Alone, Not Hispanic
Region
¢ Native Americans, Alaskan,
Hawaiian, and Other Pac. Isl.
¢ Multiple Racial Identities
Indiana
0% 25% 50% 75% 100%
Source: STATS Indiana, using data from the Indiana Department of Workforce Development
Greater Lafayette Regional Development Plan 23Educational Attainment and income Analysis
Again, the location of Purdue University educational attainment
is evident in educational attainment
metrics given that the majority of Tippecanoe
Tippecanoe residents have some ¢ Less than 9th Grade
post-secondary experience. High school ¢ 9th to 12th, No Diploma
completion remains the most common Rest of Counties ¢ High School Graduate (includes equiv.)
highest level of achievement in the ¢ Some College, No Degree
remaining counties, leading to a higher ¢ Associate Degree
rate of people without a college diploma Region ¢ Bachelor’s Degree
than the state average. ¢ Graduate, Professional or Doctorate Degree
Median household income is increasing Indiana
across the region, though at varying
paces. Starting from positions of relative
parity with the state, Benton, Fountain, 0% 25% 50% 75% 100%
and Tippecanoe have fallen further below
the state median household income by median Household income
2019. Warren leads the region in median $ 64,109
household income. While Warren, White, $ 58,295 $ 58,965 $ 55,337 $ 55,016 $ 57,617
and Carroll have a median household $ 60,000
$ 51,228
income higher than that of the state, the
state growth rate exceeds that of any $ 44,687 $ 42,718
$ 40,097 $ 41,530 $ 39,486 $ 41,085 $ 41,511
county in the region. $ 40,000
¢ Region ¢ Indiana
$ 20,000
$0
Tippecanoe White Carroll Fountain Benton Warren Indiana
Source: STATS Indiana, using data from the Indiana Department of Workforce Development
24 Greater Lafayette Regional Development PlanPersonal Per Capita Income Change, 2010-2019
Personal income derives from wages,
County TIPPECANOE WHITE CARROLL FOUNTAIN BENTON WARREN INDIANA
dividends, interest, rents, and
2010 $42,632 $45,891 $48,055 $42,817 $46,318 $49,238 $41,511 government benefits. In terms of per
2019 $51,228 $58,295 $58,965 $55,337 $55,016 $64,109 $57,617 capita income, the region lags both
state and national averages. This may
% Change 20.2% 27.0% 22.7% 29.2% 18.8% 30.2% 38.8% reflect the relatively low cost of living
but could prove challenging in recruiting
and retaining talent. White and Carroll
Counties are leading the region in terms
of PCPI growth rate of 38.70%.
Labor Force Participation Analysis 2010-2019 The overall regional labor participation
rate, 62.8%, is very close to the national
average of 61.7%. As seen in the
labor force change 2010 - 2019 summary statistics, the labor force is
15.0 % 13.9% declining in the smaller counties. This
trend suggests an aging workforce not
10.0 % keeping up with attrition. However,
Tippecanoe outperformed statewide
growth rates between 2010 and 2020.
5.0 % 2.7%
-2.3%
-3.0% -4.0% -3.7% -0.3% -2.3%
0.0 %
4.5%
-2.6%
-3.0%
-5.0 % ¢ Labor Force 5 - Year % Change
-6.4% ¢ Labor Force 10 - Year % Change
-10.0 % -8.3% -8.5%
Tippecanoe White Carroll Fountain Benton Warren Indiana
Greater Lafayette Regional Development Plan 25Poverty rate 2019
Regional poverty rates are consistent with state averages with a few
exceptions. Both the child and overall poverty rates surpass averages
in Fountain County. Carroll County has the lowest rate for child
poverty in the region at 11.6%, below the state rate of 15.1%. As noted
previously the poverty rates in Tippecanoe County are higher due to
students living off-campus being part of the data set.
Tippecanoe 28,094
5,404
White 2,452
737
Carroll 1,728
508
2,025
Fountain 619
Benton 745
269
757
Warren 243
775,823
Indiana 230,725
0% 5.0% 10.0% 15.0% 20.0%
Percent of Population
¢ Adult Poverty Rate ¢ Poverty Rate for Children under 18
Source: STATS Indiana, using data from the Indiana
Department of Workforce Development
26 Greater Lafayette Regional Development PlanHousing Occupancy Status
Housing Occupancy Status 2019
Tippecanoe 5,771 Most units in the region are owner-occupied, consistent
with state and national breakdowns. Rental units are
White 3,244 predictably more prevalent in Tippecanoe county given
the presence of Purdue University. The number of
Carroll 1,623 vacancies is notably higher in White County, which also
has a larger share of seasonal/recreational homes than
Fountain 925 any other county in the region.
Benton 498 ¢ Owner Occupied
¢ Renter Occupied
Warren 390
¢ Vacant
¢ For Seasonal or Recreational Use
Indiana 316,129
U.S. 16,883,357
Vacancy rate trends 2010 - 2019
20.00%
0% 25% 50% 75% 100%
Percent of Total Housing Units 20.00%
Source: Census American Community Survey, 2016-2020
15.00%
Considering vacancy of total units (both rental and owner-occupied) more
closely reveals White County’s vacancy rate has been over 20% for the last
decade. Average vacancy rate slightly increasing between 2010 and 2019 is 10.00%
common across counties and the state, while remaining stagnant nationally.
5.00%
¢ Vacancy Rate 2010
¢ Vacancy Rate 2019 0.00 %
Tippecanoe White Carroll Fountain Benton Warren Indiana U.S.
Greater Lafayette Regional Development Plan 27Housing Units totals and Types
The region’s housing stock is aging, as 42% of units are Age of housing stock
at least 50 years old. Compared to 2000-2009, from
2010-2019 the number of new housing units built in Tippecanoe
the region dropped by nearly half. However, in 2020,
Tippecanoe and White Counties surpassed the state in White
the ratio of housing permits issued to existing housing ¢ 2000 - 2014 or later
stock. Lack of new housing is concerning: it may indicate Carroll ¢ 1980 - 1999
a lack of demand and subsequently limit existing supply. ¢ 1960 - 1979
As explored next, this trend can exacerbate the housing Fountain ¢ 1940 - 1959
cost burden. ¢ 1939 or earlier
Benton
Warren
0% 25% 50% 75% 100%
Source: Census American Community Survey 2019 5-year estimates
28 Greater Lafayette Regional Development PlanTotal Housing Units
TIPPECANOE WHITE CARROLL FOUNTAIN BENTON WARREN INDIANA INDIANA
Owner-Occupied 38,848 7,661 6,457 5,312 2,541 2,815 1,776,182 3,319,010
Renter-Occupied 31,678 2,218 1,545 1,662 891 542 794,237 2.0%
Vacant 5,771 3,244 1,623 925 498 390 316,129 7.1%
Seasonal/Recreational 297 2,363 797 215 62 29 46,813 $48,678
TOTAL 76,594 15,486 10,422 8,114 3,992 3,776 2,933,361 $57,617
Source: Census American Community Survey 2019 5-year estimates
Cost-Burdened households, those spending 30% or more
of their monthly income on housing, vary across the
region. In many cases, they surpass the state averages.
A Cost-Burdened household is one spending 30-49% of
their income on housing costs. A household is considered Cost-Burdened Households 2019
Severely Cost-Burdened if they spend 50% or more of their
monthly income on housing. Housing burden impacts both
¢ Severally
renters and homeowners, those with mortgages and those Owners Cost-Burdened
without. For instance, a household with average earnings
spending more than $1,383 a month on rent or mortgage ¢ Cost-Burdened
payments in Fountain County is Cost-Burdened.
Renter ¢ Not Burdened
Renters are more likely to be Cost-Burdened than Owners
in the region. Like with other metrics, Tippecanoe County 0% 25% 50% 75% 100%
is driving regional results. In this case, the prevalence of
college students renting with relatively low or no income Source: Census American Community Survey, 2016-2020
may make noise in the data.
Greater Lafayette Regional Development Plan 29“The economy is extremely
strong and the quality
is great with continuing
significant improvements.”
Marisol Sarkkinen, Non-Profit Official
30 Greater Lafayette Regional Development PlanECONOMY
115,000
Total Employment in the
Greater Lafayette Region 100,000
Nationwide the pandemic likely impacted 2020 employment
numbers. As of Q3-2020, the region was down nearly 7,100 jobs below
the peak employment in Q3-2019. More than 4,300 jobs were lost 105,000
between the first and second quarters of 2020 and the usual seasonal
third-quarter gain of 2,200 jobs was a loss of nearly 1,000 jobs in
the third quarter of 2020. Preliminary data on 2020-Q4 indicates a
rebound of 2% between Q3 and Q4. 100,000
2015-1
2015-2
2015-3
2016-4
2016-1
2016-2
2016-3
2016-4
2017-1
2017-2
2017-3
2017-4
2018-1
2018-2
2018-3
2018-4
2019-1
2019-2
2019-3
2019-4
2020-1
2020-2
2020-3
2020-4
Greater Lafayette Regional Development Plan 31Sector Growth - Pre-COVID 2015 2019 PERCENT CHANGE ABSOLUTE
CHANGE
EMPLOYMENT EMPLOYMENT 2015 - 2019 2015 - 2019
Before COVID-19, between 2015 and 2019,
the region had 12 sectors growing faster Accommodation and Food 9,551 10,158 6% 606
than the regional average and all of those
sectors added more than 100 jobs. The Administrative and Support 5,180 5,053 -2% -127
largest absolute gains were in Manufacturing
and Healthcare. The fastest-growing
Agriculture, etc. 1,177 1,310 11% 133
industries in the region were Other Services Arts and Recreation 831 980 18% 149
and Professional and Technical.
Construction 4,047 4,417 9% 369
Educational Services 20,176 19,781 -2% -395
Finance/Insurance 2,532 2,107 -17% -425
Health Care 12,743 14,312 12% 1,570
Information 1,142 1,098 -4% -44
Management 220 193 -13% -28
Manufacturing 22,986 25,802 12% 2,816
Mining and Extraction 101 37 -63% -64
Other Services 2,545 3,039 19% 494
Professional and Technical 2,731 3,247 19% 516
Public Administration 3,390 3,705 9% 315
Real Estate 1,258 1,371 9% 113
Retail Trade 11,057 10,565 -4% -493
Transport/Warehouse 2,573 2,814 9% 241
Utilities 209 218 5% 10
Wholesale Trade 2,985 3,255 9% 269
TOTAL 107,433 113,459 6% 6,026
32 Greater Lafayette Regional Development PlanSector Impacts - COVID Average Quarterly Change
COVID-19 job losses have impacted a majority of the sectors of the 2020 AVERAGE
SECTOR PRE-COVID COVID
regional economy. Before COVID, only 5 sectors experienced an EMPLOYMENT
average quarterly loss, but during COVID19, 12 sectors had losses, Accommodation and Food 43 -830 9,099
and only 8 achieved gains. The most severe COVID-19 losses were
in Accommodation and Food and Education Services. A significant Administrative and Support -52 -400 3,837
concern is that Manufacturing had been generating the strongest Agriculture, etc. 11 50 1,338
quarterly job growth pre-COVID-19. It reversed course and had the
third-largest quarterly loss during COVID-19. Arts and Recreation 13 89 837
Construction 37 87 4,481
Educational Services -1 -523 19,157
Finance/Insurance -18 26 2,102
Health Care 102 -294 14,299
Information -5 -88 1,000
Management 0 -2 220
Manufacturing 144 -519 25,522
Mining and Extraction 2 1 48
Other Services 31 -125 2,976
Professional and Technical 29 52 3,334
Public Administration 15 138 3,622
Real Estate 7 -4 1,357
Retail Trade -32 -143 10,262
Transport/Warehouse 15 -27 2,826
Utilities 1 5 225
WHOLESALE TRADE 14 -93 3,157
Greater Lafayette Regional Development Plan 33average quarterly change in employment
Tippecanoe County accounted for 85 of every
100 jobs in the region, as of Q3-2020, but it also
accounted for 96 of every 100 jobs lost during
COVID-19. White and Benton counties experienced
more rapid employment growth during COVID
than they did before the pandemic, but given
the small size of these counties and the short
timeframe involved, it is difficult to draw any Average Quarterly Change Employment
conclusions about why this happened and
whether it marks a shift in the regional economy. Tippecanoe White Carroll Fountain Warren Benton Region
Pre-COVID 311 7 19 -6 15 1 349
COVID -2,504 32 -44 -33 -54 2 -2,601
Source: Quarterly Workforce Indicators, U.S. Census Bureau, 2015-Q1 to 2020-Q3.The COVID period begins 2020-Q2. Data
is only available through 2020-Q3, data on Post-COVID employment is not yet available.
STRONG
EMPLOYMENT
Percent Change in Employment
GROWTH Tippecanoe White Carroll Fountain Warren Benton Region
Pre-COVID
(Annualized) 1.9% 0.4% 1.7% -0.6% 4.0% 0.3% 1.6%
COVID -5.6% 0.7% -1.5% -1.6% -4.9% 0.3% -4.6%
Source: Quarterly Workforce Indicators, U.S. Census Bureau, 2015-Q1 to 2020-Q3.The COVID period begins 2020-Q2. Data
is only available through 2020-Q3, data on Post-COVID employment is not yet available. The Pre-COVID percent change is
annualized to be comparable to the COVID period.
34 Greater Lafayette Regional Development PlanProjections for growth Occupations
Projections for the Greater Lafayette Region predict that the growth in the region will Management and business is the largest occupational sector. It represents a
be driven by an increase in the population 65 and older. More than 14,800 will reach higher share of the regional economy than it does in Indiana as a whole. The
retirement age by 2025, growing to 29,600 by 2030. The working age population region has a lower proportion of sales and office occupations that account
will grow through 2025 but then decline from 2025 to 2030 driven by aging and out- for the additional share of management and business occupations. The other
migration. The region will need about 940 workers to enter the labor force each year occupational sectors match the state proportions.
to fill vacancies based on historical rates of retirement.
100%
National sources report that workers 55 and older are considering early retirement. 630,565 26,717 Production and
The region currently has 9,300 people aged 60 to 64 in the regional labor force Transportation
75% 282,119 11,518
that could be eligible for early retirement. If these workers participate in the labor
Natural Resources
force at the same rate as the workers 65 and older, it could mean up to 950 early 23,827 and Construction
666,741
retirements per year within this age cohort. An additional 11,000 workers are aged 50% Sales and Office
55 to 59 years, and if they also opt for early retirement, it could add 450 more 526,719 22,340
retirements per year. It is uncertain how long any early retirement impact will Service
last, and how many of those potential retirees exited the workforce in 2020. Early 25% Management and
retirements from workers 55 to 64 could mean that the region would need up to 1,096,365 48,929 Business
2,340 workers per year to fill the openings left from early retirement.
0%
20,000 State REgion
15,000
14,133 Regional Population Growth
10,000 9,376 Retirement Age
8,948
5,512
5,000
3,082
699 Working Age Population
(25-+64)
0
2020 2025 2030
Source: Fourth Economy Population Projections 2020 to 2030.
Greater Lafayette Regional Development Plan 35You can also read