Land Use and Land Cover Change Within and Around the Greater Serengeti Ecosystem, Tanzania
←
→
Page content transcription
If your browser does not render page correctly, please read the page content below
American Journal of Remote Sensing
2020; 8(1): 1-19
http://www.sciencepublishinggroup.com/j/ajrs
doi: 10.11648/j.ajrs.20200801.11
ISSN: 2328-5788 (Print); ISSN: 2328-580X (Online)

Land Use and Land Cover Change Within and Around the
Greater Serengeti Ecosystem, Tanzania
Hamza Khalid Kija1, 2, *, Joseph Ochieng Ogutu3, Lazaro Johana Mangewa1, John Bukombe2,
Francesca Verones4, Bente Jessen Graae5, Jafari Ramadhani Kideghesho6,
Mohammed Yahya Said5, 7, Emmanuel Fred Nzunda8
1
    Department of Wildlife Management, College of Forestry, Wildlife and Tourism, Sokoine University of Agriculture, Morogoro, Tanzania
2
    Conservation Information and Monitoring Unit (CIMU), Tanzania Wildlife Research Institute (TAWIRI), Arusha, Tanzania
3
    Biostatistics Unit, Institute of Crop Science, University of Hohenheim, Stuttgart, Germany
4
    Department of Energy and Process Engineering, Norwegian University of Science and Technology, Trondheim, Norway
5
    Department of Biology, Norwegian University of Science and Technology, Trondheim, Norway
6
    College of African Wildlife Management (CAWM), Moshi, Tanzania
7
    Institute for Climate Change and Adaptation, University of Nairobi, Nairobi, Kenya
8
    Department of Forest Resources Assessment and Management, College of Forestry, Wildlife and Tourism, Sokoine University of Agriculture,
    Morogoro, Tanzania

Email address:

*
    Corresponding author

To cite this article:
Hamza Khalid Kija, Joseph Ochieng Ogutu, Lazaro Johana Mangewa, John Bukombe, Francesca Verones, Bente Jessen Graae, Jafari
Ramadhani Kideghesho, Mohammed Yahya Said, Emmanuel Fred Nzunda. Land Use and Land Cover Change Within and Around the Greater
Serengeti Ecosystem, Tanzania. American Journal of Remote Sensing. Vol. 8, No. 1, 2020, pp. 1-19. doi: 10.11648/j.ajrs.20200801.11

Received: March 3, 2020; Accepted: March 20, 2020; Published: April 29, 2020

Abstract: Land use and land cover (LULC) changes can pose profound impacts on wildlife habitats, abundance and distribution
and on human-dominated landscapes. We investigated LULC changes in the Greater Serengeti ecosystem, Tanzania, for a period of
41 years from 1975 to 2015. Specifically, we mapped LULC types for 1975, 1995 and 2015 and assessed the corresponding changes
during 1975-1995, 1995-2015 and 1975-2015. We used the random forest classification algorithm to classify Multispectral Scanner
(MSS), Thematic Mapper (TM), Enhanced Thematic Mapper Plus (+ETM) and Operational Land Imager (OLI) into eight main
classes. We obtained accuracies of 88.4%, 90.6% and 93.4% with Kappa Indices of Agreement (KIA) of 0.86, 0.87 and 0.91 for
1975, 1995 and 2015, respectively. Grassland, shrubland and woodland were the major LULC types throughout 1975-2015 with
percentage coverages of 50.6%, 23.7% and 20.9% for 1975; 54.2%, 23.5% and 15.9% for 1995; and 57.0%, 23.8% and 8.9% for
2015, respectively. Overall, woodland cover (-11.1%) was converted to most of the other cover types during 1975-2015. The loss of
woodland cover is due to increasing human population size, agriculture, settlements and policy changes fires and elephant browsing.
Effective conservation policies and regulation of socio-economic activities in the ecosystem and its buffer area are essential to
ameliorate declining vegetation cover, especially along the protected areas boundaries.
Keywords: Land Use and Cover Change, Land Cover Transformation, Random Forest Classification,
                   GIS and Remote Sensing, Serengeti Ecosystem, Wildlife Habitats

                                                                           of natural ecosystems. Land cover provides habitats for
1. Introduction                                                            wildlife, while land use shapes the land cover, and
     Land use and land cover (LULC) are important components               consequently, alters the habitat types and wildlife species [1].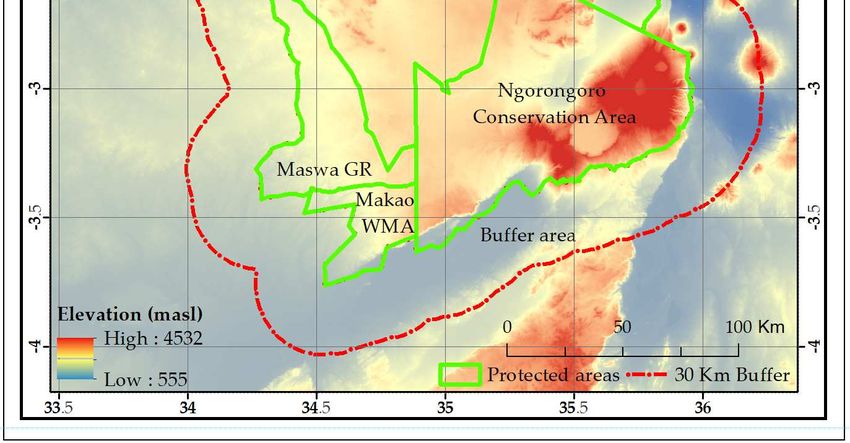
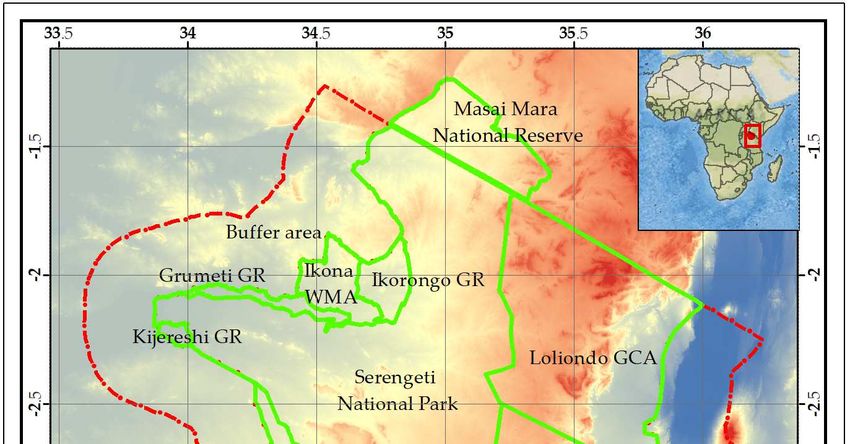
2      Hamza Khalid Kija et al.:   Land Use and Land Cover Change Within and Around the Greater Serengeti Ecosystem, Tanzania

Anthropogenic activities are increasingly altering habitats and      ecosystem. The first slice (1975-1995) was preceded by a
their ecosystem services especially in terrestrial ecosystems        national resettlement program in Tanzania in 1974 in which
[2]. LULC changes can exert profound impacts on the                  people were forced to live in village clusters (villagization).
structure and function of terrestrial ecosystems. Notably,           This caused a sudden increase in human population densities
complex interactions between land use and land cover in              in the resettlement areas [8, 21, 22]. The villagization program
human-dominated landscapes interfere with biotic and abiotic         changed LULC where it was implemented [21]. In addition,
factors and processes, with often adverse consequences for           changes introduced in agricultural policies between 1974 and
wildlife habitats, abundance and species diversity [3]. LULC         1983 compounded the impacts of the villagization program on
changes, including in wildlife habitats, are accelerating            the environment. The second study slice (1995-2015)
globally and escalating habitat degradation and declines in          coincided with continuation of the policies that promoted
abundance and distributional ranges of species [4, 5].               expansion of agricultural production in Tanzania, thus driving
   The Serengeti ecosystem in Tanzania is an exemplar of             further LULC changes [23, 24]. The broad study window
ecosystems experiencing intense and mounting pressures due           (1975-2015) was considered to establish the overall LULC
to anthropogenic-induced land use and land cover changes             changes in the ecosystem and its surrounding buffer area.
along its borders [6]. As a result, the ecosystem has undergone
significant land use and land cover changes particularly over        2. Materials and Methods
the 41 years spanning from 1975 to 2015. This is disturbing
since this ecosystem is one of the earth’s remaining tropical        2.1. Description of the Study Site
biodiversity hotspots and hosts hosting some of the largest
remaining free-ranging ungulate populations [7]. Notably,               The study was conducted in the Serengeti ecosystem in
substantial land cover has been converted to small-scale             northern Tanzania (1°20′ 50″ to 3°50′ 05″S; 33°08′ to 32″
agriculture near the boundary of the Serengeti whereas               36°42′ 38″ E). The ecosystem is an outstanding biodiversity
increasing livestock numbers are regularly encroaching into          hotspot and is home to the SNP and the Ngorongoro
the park in search of pasture [6, 8]. Moreover, expanding            Conservation Area both of which are Biosphere Reserves and
human and livestock population growth, settlements and               World Heritage Sites [17]. The ecosystem covers about 33,150
agriculture are intensifying the pressure falling on wildlife        km2 and comprises nine protected areas (under different
habitats and therefore, threatening wildlife populations and         conservation administrations), including a national park, a
shrinking their distribution in the ecosystem [8, 9]. LULC           multiple land use area, game reserves, game controlled areas
changes not only contract the distribution but also degrade the      and wildlife management areas (Figure 1). The study area also
quality of wildlife habitats, heightening their sensitivity to       included an unprotected buffer area covering some 23, 487
climatic and other perturbations [9-11].                             km2 around the core study ecosystem. The total study area
   Despite the rapid and striking LULC changes, relatively           thus covered some 56,592 km2. The degree of protected and
few studies [12, 13] have examined these changes within and          permitted land use types vary widely within the ecosystem and
around the Serengeti ecosystem. Furthermore, previous                its buffer area, with direct implications for LULC types and
studies of LULC changes in wildlife habitats in the Serengeti        changes. The conservation status of the protected areas against
are fragmented and have focused either only on specific              human activities is the highest for the Serengeti National Park
habitat types (e.g., grasslands or woodlands), habitats              SNP, followed in decreasing order, by the Ngorongoro
proximate to human-dominated landscapes [14-17], or only on          Conservation Area (NCA), Game Reserves (GRs), Loliondo
predicting spatial distribution and habitat suitability for          Game Controlled Area (LGCAs), Wildlife Management Areas
particular wildlife species inside the protected areas [18-20]. It   (WMAs) and the buffer area (BF). Human habitation is
is therefore important to quantify the extent and magnitude of       prohibited in the national park and game reserves. Only
LULC changes within and around ecosystems of great                   conservation and photographic tourism are allowed in the
ecological and economic importance, such as the Serengeti, as        national park. Licensed hunting is allowed in the Game
a basis for forecasting their likely long-term trajectories and      Reserves, Game Controlled Areas and Wildlife Management
potential consequences for wildlife habitats and populations.        Areas. The NCA is a multiple land use area allowing human
Importantly, a better understanding of spatial and temporal          settlement and pastoralism. Farming, which was allowed in
land use and land cover dynamics is imperative for effective         1992 through the Prime Minister Decree was prohibited in the
spatial land use planning and policies, biodiversity                 NCA in 2009. Human settlement and socio-economic
conservation and management and human wellbeing.                     activities were allowed with minimal restrictions in the Game
   Accordingly, our aim was to investigate long-term LULC            Controlled Areas until the Wildlife Act No. 5, which outlawed
changes in the Serengeti ecosystem and its surrounding buffer        these activities, was promulgated in 2009.
area for a period of 41 years from 1975 to 2015. Specifically,          Rainfall in the ecosystem is strongly bimodal, with the wet
we use multi-spectral, remotely sensed data to (i) map land use      season spanning from November to May and the dry season
and land cover during 1975, 1995 and 2015 and (ii) assess            commencing from June to October. The wet season consists of
LULC changes during 1975-1995, 1995-2015 and 1975-2015.              the short (November-December) and long (March-May) rains,
   The three study time slices (1975-1995, 1995-2015) were           separated by a relatively dry period in January-February [16].
selected to capture effects of major perturbations in the            Rainfall varies widely in space and time and increases from an
American Journal of Remote Sensing 2020; 8(1): 1-19                                          3

annual average of 500 mm in the southeast to 1150 mm in the            Ikorongo-Grumeti Game Reserve [16, 28]. Other vegetation
northwest and from 500 mm in the East to 950 mm in the west            types include riverine forests, swamps, grasslands, woodlands
[25, 26]. Part of the spatial variation in rainfall is due to          and open-woodlands [27], with woodlands, covering 60% of
topographical gradients in the ecosystem. Temperatures are             the ecosystem, being the dominant vegetation type [28]. It is
generally warm year-round and averages 27 °C [25].                     home to abundant herds of diverse ungulate species, including
   The ecosystem supports a mixture of diverse vegetation              the migratory wildebeest (Connochaetes taurinus), zebra
types, ranging from grassland plains in the south-eastern and          (Equus quagga burchellii), Thomson’s gazelle (Gazella
western regions of Serengeti and northern Ngorongoro [27], to          thomsoni), and other species, such as buffalo (Syncerus caffer)
north of Grumeti river and woodlands in Maswa and a mosaic             and elephants (Loxodonta africana) [7, 29].
of woodlands and closed gallery forests along major rivers in

                                  Figure 1. Map of the study area showing the protected and buffer areas.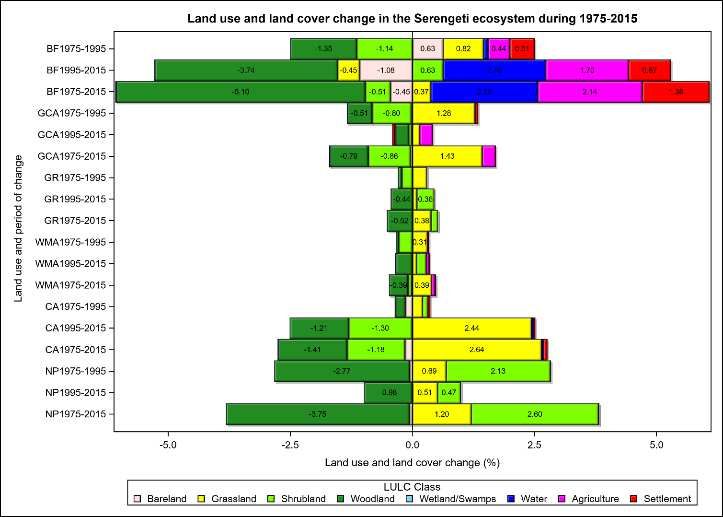
4          Hamza Khalid Kija et al.: Land Use and Land Cover Change Within and Around the Greater Serengeti Ecosystem, Tanzania

2.2. Image Acquisition and Pre-processing                                  effect of seasonal differences in vegetation phenology between
                                                                           study windows was minimized by downloading image scenes
   Landsat Multispectral Scanner (MSS), Thematic Mapper (TM)               captured on similar satellite overpass times or seasons (Dry
and Landsat-8 (Operational Land Imager) time series images for             periods spanning January-February, July-August and
the years 1975, 1995 and 2015 that correspond to paths 168, 169            October-November). Dry season images have relatively lower
and 170 and rows 61, 62 and 63 of the Landsat Worldwide                    cloud cover than wet season images. Details of the Landsat
Reference System (WRS) were downloaded from the Earth                      images used are summarized in Table 1.
Explorer (https://earthexplorer.usgs.gov/) web platform. The

                                           Table 1. Details of the Landsat images used for LULC mapping.

    Image date             Image type                Resolution                 Path and Row               Data Source
                           Landsat MSS               57 × 57 m                  168/61-62                  United States Geological Survey
    1975                   Landsat MSS               57 × 57 m                  169/61-63                  United States Geological Survey
                           Landsat MSS               57 × 57 m                  170/61-62                  United States Geological Survey
                           Landsat TM                30 × 30 m                  168/61-62                  United States Geological Survey
    1995                   Landsat TM                30 × 30 m                  169/61-63                  United States Geological Survey
                           Landsat TM                30 × 30 m                  170/61-62                  United States Geological Survey
                           Landsat (OLI)             30 × 30 m                  168/61-62                  United States Geological Survey
    2015                   Landsat (OLI)             30 × 30 m                  169/61-63                  United States Geological Survey
                           Landsat (OLI)             30 × 30 m                  170/61-62                  United States Geological Survey

   Prior to analysis, images were corrected for geometric and              seamlessly stitched in PCI Geomatica [42] to obtain one image
radiometric effects [30-32]. Such pre-processing is useful to              covering the entire ecosystem. Image scenes were then clipped to
remove false indication of objects and facilitates comparison              individual strata (the various protected areas plus the buffer area)
of multi-temporal images and field-based data [33, 34], and                for minimizing the spread of classes to other areas that do not
ensures that the corrected images are of sufficiently high                 belong to it, and to speed up the classification process.
quality for analysis [31]. Image and/or sensor differences
within and between scenes were normalized by converting the                2.5. Sampling Design
brightness values of each pixel (Digital Number (DN) to                       i. Sample Size and Distribution of Samples
actual reflectance (Top of Atmosphere Reflectance (TOA)), in                  The study area was stratified into 10 strata, each
order to obtain the actual ground reflectance [35].                        corresponding to one of the nine protected areas and the
Topographic normalization is a crucial part of atmospheric                 surrounding 30-km wide unprotected buffer area on the
correction [36-38] as it enhances representation of the original           Tanzanian side of the Greater Serengeti-Mara ecosystem
image, hence improving spectral signatures, classification and             (Figure 1). LULC variability was high in each stratum,
overall accuracy [35, 39].                                                 implying a high likelihood of having different classes for LULC.
   A Digital Elevation Model (DEM), covering the entire study              Based on Congalton [43] and the principle of binomial
area at a spatial resolution of 30 m, derived from the Shuttle             distribution, a minimum of 75-100 validation samples per class
Radar Topography Mission (SRTM) was used to correct                        are suggested for analysis. However, due to logistical and
images that are acquired from undulating, mountainous or hilly             financial constraints, terrain features and legal prohibition of
(topographic effects) and/or rugged terrain lands [40].                    driving off-road within protected areas, approximately 30% of
Topographic correction is an important pre-processing stage as             the required sample size was validated for a total of =1918
it improves accuracy of thematic maps [41]. Geometric                      sampling points.
correction was not performed as Landsat Level-1 products are                  Despite these constraints, the sample sizes for the collected test
terrain-corrected [32]. Atmospheric effects on the images were             and validation data are higher than the minimum recommended
corrected through haze removal and masking clouds in the                   sample size [43] and thus were considered sufficient for reliable
scenes using the Atmospheric Correction Tool [42].                         classification. Samples were randomly allocated in proportion to
2.3. Cloud Removal                                                         the area of each LULC type represented in each stratum, using a
                                                                           pre-defined baseline map. However, for infrequent classes (water,
  Satellite images tend to have clouds. It was almost                      wetland/swamps, and bareland), the estimated sample size was
impossible to get cloud-free image scenes that covered the                 adjusted upwards by selecting additional samples using Google
entire study area. Therefore, sections of a scene with clouds              Earth and Bing images.
were first removed and the resulting gaps filled with                         ii. Collection of Sample Points
corresponding sections of cloud-free images for the same                      The selected random samples were traced on the ground
scene taken closely in time, or in the same season and the                 using hand-held Garmin CSX GPS. Sample points falling in
gap-filled using the Smart GeoFill tool [42].                              inaccessible areas (due to terrain features or absence of roads),
                                                                           and restricted off-road access were replaced with samples from
2.4. Image Mosaicking and Sub Setting                                      nearby pixels with similar reflectance or overlaid on high
     The geometric and radiometric corrected scenes were                   resolution Google Earth (https://www.google.com/intl/de/earth/)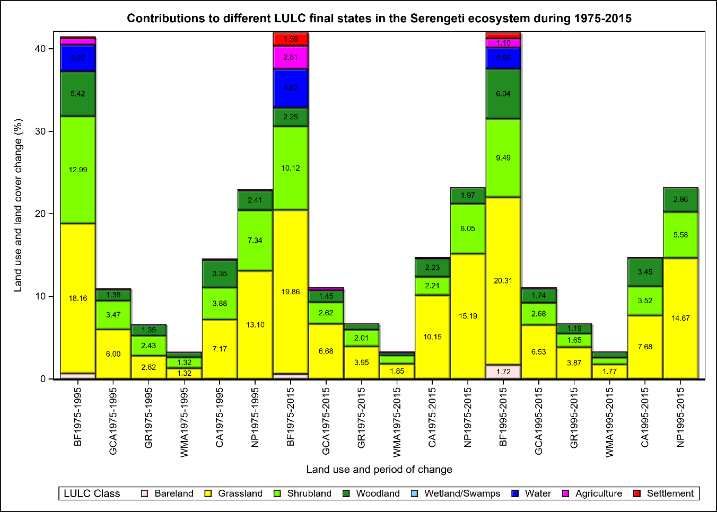
American Journal of Remote Sensing 2020; 8(1): 1-19                                          5

and Bing (https://www.bing.com/maps) images and the                assessment of the predictive accuracy of classification [48, 49].
corresponding object and/or LULC identified [44]. In order to      Shuttle Radar Topography Mission (SRTM) derivatives
minimize the likelihood of misclassifying the sampled LULC,        (Digital Elevation Model, Slope and Topographic Wetness
spectral signatures for the selected sample points were            Index) were combined with the spectral multi-temporal data to
inspected in scatter plots. Opportunistic observations made        improve the classification and accuracies of the classified
while travelling from one sampling point to another                LULC maps [50, 51]. To increase precision and accuracy,
supplemented the training and testing data sets.                   images scenes that are part of different strata were first
   For historical images, the Herlocker (1976) and Reed [13]       classified independently and then merged.
maps were used to obtain the training and testing sets for the        For each classification run, three outputs are produced,
1975 and 1995 imageries, respectively. A minimum of 75-100         namely; the classImage, probImage and threshImage. The
samples per category (Table 2) were extracted. Less covered        classImage, is an output of the classified image. The
class samples were supplemented by collecting additional           probImage that shows the probability of correct classification
manually extracted samples from the imageries using spectral       of the classImage layer. On the other hand, threshImage
characteristics.                                                   identifies classified pixels with inter-class confusion by
   iii. Digitization and Selection of Training and Test Sets       highlighting pixels with a probability of correct classification
   Multi-resolution segmentation was performed in                  that is lower than a user-specified threshold. Besides the three
E-Cognition [45] on each strata image to obtain polygons           optional raster outputs, a point vector file, “Margin file”, is file
(area representing a land cover feature of regular, irregular,     that reports assessment of the quality of sample data. Positive
circular or elliptical shape) which reflects different ground      margin values represent correct classification, and vice versa,
objects based on image spectral characteristics, shape and tone.   and provide a basis for removing poorly classified samples or
Segmentation parameters were set as follows: scale=1,              relabeling sample data. Moreover, it helps to determine which
shape=0.1 and compactness=0. Field samples were overlaid           classes need additional training signatures. Before the final RF
on to the segmented image and corresponding polygons               classification, 2-3 runs were performed and the run with the
extracted.                                                         best accuracy, i.e., above 85%, selected as the final
   The spatial join tool (ArcGIS 10.5) was used to overlay the     classification. Procedures for image pre-processing,
LULC on to corresponding classes in the field samples              processing and post-processing are summarized in Figure 2.
(Table 2). Then, a research tool (random selection within             vi. Accuracy Assessment and Error Matrix
subsets) in QGIS 3.10 was used to randomly partition the              The agreement between the ground truthing data and the
samples into training (50%) and testing (50%) sets for             classified map (accuracy assessment) was assessed by an error
classification and accuracy assessment, respectively, based        matrix [52, 53] using the test dataset (50% of the full sample).
on the LULC categories.                                            The error matrix (cross-tabulation) table for each thematic
   iv. Signature separability                                      image was generated. Kappa Index of Agreement (KIA) that
   The training and test samples were evaluated for class          measures how well the classified map matches the reference
spectral signature separability. This is the statistical measure   data [54] was also computed.
of the distance between two object signatures that can be             In thematic classification, an overall accuracy of ≥ 85% is
correctly assigned to proper LULC patterns that do not             considered acceptable, provided the per-class accuracy is at
overlap with one another. Signature separability was tested in     least 70% [44]. Accuracy assessment is accompanied by KIA,
PCI Geomatica [42] using the Bhattacharyya distance (BD)           a measure of how well the classified map matches the
using bands 3, 4 and 5. BD is a separation index, with values      reference data. KIA values greater than 0.8 indicate perfect
ranging from 0 to 2, with 0 indicating total overlap and 2         classification whereas values lying between 0.6 and 0.8
indicating purely separable signatures. Two objects are            indicate good classification [55]. Therefore, the KIA values
separable if the separation distance between them is               we obtained indicate acceptable classification [56, 57].
statistically significant and sufficient to produce a successful      vii. Post-classification: Change Detection Analysis
classification. Thus, to enhance classification, signatures with      A majority filter (3 × 3 pixels) as recommended [58] was
good separability (1.9 < x < 2.0) were retained, and the poorly    applied to the thematic maps to eliminate the salt-and-pepper
separated signatures (1.0 < x < 1.9) were either merged or         effects (Figure 2). Consequently, the smallest mappable unit
edited until a reasonable separability level was attained, where   (MU) for the classified map in the ecosystem was about 1
x is the separability distance between two samples.                hectare. In order to identify the type, magnitude and spatial
   v. Image Classification                                         aspects of LULC changes between the images for 1975 versus
   Image classification was performed using the Random             1995, 1995 versus 2015 and 1975 versus 2015, a
Forest (RF) coded script [46] that is run in the R software        post-classification change detection was performed in the
package. RF is a powerful machine learning classifier that is      Semi-Automatic Classification Plugin in QGIS software [59].
widely used in land-based remote sensing because it has a high     In order to enable multi-temporal comparison with the rest of
classification accuracy, is more robust to noise than many         the images, a Nearest Neighbor Sampling Algorithm (NNSA)
other competing classifiers and is a non-parametric classifier     was used to re-sample the MSS classified images to 30 × 30 m
[47, 48]. Furthermore, it is able to impute missing values and     pixel. Post-classification comparison or change detection was
rank variables in order of their importance, and allows reliable   used to estimate the percentage change between two images.
6          Hamza Khalid Kija et al.: Land Use and Land Cover Change Within and Around the Greater Serengeti Ecosystem, Tanzania

                                                        Figure 2. Flow chart for image classification.

                                                           Table 2. Description of LULC classes.

    Land use and cover        Land use and cover class descriptions
                              Any area with vegetation cover between 0 and 2%, and includes areas that are barren land, bare rocks and/or soil that are
    Bareland
                              exposed due to burning of trees and shifting cultivation
    Cultivation               Consists of land parcels that are used for subsistence or commercial farming
    Settlement                Areas that are designated as small towns, villages and roads
    Water                     Areas that are covered by water bodies, such as rivers, dams and lakes
                              Areas with non-woody vegetation, comprised of short and tall grasses, used primarily for wildlife and livestock grazing. Rice
    Grassland
                              fields, plantations, and non-irrigated land are excluded from this class
    Shrubland                 Woody vegetation, with multi-stem and height of 3-5 m
    Woodland                  Areas with woody vegetation with a height between 6 -15 m
    Wetland and Swamps        Areas covered by water and other vegetation types

Source: Modified from Tekle, K. and Hedlund, L. [60].

                                                                                 ecosystem and its surrounding buffer area in 1975, 1995 and
3. Results                                                                       2015 are illustrated in Figures 3-5, respectively. The overall
3.1. Land Use and Land Cover Types                                               accuracies of the classified maps were 88.4%, 90.6% and 93.4%
                                                                                 and the corresponding Kappa Indices of Agreement were 0.86,
     The spatial distributions of LULC types in the Serengeti                    0.87 and 0.91 for 1975, 1995 and 2015, respectively. The areal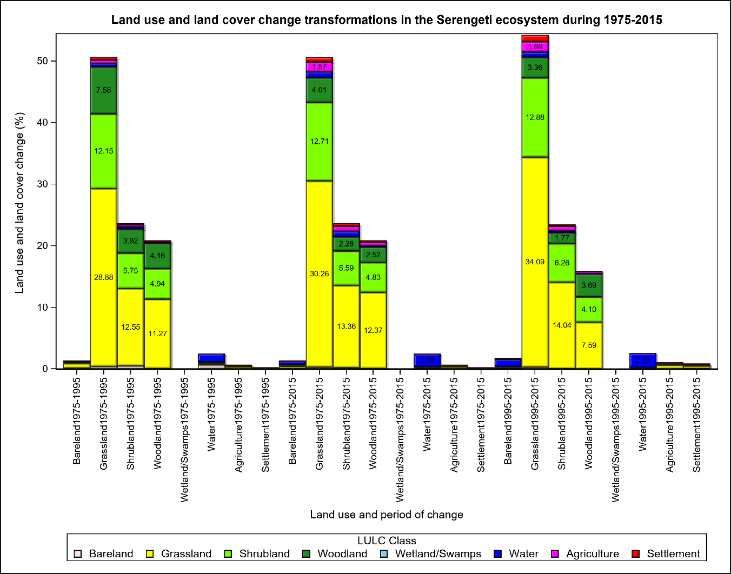
American Journal of Remote Sensing 2020; 8(1): 1-19                                   7

and percentage coverages of the individual LULC classes are                summarized in Table 3.

                       Figure 3. Distribution of LULC types in the Serengeti ecosystem and surrounding buffer zone in 1975.

Where: LGCA=Loliondo Game Controlled Area, MWMA=Makao Wildlife Management Area, IWMA=Ikona Wildlife Management Area, NCA=Ngorongoro
Conservation Area, MGR=Maswa Game Reserve, IGR=Ikorongo Game Reserve, KGR=Kijereshi Game Reserve, GGR=Grumeti Game Reserve,
SNP=Serengeti National Park.

                       Figure 4. Distribution of LULC types in the Serengeti ecosystem and surrounding buffer zone in 1995.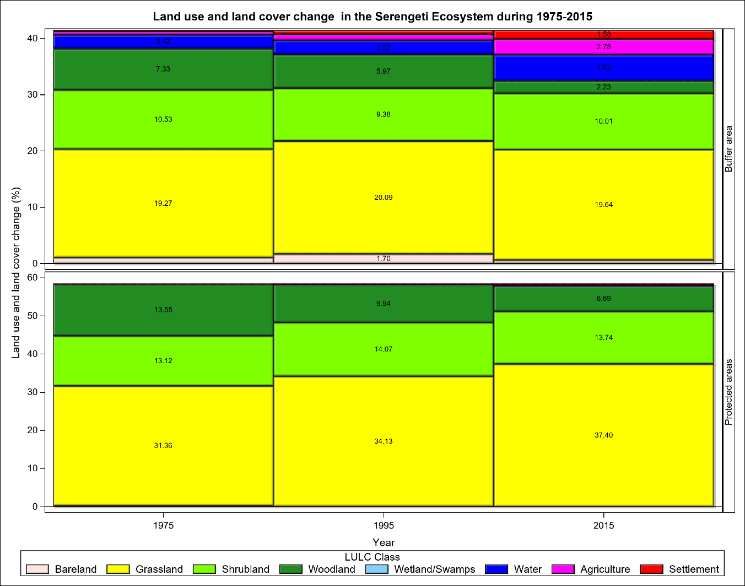
8 Hamza Khalid Kija et al.: Land Use and Land Cover Change Within and Around the Greater Serengeti Ecosystem, Tanzania
Figure 5. Distribution of LULC types in the GSE and surrounding buffer zone in 2015.
Across the entire ecosystem and its buffer area, grassland was the major land cover class, followed by shrubland and woodland
whereas wetland/swamps, settlement, agriculture and bareland had relatively low coverages during 1975-2015 (Table 3).
Table 3. The areal and percentage coverages of LULC classes in the GSE and surrounding buffer area in 1975, 1995 and 2015.
Area coverage (km2) Percentage (%)
LULC Class
1975 1995 2015 1975 1995 2015
Bareland 781 1,003 371 1.38 1.77 0.65
Agriculture 381 643 1,789 0.67 1.14 3.16
Settlement 144 498 982 0.25 0.88 1.73
Water 1,403 1,456 2,664 2.48 2.57 4.71
Grassland 28,649 30,685 32,278 50.62 54.21 57.03
Shrubland 13,384 13,273 13,442 23.65 23.45 23.75
Woodland 11,812 9,005 5,046 20.87 15.91 8.92
Wetland/Swamps 37 28 18 0.06 0.05 0.03
Total 56,590 56,590 56,590 100 100 100
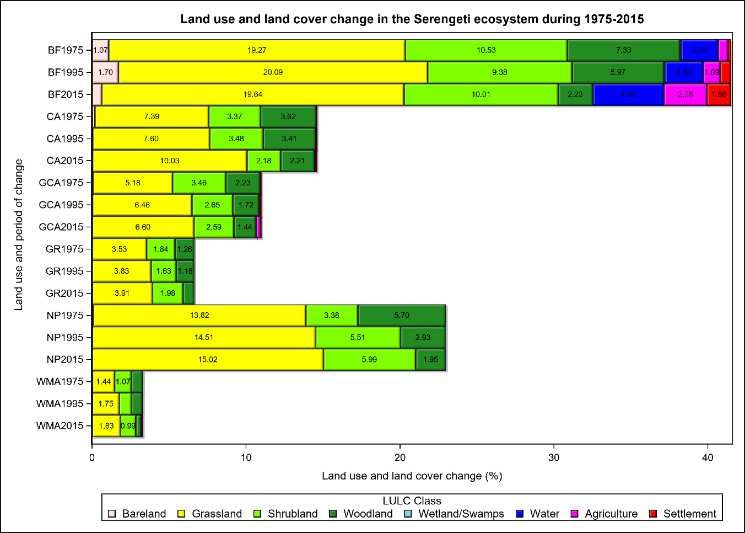
Protected areas had higher proportions of grassland, followed by the SNP, NCA and the LGCA. Grassland
shrubland and woodland coverages than the buffer area coverage varied little in the buffer area but increased slightly
throughout 1975, 1995 and 2015. The buffer had high in the NCA, LGCA and SNP during 1975-2015 (Figure 7).
proportions of grassland, shrubland and woodland in 1975 and Shrubland coverage similarly varied little in the buffer area,
1995 but was dominated by grassland and shrubland in 2015. decreased in the NCA and GCA but increased in the SNP
The other LULC classes had relatively low proportional during 1975-2015 (Figure 7). Woodland coverage decreased
coverages in both the protected and buffer areas in 1975, 1995 persistently and strikingly in the buffer area and all the
and 2015 (Figure 6). protected areas from 1975 to 2015 (Figure 7). The coverages
Grassland was the most dominant land cover type in all the of water, agriculture and settlement expanded in the buffer
protected areas and the buffer area throughout 1975-2015. It area from 1975 to 2015 (Figure 7).
had the highest proportional coverage in the buffer areaAmerican Journal of Remote Sensing 2020; 8(1): 1-19 9
Figure 6. Percentage coverage of LULC classes in all the protected areas in the GSE and surrounding buffer area in 1975, 1995 and 2015.
Figure 7. LULC change (%) in different protected area categories in the GSE and surrounding buffer zone during 1975-2015.10 Hamza Khalid Kija et al.: Land Use and Land Cover Change Within and Around the Greater Serengeti Ecosystem, Tanzania
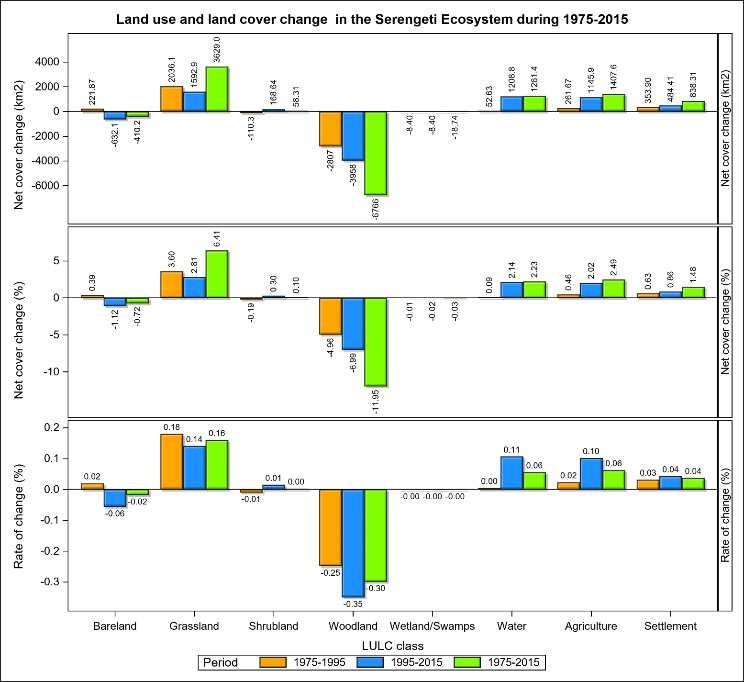
3.2. LULC Cover Change (1975-2015) water, agriculture and settlements all expanded during
1975-2015 (Figure 8).
Between 1975 and 1995, woodland and shrubland Grassland increased significantly in the buffer area and in
coverages had the largest net declines in the ecosystem and its all the protected areas except in the SNP where shrubland was
buffer area. Wetland/swamps coverages also declined. But more dominant than grassland during 1975-1995 (Figure 9).
grassland coverage expanded the most followed by Bareland, water, agriculture and settlement increased notably
settlements, agriculture and bareland (Figure 8). During the in the buffer area (Figure 9). In contrast, woodland and
1995-2015 period, the coverages of grassland, shrubland, shrubland coverages contracted in the buffer area and in all
settlement, bareland and wetland/swamps increased but those protected areas except in the NCA and the SNP where
of woodland and bareland declined (Figure 8). shrubland increased during 1975-1995 (Figure 9). Loss in
Woodland declined drastically and had the highest annual woodland cover was more noticeable in the national park and
rate of change during 1975-2015. Bareland and the buffer area whereas the loss in shrubland cover was most
wetland/swamps coverages also contracted during the 41-year marked in the buffer area and GCA (Figure 9).
study period (Figure 8). But coverages of grassland, shrubland,
Figure 8. Net absolute (km2) and percentage LULC changes and rate of change (%) in the GSE and surrounding buffer area during 1975-2015.American Journal of Remote Sensing 2020; 8(1): 1-19 11
Figure 9. LULC change (%) in each protected area category in the GSE and surrounding buffer zone during 1975-2015.
Figure 10. Transformations between LULC classes in the GSE and surrounding buffer zone during 1975-2015.12 Hamza Khalid Kija et al.: Land Use and Land Cover Change Within and Around the Greater Serengeti Ecosystem, Tanzania
Figure 11. Contributions from different conservation categories to LULC final states during 1975-1995, 1995-2015 and 1995-2015.
During 1995-2015, woodland and bareland coverages largest conversions of these LULC classes occurred mainly in
declined the most, particularly in the buffer area, NCA and the the buffer area, SNP and NCA (Figure 11). Despite the various
SNP. However, shrubland cover declined mainly in the NCA conversions, grassland was the most persistent cover type
but bareland cover contracted significantly in the buffer area followed by shrubland (Figure 10).
(Figure 9). Across the 1975-2015, the greatest transformations
Overall, during the entire period of assessment (1975-2015), occurred in grasslands followed by woodlands and shrublands.
decrease was more prominent for woodland followed by Much of the grassland was converted to shrubland while
shrubland. The greatest loss of woodland occurred in the considerable woodland was transformed to grassland and
buffer area and national park. Shrubland increased in the NP shrubland. Notably, most of the remaining LULC classes
but declined in the buffer area and GRs (Figure 9). showed little transformations below 2% (Figure 10). The
greatest transformations of grassland and woodland were
3.3. LULC Cover Change Trajectories (1975-2015) recorded for the buffer area, SNP and NCA. In addition, much
During the 1975-1995 period, substantial woodland was of the shrubland transformations occurred in the GCA and
converted to grassland and shrubland. Shrubland to grassland GRs (Figure 11). Shrubland was the second most persistent
and woodland. Likewise, other cover types, mainly grassland cover class during the 1975-2015 period (Figure 10).
were also converted to woodland and shrubland (Figure 10).
The conversions of woodland, shrubland and grassland to 4. Discussion
other cover types occurred mainly in the buffer area, NCA and
the NP (Figure 11). In the GCA, grassland registered the 4.1. LULC Cover Types
greatest conversion to other land cover types. Nevertheless, Throughout the 41 years of assessment from 1975-2015,
grassland, shrubland and woodland cover classes were the grassland, shrubland and woodland had the highest
most persistent whereas swamps and settlement the least proportions across the entire ecosystem and buffer area. The
persistent cover classes (Figure 10). high coverages of these land cover types in the protected areas,
During 1995-2015, shrubland and grassland underwent the especially in the SNP, NCA, GRs and LGCA, can be attributed
greatest conversion to other LULC types but little woodland mainly to their savanna characteristics and geological
was converted to other types. Much of the shrubland was formation [13, 61-63]. The volcanic hard pans extending from
converted to grassland while some grassland became the NCA westwards through the SNP favor grasslands, with
shrubland. Furthermore, substantial woodland cover was some areas towards the west supporting grasslands
transformed to shrubland and grassland (Figure 10). The interspersed with shrublands and woodlands. In the buffer area,American Journal of Remote Sensing 2020; 8(1): 1-19 13
the observed LULC cover changes can be attributed to Plains adjoining the Kenya’s Nairobi National Park in Kenya
anthropogenic activities, primarily agriculture, human [80, 81]. Our findings reinforce and expand upon these
settlement, fire and livestock grazing [64]. previous studies in this [12] and other ecosystems in Tanzania,
including in the Tarangire and Katavi ecosystems [12, 82, 83,
4.2. LULC Cover Change 109]. Furthermore, the expansion in agriculture at the expense
Across the ecosystem and its surrounding buffer area, of natural vegetation fits in a worrying contemporary
settlements, agriculture, grassland and water increased worldwide trend [74, 76-78, 84, 85-87, 88, 89].
throughout 1975-2015 at the expense of woodland cover. The decline in woodland cover throughout 1975-2015 in the
Bareland declined during the 1975-1995 but increased during ecosystem and buffer area was partly due to conversion of
the 1995-2015. During the 1975-2015 period, grassland woodlands to other cover types. Woodland vegetation is also
increased in all the protected areas unlike shrubland which cleared for agriculture and settlements, often resulting in
increased in the NP and GRs during 1975-2015. In contrast, shrubland and other cover types. The declining trends in
shrubland contracted in the GCA, where livestock grazing and woodland cover can amplify land degradation, soil erosion,
agriculture are practiced, and in the NCA where pastoralism is salinity and loss of quality [90], leading ultimately to wildlife
pursued along with wildlife conservation. The expansion of habitat degradation and loss. The striking decline in woodland
grassland and shrubland cover in the Serengeti is likely the cover in the buffer area portrays weak protection [68].
outcome of conversions from other cover types, particularly Woodland decline inside the protected areas was also
woodlands; herbivory (grazing and browsing) and fire [65, 66]. concurrent with increasing elephant numbers in the ecosystem
The increase in bareland coverage was coincident with human [91, 92]. Similar findings have been reported for other
population growth and the associated expansion of agriculture protected areas in Tanzania, including the Loliondo Game
and settlements, development of infrastructure and intense Controlled Area [11], Rungwa Game Reserve [93, 94], Ruaha
livestock grazing [8, 6]. National Park [94], Tarangire-Manyara ecosystem [95] and
The expansion in agriculture and settlements can be linked to the Selous wildlife corridor [74]. The African elephant also
human population growth and consequently increased demand often destroys woody vegetation in many African savanna
for more food and income in rural Tanzania. Agriculture is the ecosystems, including in Tanzania [96, 97, 91], Kenya [98, 99],
economic mainstay of the rural populations and a key source of Malawi [100], Zimbabwe [87], Botswana [101], as well as
national revenue and foreign exchange in Tanzania. The Ethiopia [102] and South Africa [103, 104]. Besides elephant
increase in settlements during the 1975-2015 was browsing, woodland declines in the Serengeti ecosystem have
contemporaneous with increased cultivation and bareland and been associated with frequent fires and wildebeest population
human population size inside the buffer area [12]. The growth [97]. The conversion of woodland to grassland or
expansion in settlement and agriculture in the ecosystem and shrubland can create habitats favorable to grazers and some
the buffer area can be linked not only to human population browsers but unfavorable to the elephants themselves [105,
growth but also to the 1974 villagization policy which involved 106] and to other browsers. This can reduce the diversity and
forceful resettlement of people in nucleated villages and the abundance of woodland-dependent species [99].
policy encouraged people to cultivate the land in order to ensure The increase in water bodies was concurrent with
to ensure food security and income for families [67, 68]. The increasing rainfall in the Mara-Serengeti ecosystem associated
expansion of cultivation between 1995 and 2015 was also partly with the intensification of the El Niño Southern Oscillation
driven by liberalization policies, such as the Promotion of (ENSO) [107] and the Indian Ocean Dipole [65]. The
Investment Policy of 1992 that advocated for expansion of increasing availability of water can fundamentally reshape
agriculture, and consequently clearing of natural vegetation wildlife and livestock abundance, distribution and movements
[67]. These policies also encouraged livelihood diversification, in the ecosystem [108]. A protracted drought spanning
for example, from pure pastoralism to agro-pastoralism among 1971-1975 [107] almost certainly reduced surface water
the Maasai of LGCA and NCA in northern Tanzania [69]. availability in the ecosystem in 1975.
However, agriculture has since then been banned to allow The increase in wetland/swamps between 1975 and 1995 is
habitat recovery in the NCA [6]. Furthermore, socio-economic associated with rapid land cover transformations. Thereafter
opportunities from tourism activities, livestock grazing and (1995-2015), wetland/swamps declined as land
agriculture attracted people to the lands adjacent to the transformation progressed. Similar declines in swamps with
protected areas [70-73] and accentuated LULC changes. The progressing land transformations have also been reported for
activities aggravate the vulnerability, degradation and loss of the Katavi National Park in Tanzania [109].
wildlife habitats [74], adversely affecting biodiversity Generally, the declines in land cover near the protected
conservation [12]. Similarly, tourism opportunities and land areas jeopardize conservation initiatives run in the Wildlife
suitability accelerated agricultural expansion in the adjoining management Areas (IKONA and Makao WMAs) and
Kenya’s Narok County [75]. Outreach programme or Community Conservation Services
The increase in settlements around the protected areas in the (CCS) in the SNP. The WMAs promote community
Serengeti ecosystem is similar to patterns observed elsewhere involvement in conservation through benefit-sharing schemes
[76-79], particularly in the pastoral ranches adjacent to the while reducing activities which are incompatible with
Masai Mara National Reserve [64] and in the Athi-Kaputiei conservation. The community-based conservation initiatives14 Hamza Khalid Kija et al.: Land Use and Land Cover Change Within and Around the Greater Serengeti Ecosystem, Tanzania are crucial to enlisting the support of local communities for Park in Tanzania [95] and in Chobe National Park in Botswana conservation and enforcing land use plans adjacent to [125]. protected areas. Otherwise, protected areas may act as push-factors or economic barriers to local communities [110]. 5. Conclusions and Recommendations 4.3. LULC Cover Trajectories This is the most comprehensive study of its kind for the The LULC change trajectories highlight dynamic Serengeti ecosystem and its surrounding buffer area. During transformations among different cover types. The largest the 41-year study period, LULC were classified into eight transformation across the ecosystem during 1975-2015 period types (bareland, agriculture, settlement, water, grassland, involved the conversion of grassland mainly to shrubland and shrubland, woodland and wetlands/swamps). Grassland, woodland in the buffer area. In contrast, within the protected shrubland and woodland cover dominated the ecosystem and areas, considerable conversion of grassland and woodland the buffer area throughout 1975-2015 period. The underlying occurred in the buffer area, SNP and the NCA during the local geomorphic template partly explains the dominant 1975-1995 period. Between 1995 and 2015, substantial areas of vegetation cover types, particularly in the SNP, NCA, GRs and grassland, shrubland and woodland were transformed to other in the LGCA. cover types in protected areas. The degree and type of land cover The ecosystem and its buffer area experienced substantial transformation varied across the protected areas and was most LULC changes between 1975 and 2015. Shrubland and pronounced in the national park and NCA for grassland, national grassland cover increased during the 1975-1995 period but park and GCA for shrubland and in the NCA and national park slightly during the 1995-2015 period. The expansion of for woodland. This partly reflects distinctions in the level of shrubland cover in the protected areas, especially in the NCA, protection and anthropogenic impacts across the protected areas. was partly due to strong government interventions, including Overall, large areas of grassland, woodland and shrubland were banning agriculture in the area in 2009. When Maasai converted in the Game Controlled Area, Wildlife Management pastoralists move from one place to another, their abandoned Areas and Game Reserves with lower protection status. settlements and livestock corrals (“bomas”) are typically The remarkable transformations of LULC in the ecosystem invaded by shrublands. Bareland, agriculture and settlement and buffer area were mainly associated with expansion of increased throughout the assessment period (1975-2015). settlements resulting from human population growth. Human Most changes in bareland and agriculture occurred in the activities have transformed significant natural vegetation buffer area whereas settlements expanded in the buffer, (including woodland) in the ecosystem into agricultural land WMAs and the Ngorongoro Conservation Area. and grasslands in the ecosystem [12, 111, 112]. Vegetation The contractions in LULC types mainly involved clearing for cultivation and settlement transforms woodland transformation from one type to another. Thus, there was into grassland, shrubland and other cover types [113]. The substantial conversion of woodland to grassland and conversion of grassland to agriculture is a widespread shrubland and from grassland to shrubland. The marked phenomenon in the SNP [112] and elsewhere, including conversions were largely caused by the growing demand for rangelands in the United States [114]. Specifically, browsing more food and other agricultural products to cater for the and rainfall interactions transformed shrubland to grassland in growing human population and respond to policies that the Maasai Mara ecosystem (1979-1998) in Kenya [98, 115]. emphasized expansion of agriculture. Human population Transformation of woodland to grassland is also marked in the growth in rural Tanzania is associated with increasing demand Maasai Steppe in the Tarangire-Manyara ecosystem in for land to cater for agriculture, settlements and livestock northern Tanzania [22, 109, 116]. grazing in rural Tanzania. The villagization policy of 1974 In addition, the transformations in the ecosystem and buffer also played a significant role in land cover change during area are partly due to fires. Fire partly drives woodland 1975-1995. Similarly, liberalization policies, such as the conversion to savannah and grassland not only in the Promotion of Investment Policy of 1992 and policies that Serengeti [117] but also in Kagoma Forest Reserve [118] in emphasized expansion of agriculture, and thus vegetation Tanzania and in South Africa [117, 119, 120], and to shrubland clearing for farms during 1995-2015. As a result, increasing in South Africa [121]. Herbivory and its interaction with human population size, settlements, farms and other rainfall can also transform woodland to grassland and other socio-economic activities drive the demand for more land and cover types [121, 119, 122]. For example, browsing-rainfall hence land cover transformation. On the other hand, fire, interactions transformed shrubland to grassland in the Maasai inside and outside the ecosystem, is another factor Mara in Kenya [98, 115]. Furthermore, elephant browsing accelerating woodland loss to savannah and grassland. The transformed woodland to grassland in Kruger National Park, LULC changes have important impacts on wildlife habitats South Africa [123]. Browsing by impala (Aepyceros and biodiversity conservation. Generally, more land cover melampus) and other medium-sized browsers was responsible conversions occurred in buffer areas and protected areas with for retarded woodland growth in the SNP [124]. Consequently, low protection status, notably the Game Controlled Areas and increase in numbers of browsers such as impala in the SNP [92] Wildlife Management Areas. might accelerate woodland loss. Browsing has also caused Land cover and land use mapping and change detection are woodland conversion to grassland in Lake Manyara National essential for effective ecological monitoring of changes,
American Journal of Remote Sensing 2020; 8(1): 1-19                                            15

enhancing timely and adaptive conservation interventions.           conduct the research work, Tanzania National Park
Conservation spatial planning and effective implementation of       (TANAPA), Ngorongoro Conservation Area (NCAA),
the plans are also crucial. For example, community-based            Tanzania Wildlife Management Authority (TAWA) and
conservation initiatives, such as establishment of Wildlife         Wildlife Management Area Authorities (WMAs) for granting
Management Areas, Forest Reserves (Village forest reserves,         access to their areas of jurisdiction for data collection. We
community forest reserves and private forest reserves) and          sincerely thank Ned Horning of the American Museum of
land use planning, and rangeland management) should be              Natural History, Centre for Biodiversity and Conservation, for
encouraged in the buffer area to regulate unsustainable             guidance on using his R coded Random Forest Script. We also
resource extraction, which adversely impacts conservation           thank Eivin Roskaft (NTNU), Robert Fyumagwa, Janemary
and human wellbeing. The Wildlife Conservation Act No. 5 of         Ntalwila, and Machoke Mwita (TAWIRI) and Nsajigwa Mbije
2009 and other related pieces of legislation (e.g., land, forest,   (SUA) for their support.
and water) should be effectively implemented. Environmental
and conservation policies should also be effectively
implemented to minimize vegetation loss in the ecosystem and        References
its buffer area. The declining vegetation cover in the buffer
area should be ameliorated by planting more indigenous tree         [1]   Phukan, P., Thakuriah, G., and Saikia, R., Land use land cover
                                                                          change detection using remote sensing and GIS techniques-A
species that can also provide fuel wood, building poles and               case study of Golaghat district of Assam, India. International
timber and relieve pressure on natural vegetation in the buffer           Research Journal of Earth Sciences, 2013. 1 (1): 11-15.
and protected areas.
   Generally, upgrading the protection status of conservation       [2]   Nduati, E. W., Mundia, C. N., and Ngigi, M. M., Effects of
                                                                          vegetation change and land use/land cover change on land
areas improves their conservation effectiveness in the                    surface temperature in the mara ecosystem. International
Serengeti ecosystem. The substantial loss of land cover in                Journal of Science and Research 2013. 2: 22-28.
areas of low protection status signifies the need to strengthen
conservation in such areas and their buffer zones. In addition,     [3]   Sala, O. E., Chapin, F. S., Armesto, J. J., Berlow, E.,
                                                                          Bloomfield, J., Dirzo, R., Huber-Sanwald, E., Huenneke, L. F.,
the recorded declining trends of the LULC types call for                  Jackson, R. B., and Kinzig, A., Global biodiversity scenarios
policies, conservation and management actions that are able to            for the year 2100. Science, 2000. 287 (5459): 1770-1774.
control fires, regulate land use and tree felling, promote
replanting trees and effectively manage elephant-tree               [4]   Hamilton, C. M., Martinuzzi, S., Plantinga, A. J., Radeloff, V.
                                                                          C., Lewis, D. J., Thogmartin, W. E., Heglund, P. J., and
interactions at high elephant densities. Equally important is             Pidgeon, A. M., Current and future land use around a
the formulation and effective implementation of sound                     nationwide protected area network. PLOS ONE, 2013. 8 (1):
policies and far-sighted spatial land use plans to safeguard the          e55737.
future integrity of such iconic ecosystems as the Serengeti and
                                                                    [5]   Kidane, Y., Stahlmann, R., and Beierkuhnlein, C., Vegetation
human wellbeing in their surrounding buffer zones.                        dynamics, and land use and land cover change in the Bale
                                                                          Mountains, Ethiopia. Environmental monitoring and
Author Contributions                                                      assessment, 2012. 184 (12): 7473-7489.
                                                                    [6]   Veldhuis, M. P., Ritchie, M. E., Ogutu, J. O., Morrison, T. A.,
   HK, EN, MS and JK conceptualized and designed the                      Beale, C. M., Estes, A. B., Mwakilema, W., Ojwang, G. O.,
research, HK collected the data, HK, EN, MS and JO and                    Parr, C. L., Probert, J., Wargute, P. W., Hopcraft, J. G. C., and
analyzed the data, and drafted the manuscript, MS, EN and JK              Olff, H., Cross-boundary human impacts compromise the
supervised the research work, EN, MS, JO, JK, LM, BJ, BG,                 Serengeti-Mara ecosystem. Science, 2019. 363 (6434):
and FV reviewed and edited the manuscript for critical                    1424-1428.
intellectual content.                                               [7]   Sinclair, A. R. E. and Arcese, P., Serengeti II: dynamics,
                                                                          management, and conservation of an ecosystem. Vol. 2. 1995:
                                                                          University of Chicago Press.
Funding
                                                                    [8]   Kideghesho, J. R., Nyahongo, J. W., Hassan, S. N., Tarimo, T.
   This research work is a part of the Ph. D study of HKK and             C., and Mbije, N. E., Factors and ecological impacts of wildlife
was funded by the European Union’s Horizon 2020 research                  habitat destruction in the Serengeti ecosystem in northern
and innovation grant number 641918 through the                            Tanzania. African Journal of Environmental Assessment and
AFRICANBIOSERVICES PROJECT and by the FRIEDKIN                            Management, 2006. 11: 17-32.
CONSERVATION FUND (FCF). JOO was also supported by                  [9]   Campbell, K. and Borner, M., Population trends and
a grant from the German National Research Foundation (DFG;                distribution of Serengeti herbivores: implications for
Grant # 257734638).                                                       management. Serengeti II: Dynamics, management, and
                                                                          conservation of an ecosystem, 1995: 117-145.

Acknowledgements                                                    [10] Kija, H. K., Ogutu, J. O., Mangewa, L. J., Bukombe, J., Verones,
                                                                         F., Graae, B. J, Kideghesho, J. R., Said, M. Y., and Nzunda, E. F.,
  We thank the Tanzanian Wildlife Research Institute                     Spatio-Temporal Changes in Wildlife Habitat Quality in the
(TAWIRI) for granting study leave and permission to HKK to               Greater Serengeti Ecosystem. Sustainability, 2020. 12 (6): 1-18.
16 Hamza Khalid Kija et al.: Land Use and Land Cover Change Within and Around the Greater Serengeti Ecosystem, Tanzania
[11] Mayunga, S. D., Monitoring of Land Use/Cover Change Using [26] Ogutu, J. O., Piepho, H. P., Dublin, H. T., Bhola, N., and Reid,
Remote Sensing and GIS techniques: A case study of Loliondo R. S., Rainfall influences on ungulate population abundance in
Game Controlled Area, Tanzania. Trends Journal of Sciences the Mara-Serengeti ecosystem. J Anim Ecol, 2008. 77 (4):
Research, 2018. 3 (1): 18-32. 814-29.
[12] Estes, A. B., Kuemmerle, T., Kushnir, H., Radeloff, V. C., and [27] Herlocker, D. J., Structure, composition, and environment of
Shugart, H. H., Land-cover change and human population some woodland vegetation types of the Serengeti National Park,
trends in the greater Serengeti ecosystem from 1984–2003. Tanzania. 1976: Herlocker.
Biological Conservation, 2012. 147 (1): 255-263.
[28] Gottschalk, T. K., Ekschmitt, K., and Bairlein, F., Relationships
[13] Reed, D. N., Anderson, T. M., Dempewolf, J., Metzger, K., and between vegetation and bird community composition in
Serneels, S., The spatial distribution of vegetation types in the grasslands of the Serengeti. African journal of ecology, 2007.
Serengeti ecosystem: the influence of rainfall and topographic 45 (4): 557-565.
relief on vegetation patch characteristics. Journal of
Biogeography, 2009. 36 (4): 770-782. [29] Thirgood, S., Mosser, A., Tham, S., Hopcraft, G., Mwangomo,
E., Mlengeya, T., Kilewo, M., Fryxell, J., Sinclair, A. R. E., and
[14] Byrom, A. E., Nkwabi, A. J., Metzger, K., Mduma, S. A., Borner, M., Can parks protect migratory ungulates? The case of
Forrester, G. J., Ruscoe, W. A., Reed, D. N., Bukombe, J., the Serengeti wildebeest. Animal Conservation, 2004. 7 (02):
Mchetto, J., and Sinclair, A., Anthropogenic stressors influence 113-120.
small mammal communities in tropical East African savanna at
multiple spatial scales. Wildlife Research, 2015. 42 (2): 119-131. [30] Chander, G., Markham, B. L., and Helder, D. L., Summary of
current radiometric calibration coefficients for Landsat MSS,
[15] Serneels, S., Said, M., and Lambin, E., Land cover changes TM, ETM+, and EO-1 ALI sensors. Remote sensing of
around a major east African wildlife reserve: the Mara environment, 2009. 113 (5): 893-903.
Ecosystem (Kenya). International Journal of Remote Sensing,
2001. 22 (17): 3397-3420. [31] Pons, X., Pesquer, L., Cristóbal, J., and González-Guerrero, O.,
Automatic and improved radiometric correction of Landsat
[16] Sinclair, A., Hopcraft, J. G. C., Olff, H., Mduma, S. A., Galvin, imagery using reference values from MODIS surface
K. A., and Sharam, G. J., Historical and future changes to the reflectance images. International Journal of Applied Earth
Serengeti ecosystem. Serengeti III: Human impacts on Observation and Geoinformation, 2014. 33: 243-254.
ecosystem dynamics, 2008: 7-46.
[32] Young, N. E., Anderson, R. S., Chignell, S. M., Vorster, A. G.,
[17] Sinclair, A., Packer, C., Mduma, S. A., and Fryxell, J. M., Lawrence, R., and Evangelista, P. H., A survival guide to
Serengeti III: human impacts on ecosystem dynamics. 2009: Landsat preprocessing. Ecology, 2017. 98 (4): 920-932.
University of Chicago Press.
[33] Chavez, P. S., Image-based atmospheric corrections-revisited
[18] Estes, A. B., Using remote sensing to uncover the drivers of and improved. Photogrammetric engineering and remote
land-cover change and elephant habitat use in the Serengeti sensing, 1996. 62 (9): 1025-1035.
ecosystem. Unpublished Thesis for Award of PhD Degree at
University of Virginia, United States of America. 2012. pp. 152. [34] Franklin, S. E. and Giles, P. T., Radiometric processing of
aerial and satellite remote-sensing imagery. Computers &
[19] Fryxell, J. M., Wilmshurst, J. F., and Sinclair, A. R., Predictive Geosciences, 1995. 21 (3): 413-423.
models of movement by Serengeti grazers. Ecology, 2004. 85
(9): 2429-2435. [35] Amro, I., Mateos, J., Vega, M., Molina, R., and Katsaggelos, A.
K., A survey of classical methods and new trends in
[20] Gottschalk, T. K., Ekschmitt, K., and Bairlein, F., A GIS-based pansharpening of multispectral images. EURASIP Journal on
model of Serengeti grassland bird species. Ostrich-Journal of Advances in Signal Processing, 2011. 2011 (1): 79.
African Ornithology, 2007. 78 (2): 259-263.
[36] Pons, X. and Solé-Sugrañes, L., A simple radiometric
[21] Kikula, I. S., Policy Implications on Environment. The Case of correction model to improve automatic mapping of vegetation
Villagization in Tanzania. 1997, DUP (1996) LTD, University from multispectral satellite data. Remote sensing of
of Dar es Salaam, Tanzania. Environment, 1994. 48 (2): 191-204.
[22] Msoffe, F. U., Said, M. Y., Ogutu, J. O., Kifugo, S. C., De [37] Riaño, D., Chuvieco, E., Salas, J., and Aguado, I., Assessment
Leeuw, J., Van Gardingen, P., and Reid, R., Spatial correlates of of different topographic corrections in Landsat-TM data for
land-use changes in the Maasai-Steppe of Tanzania: mapping vegetation types (2003). IEEE Transactions on
Implications for conservation and environmental planning. geoscience and remote sensing, 2003. 41 (5): 1056-1061.
International Journal of Biodiversity and Conservation, 2011. 3
(7): 280-290. [38] Shepherd, J. and Dymond, J., Correcting satellite imagery for
the variance of reflectance and illumination with topography.
[23] Leyaro, V. and Morrissey, O., Expanding agricultural International Journal of Remote Sensing, 2003. 24 (17):
production in Tanzania. 2013. 3503-3514.
[24] Mtui, D. T., Evaluating landscape and wildlife changes over [39] Jensen, J. R., Thematic information extraction: Image
time in Tanzania's protected areas. 2014, classification. Introductory Digital Image Processing: A
[Honolulu]:[University of Hawaii at Manoa],[December 2014]. Remote Sensing Perspective, 1996: 197-256.
[25] Norton-Griffiths, M., Herlocker, D., and Pennycuick, L., The [40] Ekstrand, S., Landsat TM-based forest damage assessment:
patterns of rainfall in the Serengeti ecosystem, Tanzania. correction for topographic effects. Photogrammetric
African Journal of Ecology, 1975. 13 (3-4): 347-374. Engineering and Remote Sensing, 1996. 62 (2): 151-162.You can also read