Last but not least last mile of people & services - The Swedish industrial market 2022 - Cision
←
→
Page content transcription
If your browser does not render page correctly, please read the page content below
Annual research report
The Swedish industrial
market 2022

        Last but
        not least
        last mile of people
        & services.
TABLE OF CONTENT
                 Introduction             3

           1 | Overview                   7

          2 | Stockholm & Uppsala        14
                Introduction             15
                Stock- & vacancy data    17
                Rental levels            20
                The transaction market   21

       3 | Gothenburg & Borås            23
           Introduction                  24
           Stock- & vacancy data         25
           Rental levels                 27
           The transaction market        28

    4 | Skåne & Halmstad                 31
        Introduction                     32
        Stock- & vacancy data            33
        Rental levels                    36
        The transaction market           37

 5 | Conclusions                         39

6 | Croisette                            41

                          2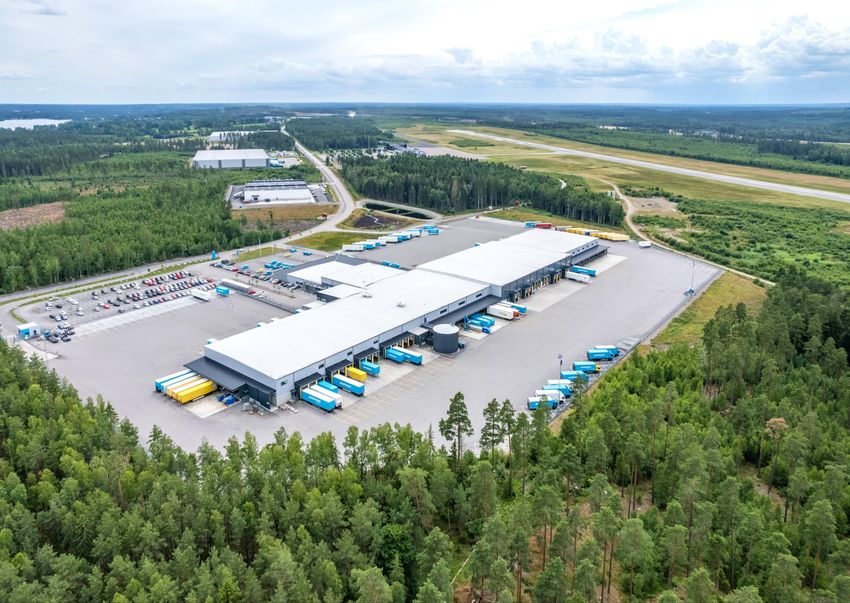
INTRODUCTION

Strong interest for industrial properties - nationwide

                                      Croisette has for several years surveyed the industrial       consumption patterns because of the pandemic. On
                                      market in Sweden, focusing on Greater Stockholm,              the other hand, Croisette believes that the discussion
                                      Skåne and Gothenburg. For this year’s research                on "last mile delivery" should be extended to "people
                                      report, Croisette has also included several regional          and services" for two main reasons. One is that
                                      cities that are becoming an increasingly attractive           people’s expectations increases in terms of flexibility
                                      option both from a tenant perspective, but also from          and availability of services in a similar way that we see
                                      an investor perspective. The full report covers a total       higher demands for delivery of products. The demand
                                      of 42,500,000 sq m spread across 379 different                for quick feedback and assistance on service issues is
                                      industrial areas with a total of 11,100 properties.           increasing as people expect to have to wait less time
                                                                                                    for repairers and other providers of services and
                                      Our survey shows that the segment is strong despite
                                                                                                    products. This calls for service providers to establish
                                      uncertainties about the future. On an aggregate level,
                                                                                                    themselves in proximity, and with quick access, to large
                                      the overall vacancy rate in the industrial areas surveyed
                                                                                                    parts of the population. This often means that
                                      is 3.2%. The lack of suitable and flexible premises has
                                                                                                    operators need to be close to the city centre to reach
                                      led us to observe strong rental growth in both
                                                                                                    their costumers fast. The second reason is linked to
                                      established and less established industrial areas for
                                                                                                    people's changing behavioral patterns and desire for
                                      several years. The segment has attracted increasingly
                                                                                                    flexibility in their daily lives.
                                      intense interest from the investor market, with both
                                      existing and new entrants to the market competing for         Croisette argues that the effects of the pandemic will
                                      the properties on offer. This has resulted in a clear yield   change the way we live, work and operate in our society
                                      compression during the year where we have noted               in general, which also will change the shape of our
                                      several record sales.                                         areas of activity. Our view is that office and business
                                                                                                    space will remain an essential component of the city,
                                      This report will also aim to highlight the concept of "last
                                                                                                    but we believe that stakeholders need to be prepared
                                      mile delivery" with focus on "last mile delivery of people
                                                                                                    for transformation. According to several surveys,
                                      and services". We believe that the focus so far largely
                                                                                                    employees have appreciated the flexibility that working
                                      has been on the last mile delivery of e-commerce
                                                                                                    from home provides, adding value to their lives outside
                                      goods, which of course is an important market,
                                                                                                    of work.
                                      particularly in relation to the change in people's

                                                         3
Industrial properties – the vital link in the ”last-mile”-chain

This is something we believe will be demanded by                      evident, with the layout and design of the properties
employees to a greater extent than before. Croisette                  playing an important role in the future.
believes that the pandemic has contributed to a more
                                                                      This   is    a     comprehensive       report   describing
demanding workforce, where shorter commutes thanks
                                                                      developments in the regions concerned at a general
to shorter distances to and from home will be a main
                                                                      level. If you are interested in a deeper dive into a
priority.   Croisette   therefore   believes   that   the
                                                                      specific region, an individual area, or have any
opportunity for tenants to establish high-quality offices
                                                                      questions about the content of the report, please
in central business areas outside the city centre, with
                                                                      contact one of us and we will be happy to share our
good public and car transport links, will become
                                                                      findings with you.
increasingly attractive.
                                                                      Happy reading!
It is in the wake of these discussions that we believe
the importance of industrial areas in the general
community development will become increasingly

       David Almqvist                  Joakim Grunditz                Andreas Larsson                  Cassandra Steffensen
       Co-head of Transactions         Head of Transactions           Senior Associate                 Associate
                                       Gothenburg                     Malmö                            Stockholm

       david.almqvist@croisette.se     joakim.grunditz@croisette.se   andreas.larsson@croisette.se cassandra.steffensen@croisette.se
       +46 (0) 728 85 30 80            +46 (0) 790 67 06 59           +46 (0) 735 36 88 39         +46 (0) 763 48 26 80

                                                                                                         4
Last mile of people and services

                                   An urgent need for centrally                                increase significantly in the coming years. To cope with

                                   located freight handling                                    this, urban development needs to take greater account
                                                                                               of this in the further design of cities. What can be
                                   As an increasing proportion of the population becomes       concluded by observing the current situation is that we
                                   urbanized, urban population growth will accelerate.         are seeing a very significant shortage of buildable land,
                                   This combined with the fact that e-commerce                 leading to a demand that is growing faster than the
                                   continues to grow at a rate that seems to suggest there     supply. This creates falling vacancies and consequent
                                   is no stopping it, means that the most likely scenario is   strong rental growth which are spreading outside of the
                                   that the amount of freight flowing into cities will         metropolitan areas as well.

                                   Access to local services                                    who occupy the area, it may still not be quite as

                                   increasingly important in the                               attractive as we think such areas have the potential to
                                                                                               be. Therefore, real estate owners, investors and urban
                                   design of new workplaces                                    planners need to consider the impact local services will
                                   In addition to what has been said above, the access of      have on the overall dynamic of the area in order to
                                   services in a local area also needs to be considered. It    attract strong tenants that will be able to contribute to
                                   can be any number of fine buildings, but if employees       the area.
                                   do not have access to restaurants, exercise facilities,
                                   shops and other local services that add value to those

                                   The design is an important                                  offering employees an office space closer to home and

                                   factor in newly built business                              creating synergies together with their production staff.
                                                                                               Companies can gain from this as they will be able to
                                   premises                                                    cut the cost of premises. However, this requires a new
                                   We expect that companies will increasingly choose to        way of thinking, where the product on offer should be
                                   locate in central industrial areas, especially companies    able to compete with high quality office space in more
                                   that have previously had different locations for            central locations. Examples of such a solution are
                                   production and administration. We believe these             shown on the following page..
                                   companies can benefit from being in industrial areas

                                                     5
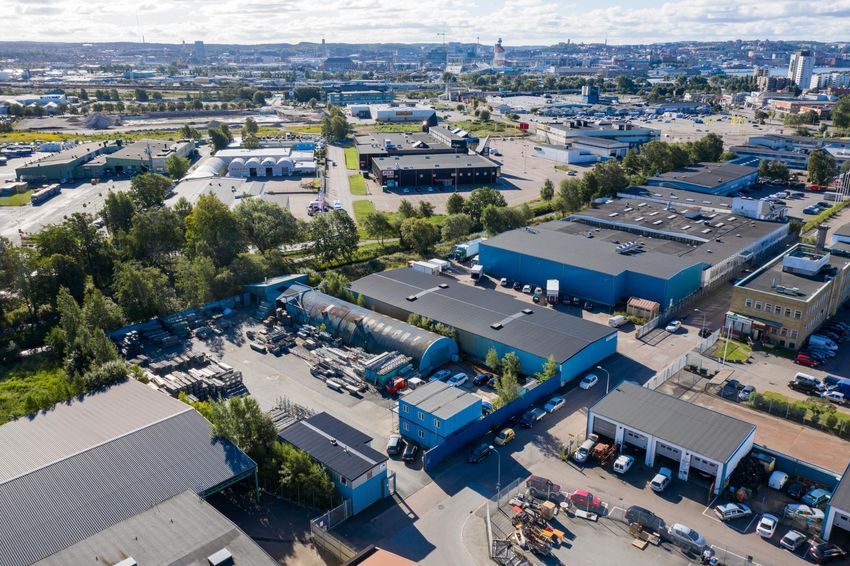
High quality design – an example

                            Built by LW Sverige AB in Ältaberg, Stockholm

                                                                            6
1   OVERVIEW

      7
OVERVIEW
Overview The industrial stock in Sweden
The table on the left lists the municipalities and regions
Vacancy Vacancy Vacancy
Total area(1)(2)(3), where Croisette has surveyed the industrial market.
Municipality/Region rate(2)(4), rate(2)(4), rate(2)(4),
sq m
Q1 2022 Q3 2021 Q3 2020
The results of the survey are presented in detail on
1 Eskilstuna 1,329,898 2.7 % 5.0 % n/a
page 10-11 for the three metropolitan regions,
2 Jönköping 2,475,170 1.5 % 2.7 % n/a Stockholm (including parts of Uppsala County),
3 Linköping 1,000,235 3.2 % 3.4 % n/a Gothenburg (including Borås) and Skåne (including
4 Norrköping 1,558,081 3.6 % 2.2 % n/a Halmstad).
5 Nyköping 365,950 0.4 % 1.3 % n/a
In all metropolitan areas and regional cities, the
6 Västerås 1,272,467 1.9 % 2.5 % n/a
vacancy rates are remarkably low. In all three
7 Växjö 931,748 3.3 % 3.4 % n/a
metropolitan areas, vacancy rates are down compared
8 Örebro 1,756,337 2.1 % 3.7 % n/a
to autumn 2020. In the autumn of 2021, the vacancy
9 rate on an aggregate level was measured to 3.5% and
Greater Stockholm 12,009,770 3.4 % 3.7 % 4.3 %
before that in 2020, it was measured to 4.5%. In
10 Greater Skåne 7,888,007 3.8 % 3.5 % 4.7 %
January 2022, the aggregate vacancy rate is 3.2%, with
11 Greater Gothenburg 12,122,969 3.4 % 3.6 % 4.6 %
the rate in the regional cities at 2.4% and the
TOTAL 42,710,632 3.2 % 3.5 % 4.5 % metropolitan areas at 3.5%. However, it should be
added that vacancy rates in regional cities are more
sensitive to minor changes as the total stock in these
Vacancy rates(2)(4), cities is only one third of the total stock in the
Q3 2020 – Q1 2022
metropolitan regions. The current vacancy rate in the
6 6%
1 9 regional cities is thus more dependent on coincidence
8 5%
5 4%
at the time of measurement than in the large cities.
4
3
3% The overall picture of the industrial market in the
11 2 2% central and southern parts of the country is that the
1% demand is very high with a declining trend in a majority
7 0% of the areas surveyed.
10
Q3 2020
Note: Q3 2021
1) Refers to properties located in industrial areas in the regions surveyed, of which at least 50% of the area is assessed as industrial property (400 series).
Also includes manually entered terminal buildings (type code 829) Q1 2022
2)
3)
Source: Croisette, Datscha, Objektvision
Taxed assessment years: 2019-2020
8
4) Does not include project vacancies
OVERVIEW

        Vacant premises (1)(2) Distribution by size, sq m

                                                                                               The graphs on the left illustrate the distribution of
                            Eskilstuna              Jönköping      Linköping                   vacant space between different sizes of premises for
                                                                                               regional cities, the metropolitan regions are presented
                                                                                               in detail on page 11. There are two larger vacant
                                                                                               industrial premises in Eskilstuna and Norrköping of
                                                                                               18,000 sq m respectively 27,236 sq m, which have a
                                31,328 sq m          28,609 sq m    18,714 sq m
                                                                                               strong   impact    on   the   percentage    distribution.
                                                                                               Otherwise, there are only 5 respectively 15 vacant
                                                                                               industrial premises in Eskilstuna and Norrköping. Most
                                                                                               small premises (between 0 – 499 sq m) are found in
                                                                                               Västerås and Örebro, 17 and 16, respectively.
                           Norrköping               Nyköping       Västerås                    In all municipalities there are a total of 140 vacant
                                                                                               premises in the industrial areas, of which 2 are larger
                                                                                               than 10,000 sq m and a total of 73 are smaller than
                                                                                               499 sq m. In total, 90% of the vacant premises, by
                                                                                               number, are units of 3,000 sq m or less. In general, it
                                  48,925 sq m         467 sq m      17,135 sq m
                                                                                               can be said that the smaller premises tend to be more
                                                                                               attractive and the premises that are currently vacant
                                                                                               should be rented out relatively quickly again. Especially
                                                                                               given the low level of vacancy in each municipality,
                                                                                               which indicates a high level of demand from tenants.
                                    Växjö            Örebro               > 10 000 sq m

                                                                          9,999 – 5,000 sq m

                                                                          4,999 – 3,000 sq m

                                 13,753 sq m         23,043 sq m          2,999 – 1,000 sq m

                                                                          999 – 500 sq m

                                                                          499 – 0 sq m

Note:
1)       Source: Croisette, Datscha, Objektvision
                                                                         9
2)       Does not include project vacancies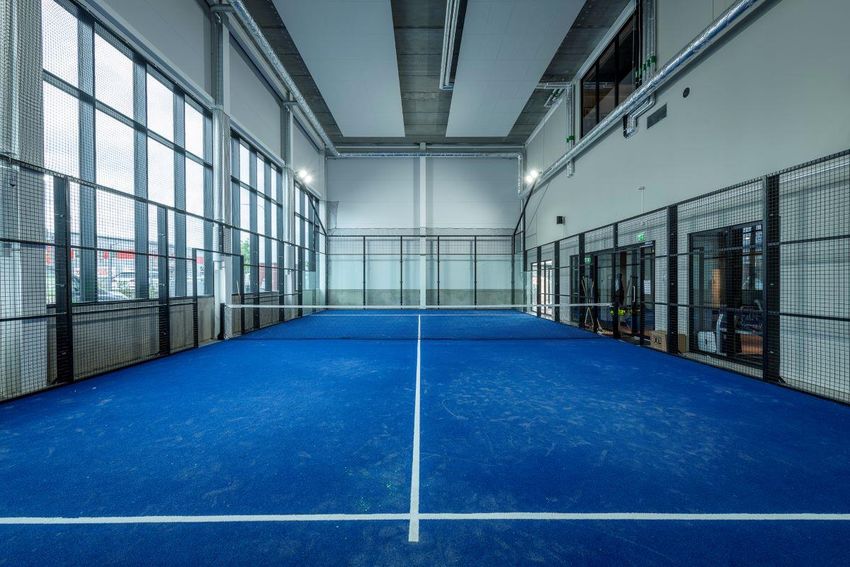
OVERVIEW

        Overview Stockholm, Gothenburg and Skåne(1)(2)(3)

                  Stockholm region, incl. Uppsala                                                      Stockholm region’s 5 largest industrial areas
                   Number of industrial areas                     132                                  Industrial area                                          Municipality                  Vacancy Q1 2022, % (2021)                   Size, sq m

                   Number of municipalities                       30                                   Jordbro                                                  Haninge                                        9.7 % (2.1 %)                688,843
                   surveyed
                                                                                                       Scania/Södra industrial area                             Södertälje                                     1.4 % (1.5 %)                634,022
                   Number of properties                           3,608
                                                                                                       Rosersberg                                               Sigtuna                                      4.7 % (10.5 %)                 479,286
                   Total industrial stock, sq m                   12,009,770
                                                                                                       Arlanda stad                                             Sigtuna                                        2.6 % (8.8 %)                386,606
                   Vacancy rate in the region                     3.4 %
                                                                                                       Veddesta                                                 Järfälla                                       3.5 % (3.7 %)                384,116

                  Gothenburg region, incl. Borås                                                       Gothenburg region’s 5 largest industrial areas
                   Number of industrial areas                     133                                  Industrial area                                          Municipality                  Vacancy Q1 2022, % (2021)                   Size, sq m

                   Number of municipalities                       11                                   Sörred industrial area                                   Gothenburg                                     1.6 % (1.6 %)              1,221,415
                   surveyed
                                                                                                       Viared                                                   Borås                                          2.0 % (3.2 %)                858,940
                   Number of properties                           2,987
                                                                                                       Arendal industrial area                                  Gothenburg                                     1.2 % (0.8 %)                701,620
                   Total industrial stock, sq m                   12,122,969
                                                                                                       Backa industrial area                                    Gothenburg                                     7.7 % (1.1 %)                652,078
                   Vacancy rate in the region                     3.4 %
                                                                                                       Högsbo industrial area                                   Gothenburg                                     3.8 % (7.0 %)                499,718

                  Skåne region, incl. Halmstad                                                         Skåne region’s 5 largest industrial areas
                   Number of industrial areas                     55                                   Industrial area                                          Municipality                  Vacancy Q1 2022, % (2021)                   Size, sq m

                   Number of municipalities                       6                                    Fosieby industrial area                                  Malmö                                          5.6 % (4.2 %)                749,961
                   surveyed
                                                                                                       Berga industrial area                                    Helsingborg                                    3.2 % (4.1 %)                382,022
                   Number of properties                           2,008
                                                                                                       Östra Hamnen                                             Malmö                                        8.9 % (12.0 %)                 377,167
                   Total industrial stock, sq m                   7,888,007
                                                                                                       Planteringen                                             Helsingborg                                    2.9 % (3.1 %)                362,586
                   Vacancy rate in the region                     3.8 %
                                                                                                       Hamnen                                                   Halmstad                                       1.3 % (1.2 %)                312,398

Note:
1)       Refers to properties located in industrial areas in the regions surveyed, of which at least 50% of the area is assessed as industrial property (400 series). Includes also manually entered terminal buildings (type code 829)
2)       Source: Croisette, Datscha, Objektvision                                                                                                                  10
3)       Taxed assessment year 2019-2020
OVERVIEW
Vacant premises (1)(2) Distribution by size and use
Distribution of vacant space,
The graphs on the left illustrate the distribution of
vacant space between different uses and sizes of
Per usage premises in the metropolitan regions.
Stockholm
We can conclude that there is no major difference
between the metropolitan regions in terms of use. In
Gothenburg, however, there seems to be a slightly
higher proportion of offices that are vacant. Skåne
Gothenburg
stands out in terms of size. In Stockholm and
1,115,025
sq m Gothenburg, a higher proportion of larger units over
10,000 sq m are vacant. Overall, we see that Stockholm
Industrial/Warehouse
and Skåne have around 50 % of their vacancies in
premises larger than 3,000 sq m, while in Gothenburg
Skåne
Office
this proportion is slightly higher.
Store
In general, smaller premises are considered more
attractive than larger ones and the probability that
Distribution of vacant space, more of the smaller premises are rented and replaced
Per usage by other similar vacant premises at the time for a new
measurement is relatively high. Thus, about half of the
Stockholm
current vacancies are considered slightly more difficult
> 10,000 sq m to let. However, this should be taken into account in the
context, and thanks to the current remarkably low
9,999 – 5,000 sq m vacancy rates, the situation is rather unproblematic
Gothenburg
775,529 from a risk perspective.
sq m 4,999 – 3,000 sq m
2,999 – 1,000 sq m
999 – 500 sq m
Skåne
499 – 0 sq m
Note:
1) Source: Croisette, Datscha, Objektvision
11
2) Does not include project vacanciesOVERVIEW
The transaction market Ongoing yield compression
The transaction volume in 2021 offered a record year, Transaction volume 2018-2021(1), breakdown by segment Transaction volume 2018-2021(1), industrial/logistics
which also applies to the industrial and logistics Bn SEK SEK/sq m
100% 70 16,000
segment. Since 2018, the average price per square 90%
60 14,000
metre has almost doubled. This is primarily driven by a 80%
12,000
clear yield compression because of a high expectation 70% 50
10,000
for continued rental growth. Furthermore, property 60%
40
50% 8,000
values are driven by a high inflow of strong domestic
30
40% 6,000
and cross-border investors, both existing and new.
30% 20
4,000
Particularly interesting is that in 2021 we noted a 20%
10 2,000
significant increase in the total volume of portfolio 10%
0% - 0
deals in the segment, including Castellum's acquisition 2018 2019 2020 2021 2018 2019 2020 2021
of Kungsleden, Corem's acquisition of Klövern and
Transaction volume, share of other segments Average purchase price, SEK/sq m
Blackstone's acquisition from Castellum. These three
Transaction volume industrial, warehouse & logistics Transaction volume industrial, warehouse & logistics
portfolio deals represent just over SEK 33 billion,
representing almost 57% of the total transaction
Transaction volume 2018-2021(1), portfolio and individual Transaction volume 2018-2021(1), portfolio and
volume in the industrial and logistics segment. real estate transactions among industrial/logistics transactions individual real estate transactions among industrial/logistics
Croisette's assessment is that the market shows a Bn SEK transactions
60 100%
clear strength, especially in portfolio deals. In recent
90%
portfolio transactions, a clear portfolio premium is 50 80%
noted, which is primarily driven by new investors 70%
40
looking to set up a strong and competitive platform, but 60%
also to actualize the, in many cases, unused potential. 30 50%
This trend should mean that we in 2022 will see more 40%
20
30%
large portfolios on the market, as it is likely that many
20%
investors will see an opportunity to realize the recent 10
10%
value growth. - 0%
2018 2019 2020 2021 2018 2019 2020 2021
Individual properties Individual properties
Portfolio Portfolio
12
Note:
1) Includes transactions over SEK 40m where the purchase price is known.OVERVIEW
The transaction market | New players entering
During the 2021, we have seen several new investors Transaction volume 2018-2021(1), breakdown by sub-
that has entered the market, and many of them has segments
100%
been particularly active with acquisitions. 90%
80%
One such example is Invela Fastigheter, funded by
70%
NREP, that was founded in 2020. The company made
60%
its first acquisition in 2021 when it acquired city
50%
logistics in Uppsala for just over 16,200 SEK/sq m. 40%
Several other acquisitions has been made in the 30%
Stockholm region in addition to that. 20%
10%
Areim has been able to acquire at a rapid pace during
0%
the 2021. The properties acquired have mainly been in 2018 2019 2020 2021
strong strategic locations in Greater Stockholm.
Industrial & warehouse
Whilst many of the new investors has targeted greater Logistics
Stockholm, Stendörren is one company that has
broadened their scope and has expanded their target Transaction volume 2021, breakdown by buyer & seller
category
new regions in Sweden but also rest of the Nordics.
High net worth individual
During last year Blackstone, through Mileway, Other investors(2)
Institutional investors
continued their high pace of acquisitions in Sweden.
Syndication Society
Besides a few large signature deals they have also Core real estate funds
been active in smaller single asset deals. State and municipalities
Construction companies
Furthermore, Odd Molly has announced its new Private real estate companies
company name, Logistea, and has since stepped up its Opportunistic real estate funds
Value add real estate funds
pace of acquisitions across Sweden. Oscar Properties,
Listed real estate companies
SLP and Randviken is other examples of a companies
-60% -40% -20% 0% 20% 40% 60%
that expanded its operations in the industrial and
logistics segment in 2021. Divestments
Acquisition
Note:
1) Refers to transactions over SEK 40 million
2) In 2021, Castellum acquired Kungsleden and Corem acquired Klövern, which affects
the proportional share of the category ”Other investors”.
132 STOCKHOLM
14STOCKHOLM & UPPSALA | INTRODUCTION
Lack of buildable land encourages creative solutions
Last year, Croisette noted that vacancy rates in problem of rising demand in city locations. One
Stockholm and Uppsala were remarkably low, and example of this is Corem's establishment of MTAB's
this year is no exception. In autumn 2020 the vacancy warehouse in Järfälla, which was awarded Logistics
was measured to 4.3%, in autumn 2021 it had Establishment of the Year 2021. The establishment
decreased to 3.7% and in January 2022 the vacancy shows how city-centre logistics can be designed in the
rate further declined to 3.4%. Croisette continues to future to make use of city-centre land. The building is a
see rising rental levels on new leases and continued 25-metre high state-of-the-art three-storey warehouse
record levels of yield requirements, both for equipped with three high-speed goods lifts. Another
individual properties but especially for portfolio example is Fastpartner's planned development in
deals. Västberga, where the intention is to combine office
development with industrial development. In Västberga,
A trend that has been ongoing for some years is that
office buildings are planned next to the streets and
areas around the city centre are being converted from
industrials in the inner courtyard. The courtyard will
industrial use to other uses such as housing, offices
provide access to and from the street area as well as
and retail. We are seeing industrial areas in peri-urban
for loading and unloading large lorries. This is an
areas being converted and according to Croisette's
example that clearly shows the possibility of combining
survey, it is estimated that 10-15 % of existing stock will
high quality office buildings with appropriate industrial
be converted in the long term. In Stockholm, Croisette
premises in a way that fulfils the vision of a mixed city
has noted for several years that the strongest growth is
that is often pursued in local authority master plans. In
taking place on the outskirts of the county. However,
addition to building on height and combining different
we also note an increasing need for industrial areas to
types of premises in the ways described earlier, there
be located closer to the city centre. This is to ensure
may be opportunities to use basement floors in the city
flexible and reliable deliveries of services and products
more efficiently or to find a system where operators co-
to a growing population with increasingly demanding
locate and co-transport their goods more effectively.
customers. We are starting to see the results of this
now and have done so for a couple of years, the lack of At the same time, we are also seeing strong rental
appropriate, modern and flexible premises near the city growth in more peripheral areas of Stockholm County
means that we have seen and continue to see strong as companies that were previously established in
rental growth in these areas. conversion areas seeking a new location and is
sometime forced to move further from the city centre.
In Stockholm, we see more examples of actors being
forced to think creatively and find solutions to the
15Portfolio deals accelerates the yield compression
These companies often tend to be more willing to pay a In the transaction market, the year has seen significant
slightly higher rent as the rents closer to the city is yield compression, which is driven primarily by an
generally higher. Examples of such areas include increased inflow of strong investors who have shown a
Brunna, Moraberg, Jordbro and Arlanda City. In these growing interest in the light industrial segment. During
areas, or in close proximity to them, we are also seeing the year, we have seen several portfolio transactions
strong growth in total stock, which means that the that have clearly surpassed the previous all-time low
product on offer is more likely to be newly built. In yields in this segment. We expect that this also will
general, there is a higher willingness to pay for newly have an immediate effect on single-asset yields during
produced premises as these are more modern, flexible 2022. Croisette also believes that we will continue to
and fit for purpose than alternative premises in the see further yield compression for high quality portfolio
area. The addition of the new premises helps to deals given the high interest for light industrial and
increase the overall attractiveness of the area and urban logistics.
therefore also raises the general level of rents in each
area.
Happy reading!
David Almqvist Cassandra Steffensen
Co-head of Transactions Associate
Stockholm
david.almqvist@croisette.se cassandra.steffensen@croisette.se
+46 (0) 728 85 30 80 +46 (0) 763 48 26 80
16STOCKHOLM & UPPSALA | STOCK- & VACANCY DATA
Industrial stock Development 2020-2021 in Stockholm(1)(2)
In the 2021 survey, the total industrial stock amounted
to 12,010,000 sq m (Stockholm County + the
municipalities of Uppsala, Enköping, Håbo and
Knivsta). From the previous survey in 2020, the stock
has grown by around 109,124 sq m, which corresponds
to a net percentage change of 0.9 % across the region.
However, if we look at the development in each
municipality, this development looks different. In the
periphery of the county, we see a continued growing
stock. The absolute strongest growth is recorded in
Sigtuna (6.9 %), followed by Södertälje (4.0 %), Järfälla
(4.2 %) and Haninge (2.0 %).
Since 2017, the strongest growth has been recorded in
Sigtuna, a municipality whose industrial stock has
grown by just over 270,000 sq m, equivalent to an
increase of 43.2 %, followed by Upplands-Bro with
growth of 138,177 sq m, equivalent to 37.8 %.
The largest decrease was recorded in the city of
Stockholm, with a total of 71,024 sq m (-2.8 %),
followed by the municipalities of Nacka and Huddinge,
which decreased by 38,624 sq m (-13.7 %) and 15,353
sq m (-2.5%) respectively.
> 50,000 sq m This is in line with what has already been said, central
industrial areas are being converted in favour of other
+ 25,000 to + 49,999 sq m
developments while the greatest growth is seen on the
+ 10,000 to + 24,999 sq m outskirts of the county. It is also in these areas with a
higher proportion of newly built premises that we are
0 to + 9,999 sq m seeing growing demand and consequently falling
vacancies, rental growth and falling occupancy rates.
- 9,999 to 0 sq m
> - 10,000 sq m
Note:
1) Source: Croisette, Datscha
17
2) Taxed assessment years: 2019-2020STOCKHOLM & UPPSALA | STOCK & VACANCY DATA
Stock- and vacancy data(1)(2)
Over the period 2020 - 2021, the stock has grown by
about 109,124 sq m, which corresponds to a net
percentage change in the stock of + 0.9 % in the
mapped area. Looking deeper and analysing the
change for each industrial area, a similar trend as on
the previous page can be observed. As in previous Industrial areas with strongest growth
years, the largest positive net change is observed in the
Municipality Total area, Total area, Change, sq m Vacancy, Q1
outskirts of Stockholm County and the outskirts of 2021, sq m 2020, sq m (%) 2022, %
Enköping municipality. In three out of five cases, the Arlanda City Sigtuna 386,606 351,860 34,746 (10 %) 2.6 %
largest negative net change is observed in the Veddesta Järfälla 384,116 358,582 25,534 (7 %) 3.4 %
municipality of Stockholm. Scania/Södra industriområdet Södertälje 634,022 608,520 25,502 (4 %) 1.3 %
Nacka and Huddinge municipalities are two expansive Rosersberg Sigtuna 479,286 455,954 23,332 (5 %) 4.7 %
municipalities with strong urban development where Annelund Enköping 227,970 210,054 17,916 (9 %) 1.3 %
industrial space is being abandoned in favour of other
types of development such as housing. The 15 largest
industrial areas currently account for 44 % of the total Industrial areas with the largest decrease
industrial area. In these, growth is slightly stronger, with
Municipality Total area, Total area, Change, sq m Vacancy, Q1
the stock growing by a total of 1.5 % in the last year, 2021, sq m 2020, sq m (%) 2022, %
indicating a continuing growth in the industrial market Sickla Nacka 37,075 84,371 - 47,296 (-56 %) 0%
located further out from the city centre. The 15 largest Kungens Kurva Huddinge 99,298 120,522 - 21,224 (-18 %) 0.8 %
industrial areas are located in Enköping, Haninge, Västberga Stockholm 419,109 437,583 - 18,474 (-4 %) 3.8 %
Huddinge, Järfälla, Sigtuna, Stockholm, Södertälje, Årsta Partihandelsområde Stockholm 167,176 185,015 - 17,839 (-10 %) 0.7 %
Upplands-Bro and Uppsala.
Årsta Park Stockholm 118,595 134,690 - 16,095(-14 %) 0.1 %
Not:
1) Source: Croisette, Datscha
18
2) Taxed assessment years 2019-2020STOCKHOLM & UPPSALA | STOCK & VACANCY DATA
Stock- and vacancy data(1)(2)
In the measurement made in autumn 2020, the
vacancy rate in Stockholm's 15 largest industrial areas
was 4.6 %. In autumn 2021 it was 4.7 %, followed by
4.1 % in January 2022. In general, small industrial areas
Development of vacancy rates(3),
usually have a lower vacancy as they comprises of 2016-2021
7.0%
fewer properties, and tenants in these areas tend to be Development of vacancy rates in Stockholm’s 15 largest 6.0% 5.3%
more eager to remain in that specific location. Whereas areas, 2020-2022 5.0%
4.4% 4.1%
3.6%
4.4%
3.7% 3.9%
4.0%
we instead see a higher turnover of tenants in larger, Trend, Vacancy Q1 Vacancy Q3 Vacancy Q3
3.0%
2021-2022 2022, % 2021, % 2020, %
more established industrial areas. The aggregated 2.0%
demand for premises in these larger and more Jordbro 7.5 % 9.6 % 2.1 % 3.9 % 1.0%
0.0%
established industrial areas is, however, significantly Scania/Södra industrial area -0.2 % 1.3 % 1.5 % 1.6 % 2016 2017 2018 2019 2020 2021 2022
higher than in the smaller, local industrial areas. Rosersberg -5.8 % 4.7 % 10.5 % 5.8 %
Arlanda City -6.2 % 2.6 % 8.8 % 6.9 % Distribution of total area, by year of
In Jordbro, a major increase in the vacancy is noted construction
Veddesta -0.3 % 3.4 % 3.7 % 7.9 % Sq m
compared to the previous measurement. This is 2,500,000
Västberga 0.8 % 3.8 % 3.0 % 3.9 %
because of a new vacant unit of 52,500 sq m. If this 2,000,000
Boländerna -0.8 % 5.1 % 5.9 % 2.3 %
unit were to be excluded from the vacancy rate, the 1,500,000
Ulvsunda -4.0 % 4.5 % 8.5 % 6.3 % 1,000,000
vacancy rate would drop to 2.0 % (and 3.1 % on the
Brunna industrial area -1.2 % 4.6 % 5.9 % 11.1 % 500,000
aggregated level).
0
Fyrislund -0.7 % 3.9 % 4.6 % 0.0 %
1910
1920
1930
1940
1950
1960
1970
1980
1990
2000
2010
2020
Over the period 2016-2021, the vacancy rate in the
Lunda industrial area -0.8 % 1.9 % 2.6 % 8.5 %
whole of Stockholm County(3) has fallen from 5.3 % in
Länna 1.2 % 3.9 % 2.7 % 2.9 % Distribution of vacant area, by year of
2016 to 3.9 % in 2022. The overall vacancy rate has construction
Annelund -1.6 % 1.3 % 2.9 % 4.7 % Sq m
remained at a remarkably low level for the past few 120,000
Librobäck -4.0 % 2.1 % 6.1 % 3.2 %
years. When comparing to centrally located offices, 100,000
Sätra -2.9 % 3.2 % 6.1 % 1.5 % 80,000
which traditionally have represented a lower risk for
60,000
Total -0.6 % 4.1 % 4.7 % 4.6 %
property owners, we are now seeing trends of 40,000
increased vacancies and greater uncertainty in that 20,000
0
segment. At the same time the industrial segment is
1910
1920
1930
1940
1950
1960
1970
1980
1990
2000
2010
2020
demonstrating strength and stability with no signs of
slowing down as the demand for industrial premises
most likely will continue to increase.
Note:
1)
2)
Source: Croisette, Objektvision
Includes only completed projects, not project vacancies.
19
3) Vacancy rate in the whole Stockholm region excl. UppsalaSTOCKHOLM & UPPSALA | RENTAL LEVELS
Rental levels Higher rents as the vacancy drops
The map on the left illustrates Croisette's estimate of
rent levels in different areas of Stockholm County and
how these are spread geographically. The table shows
a selection of Stockholm's largest industrial areas and
estimated rental levels for each area for newly signed
leases.
In and around central Stockholm, rents are estimated
to be between 1,500 - 2,100 SEK/sq m/year. In the
map, Lunda and Ulvsunda have been highlighted, two
3
central industrial areas which have been chosen as
2 references as they are considered representative of the
E4
E18 most central industrial areas. A large part of Ulvsunda
6
E18
is currently subject to residential development which
10
most likely will have a further positive impact on the
4 rental increase as office and retail use will gain in
7 interest, which will be beneficial for the existing stock.
5
1,500 – 2,100 The next area being highlighted consists mainly of
SEK/sq m/year
municipalities surrounding Stockholm that are
E20
Rental levels, base rent, strategically located near infrastructure such as
Industrial area
SEK/sq m/year
9 1,100 – 1,700 8 highways, ports, airports or railway terminals. In these
E20 SEK/sq m/year 1 Jordbro 1,200 – 1,500
locations the estimated rent is between 1,100 - 1,700
1
2 Rosersberg 1,100 – 1,300
E4 SEK/sq m/year. The rents in the lower end of that
3 Arlanda city 1,100 – 1,300
interval is found near the outskirts of the county. In
900 – 1,100 4 Veddesta 1,200 – 1,700
SEK/sq m/year central areas such as Jordbro, Länna or Veddesta,
5 Ulvsunda 1,500 – 2,100
rents can reach around 1,500 SEK/sq m/year, and in
6 Brunna 1,100 – 1,400 some cases even up to 1,700 SEK/sq m/year.
7 Lunda 1,300 – 1,700
In the more peripheral locations, the outermost area
8 Länna 1,200 – 1,600
marked on the map, the rent level is around 900 –
9 Moraberg 1,100 – 1,300
1,100 SEK/sq m/year.
10 Arninge 1,100 – 1,500
20STOCKHOLM & UPPSALA | THE TRANSACTION MARKET
The transaction market
The transaction market remains strong, with 2020 Transaction volume 2018-2021(1), breakdown per Transaction volume 2018-2021(1), industrial/logistics
year's figures greatly surpassed in 2021, both in segment
MSEK SEK/sq m
100% 14,000 20,000
Sweden as well as in the Stockholm region for
90% 18,000
industrial properties. We also can see that the average 12,000
80% 16,000
price per square metre is increasing rapidly.
70% 10,000 14,000
Among buyers, listed real estate companies are over- 60% 12,000
8,000
50% 10,000
represented, which is partly due to several major
40% 6,000
8,000
portfolio deals, such as Castellum's purchase of
30% 4,000 6,000
Kungsleden and Corem's acquisition of Klövern. The
20% 4,000
transactions contribute to the high proportion of listed 2,000
10% 2,000
companies on the buy side as well as the proportion of 0% 0 0
2018 2019 2020 2021 2018 2019 2020 2021
other investors on the divestment side.
Transaction volume, share of other segments Average purchase price, SEK/sq m
In addition to the above, some of the largest portfolio
Transaction volume industrial, warehouse & logistics Transaction volume industrial, warehouse & logistics
deals in the area include the Stockholm part of the
Castellum portfolio that Blackstone bought in February Transaction volume 2018-2021(1), sub-segment Transaction volume 2021(1), breakdown by buyer & seller
and the part of the NREP portfolio that was acquired by breakdown category
AXA IM in early December. Furthermore, another 100%
State and municipalities
significant acquisition is SLP's acquisition of eleven 90%
80% Construction companies
industrial properties in the Mälardalen region. The sale
70% Syndication Society
was made by Slättös Evolv Fastigheter at a price of 700
60%
million SEK, just under 19,000 SEK/sq m on a yield Other investors(2)
50%
estimated to around 4.75%. 40%
Opportunistic real estate funds
30% Private real estate companies
20% Value add real estate funds
10%
Listed real estate companies
0%
2018 2019 2020 2021 -60% -40% -20% 0% 20% 40% 60%
Industrial & warehouse Divestments
Logistics Acquisitions
Note:
1) Refers to transactions over SEK 40 million
2) In 2021, Castellum acquired Kungsleden and Corem acquired Klövern, which
affects the proportional share of the category ”Other investors”.
21STOCKHOLM & UPPSALA | THE TRANSACTION MARKET
The transaction market
Transaction volume 2018-2021(2), breakdown of
It is not only the investment volume that broke records Croisette believes that the market has a continuous portfolio and individual real estate transactions among
industrial/logistics transactions
in 2021. Of the total transaction volume for industrial entries of new strong players, both domestic and cross- MSEK
and logistics deals in the Stockholm region, 2021 border investors, who want to establish themselves in 12,000
stands out as 90 % of the volume relates to portfolio the Swedish industrial and logistics market. This, 10,000
deals. Among these, the interest has been high and the combined with a continued shortage of developable
8,000
majority of light industrial portfolios in the region is land, increased tenant demand and steady rental
nearing the yield requirements that as late as 2020 was growth are key factors for a continued acceleration in 6,000
in line with prime logistics. the transaction market in 2022. Croisette's
4,000
expectations for 2022 are therefore that we will
One transaction that demonstrates the strength of the
continue to see deals of both single assets and 2,000
warehouse and light industrial segment is the
portfolios that will strengthen the on-going yield
acquisition of Budbee's newly built last mile terminal in 0
compression. 2018 2019 2020 2021
Brunna, which was acquired by AMF Fastigheter at a
Volume, individual transactions
record low yield of 3.75 %, according to unconfirmed
Volume, portfolio deals
market data(1). Brunna, located just off the E18
northwest of central Stockholm, is one of Greater
Stockholm's largest and fastest growing industrial
Approx. 14,000 SEK/sq m, Approx. 14,300 SEK/sq m, Approx. 44,900 SEK/sq m, Approx. 35 300 SEK/sq m,
areas. Another example of a notable deal that 5.50 % 5.00 % 4.65 % 3.75 %
demonstrates the low yield levels is the divestment of
Acquisition of property in Acquisition of property in Acquisition of property in Acquisition of property in
Rexbo Industrihus, acquired by Blackstone in Q4 at an Jordbro (sale-lease back) Tyresö Södertälje (Annehem) Brunna (Budbee)
estimated 4.35 %. The transaction consisted of eight,
fully let, industrial properties in some of Greater
Stockholm's most attractive areas, Brunna, Ältaberg, 6.50 – 5.50 % 6.00 – 5.25 % 5.50 – 5.00 % 5.00 – 3.50 %
Länna and Jordbro.
2019 2020 2021 2022
Annehem acquired a newly constructed terminal of
2,150 sq m fully let to PostNord for just over 45,000 Acquisition of property in Acquisition of portfolio in Acquisition of logistics Acquisition of portfolio in
Veddesta Greater Stockholm property in Brunna Greater Stockholm
SEK/sq m at a yield level of around 4.65 % in May 2021. (Rexbo)
Approx. 13,000 SEK/sq m, Approx. 16,300 SEK/sq m, Approx. 20,000 SEK/sq m,
The purchase is made at remarkable levels both in
6.35 % 5.50 % 3.50 %(3) Approx. 22 900 SEK/sq m,
terms of price per square metre as well as yield. 4.35 %(3)
Furthermore, there are rumours regarding a recent
portfolio deal near 4.00 %
Not:e:
1)
2)
It should be noted that AMF also has ownership in the Budbee company
Refers to transactions over MSEK 40
22
3) Assessed by Croisette3 GOTHENBURG
23GÖTEBORG & BORÅS | INTRODUKTION
Gothenburg's industrial market is crying out for space
Croisette notes that land shortages, combined with However, Croisette estimates that current vacancy
the rapidly growing demand for industrial and rates will be marginally affected by this development,
warehouse space, have led to a sharp fall in vacancy due to continued strong growth in e-commerce and a
rates and rising rental levels over the year. This has thriving industrial sector crying out for more space near
also increased land prices, especially in central the city. Alltough, what could appear to be a problem in
locations. the near future is the lack of planned areas for
companies who deliver last mile of people and services,
Croisette's assessment is that the vacancy risk is low in
as areas like Högsbo is being urbanized and the region
the short and medium term and that the prospects for
as a whole has a high focus on logistics.
rental growth are good, especially for modern
premises. The same confidence seems to exist among The belief in a continued red-hot rental market has also
investors, which may explain the compression of the been demonstrated by increased willingness to pay
yield curve we have seen in the segment in 2021. among investors. Listings in the logistics segment have
been at yield levels below four per cent and in the
Vacancy rates are now at record lows in the
industrial segment at around five per cent.
Gothenburg and Borås region. Compared to 2020,
vacancies have almost halved, reaching a mere 2.9 % Happy reading!
in 2021.
The prime locations in the Gothenburg region; Arendal,
Sörred, Åbro and Landvetter Airport, have had even
lower vacancy rates, between 0 – 2 %. This has pushed
up the rental development of newly built premises but
also created a bottleneck for fast-growing tenants who
often have problems finding a larger premises in the
right location.
Within a five-year period, developable land will be
Joakim Grunditz
created via, for example, Gateway Säve, Hisingen
Head of Transactions
Logistics Park and Landvetter Airport. Gothenburg
joakim.grunditz@croisette.se
+46 (0) 790 67 06 59
24GOTHENBURG & BORÅS | STOCK & VACANCY DATA
Stock- and vacancy data(1)(2)
Over the period 2020 - 2021, the stock has grown by
79,971 sq m, which represents a net percentage
change of + 0.7 %. Areas with the strongest growth are
those located on the outskirts of the central cities and
the neighbouring municipalities of Borås and Kungälv.
The areas with the largest decrease are in Gothenburg Industrial areas with strongest growth
and Borås. In these areas there is a shift in the city
Municipality Total area, Total area, Change, sq m Vacancy, Q1
centre, which affects the stock of areas where 2021, sq m 2020, sq m (%) 2022, %
industrial space is being removed in favour of housing Landvetter airport Härryda 205,272 126,985 78,287 (62 %) 0.0 %
and other urban development. On an overall level, we Sörred industrial area Gothenburg 1,221,415 1,151,176 70,239 (6 %) 0.3 %
only see a decrease in stock in 3 out of 11 Backa industrial area Gothenburg 652,078 624,739 27,339 (4 %) 0.0 %
municipalities, which adds up to a total decrease of Viared Borås 858,940 836,023 22,917 (3 %) 0.1 %
5,550 sq m, which is remarkable and something that Kyllared Borås 72,323 58,323 14,000 (24 %) 17.4 %
indicates strong growth in the region as a whole.
The 15 largest industrial areas currently account for 54
% of the total industrial stock. The growth in these Industrial areas with the largest decrease
areas is somewhat lower, a total increase of just 0.9%
Municipality Total area, Total area, Change, sq m Vacancy, Q2
over the past year. 36 % of the total industrial stock is 2021, sq m 2020, sq m (%) 2022, %
located in the municipality of Gothenburg, where total Tuveområdet Gothenburg 220,196 255,584 - 35,388 (-14 %) 0.0 %
growth is 0.6 %. This is evidence of a growing industrial Utby industrial area Gothenburg 31,151 46,151 - 15,000 (-33 %) 49.8 %
market emerging in newly established areas as well as Jössa Borås 189,189 201,719 - 12,530 (-6 %) 1.4 %
outside the Gothenburg city centre. The 15 largest Arendal industrial area Gothenburg 701,620 712,150 - 10,530 (-1 %) 7.2 %
industrial areas are located in Mölndal, Kungälv, Borås
Solstens industrial area Härryda 70,418 79,914 - 9,496 (-12 %) 0.8 %
and on Hisingen.
Note:
1) Source: Croisette, Datscha
25
2) Taxed assessment year 2019-2020GOTHENBURG & BORÅS | STOCK & VACANCY DATA
Stock- and vacancy data(1)(2)
In our latest vacancy survey made in late 2020,
covering Gothenburg's 15 largest industrial areas, the
vacancy rate was 5.0 %. One year later, in late 2021 the
vacancy dropped down to 2.7 %, resulting in a change
of 2.3 percentage points. However, between Q3 2021 Distribution of total area, by year of
construction
and Q1 2022, a slight increase was noted which breaks Development of vacancy rates in Gothenburg’s 15 largest Sq m
the previous year's downward trend. It is though areas, 2020-2022 2,000,000
important to highlight that the vacancy remains at a 1,500,000
Trend, Vacancy Q1 Vacancy Q3 Vacancy Q3
2021-2022 2022, % 2021, % 2020, %
record low level for the segment. The increase in 1,000,000
vacancy rate can partially be explained by Backa Sörred industrial area 0.0 % 1.6 % 1.6 % 2.4 %
500,000
industrial area where a lot of new industrial space is Viared -1.2 % 2.0 % 3.2 % 9.3 %
0
Unknown
1910
1920
1930
1940
1950
1960
1970
1980
1990
2000
2010
2020
built on speculative basis. As the pace of these Arendal industrial area 0.4 % 1.2 % 0.8 % 5.0 %
speculative developments slows downs, we expect a Backa industrial area 6.6 % 7.7 % 1.1 % 10.5 %
rapid drop of the vacancy in Backa. Högsbo industrial area -3.2 % 3.8 % 7.0 % 3.7 % Distribution of vacant area, by year of
construction
Åbro industrial area 1.9 % 3.1 % 1.2 % 0.9 %
The industrial areas of Arendal and Sörred have Sq m
Rollsbo 0.0 % 4.4 % 4.4 % 3.6 % 120,000
previously shown a downward trend in vacancies, but a 100,000
Sävenäs industrial area -0.9 % 0.8 % 1.7 % 1.6 %
major vacancy in Sörred of almost 20,000 sq m has 80,000
Ringöns industrial area -2.5 % 2.5 % 5,1 % 5.9 % 60,000
resulted in a slight increase in the vacancy rate,
40,000
although it remains relatively low. In Borås, there is a Marieholms industrial area 1.3 % 6.2 % 4.9 % 10.2 %
20,000
continued expansion with construction taking place at Ramnaslätt -5.4 % 3.5 % 8.9 % 9.4 % 0
1900
1910
1920
1930
1940
1950
1960
1970
1980
1990
2000
2010
2020
a high rate in the industrial segment west of the city Tuveområdet -1.5 % 0.0 % 1.5 % 1.4 %
towards Gothenburg where previously centrally located Tagene industrial area -1.0 % 1.2 % 2.2 % 2.2 %
operators are seeking more accessible areas. As Landvetter airport 2.6 % 2.6 % 0.0 % 0.0 %
demand remains high, it can be stated that despite Backaplan -1.4 % 0.9 % 2.2 % 3.1 %
increasing vacancy rates, the segment remains stable Total +0.1 % 2.8 % 2.7 % 5.0 %
and there is no tendency for vacancy rates to continue
to rise in the future.
Note:
1) Source: Croisette, Objektvision
26
2) Inkluderar endast färdigställda projekt, ej projektvakanser.GÖTEBORG & BORÅS | HYRESNIVÅER
Rental levels
The map on the left illustrates the main industrial areas
in the Gothenburg region and Borås. The
accompanying table shows the largest industrial areas
and estimated base rents for each area.
In the most attractive areas, close to the city center,
rents amount to 800 – 1,500 SEK/sq m/year. Locations
like Sörred, Arendal and Högsbo, have good road
communications, proximity to the european highways
and the city center, which reward them with top rents. ALE
The former two also benefit from having the Port of KUNGÄLV
7
Gothenburg in their vicinity. ALINGSÅS
In Backa, new developments have resulted in a LERUM
temporary hike in vacant space. However, rent levels
GOTHENBURG
4
have remained robust and are estimated at 1,000 – 1 10
1,500 SEK/sq m/year. 9 PARTILLE BORÅS
3
In surrounding municipalities such as Borås, rent levels
HÄRRYDA 2
8 BOLLEBYGD
are considerably lower. New developments within the 5 6
modern stock, primarily in Viared and Kyllared has also
Rental level, base rent,
Industrial area
SEK/sq m/year
MÖLNDAL
kept rent levels from rising at the same pace as in
Gothenburg. In comparison, prime rents are about 25 % 1 Sörred 800 – 1,200
lower than in Borås. 2 Viared 700 – 1,000
3 Arendal 900 – 1,200
Croisette has also noted a continued rise in demand for
4 Backa 1,000 – 1,500
KUNGSBACKA
quick access to premises and short term leases. > 50,000 sq m
5 Högsbo 1,000 – 1,500
There are mostly e-retailers and 3PL companies who + 25,000 to + 49,999 sq m
6 Åbro 1,000 – 1,500
seek short-term leases, often due to extremely rapid
7 Rollsbo 700 – 900
growth plans and the risk of outgrowing their premises + 10,000 to + 24,999 sq m
8 Solsten 1,000 – 1,500
prematurely. Thus, flexible spaces, with the option for
9 Ringön 1,000 – 1,500 0 to + 9,999 sq m
tenants to expand their operations without moving is
10 Marieholm 800 – 1,200
especially sought after. - 9,999 to 0 sq m
Note:
1) Source: Croisette, Datscha
27 > - 10,000 sq m
2) Taxed assessment years: 2019-2020GOTHENBURG & BORÅS | THE TRANSACTION MARKET
The transaction market
The past year has been outstanding for the Gothenburg Transaction volume 2018-2021(1), breakdown by Transaction volume 2018-2021(1), industrial/logistics
area in terms of total transaction volume, which has segment
MSEK SEK/sq m
almost doubled since 2020. It is noteworthy that the 100% 12,000 16,000
90%
industrial segment accounts for a significant part of the 14,000
10,000
80%
volume increase. From the previous record year, 2019, 12,000
70%
8,000
which accounted for around 30 % of total transaction 60%
10,000
volume, the segment accounts for 37 % of the record 50% 6,000 8,000
volume in 2021. The price per square metre which had 40% 6,000
4,000
remained stable for the past three years also saw a 30%
4,000
20%
larger increase in 2021. 2,000
2,000
10%
Although 2019 still stands out as the logistics year in 0% 0 0
2018 2019 2020 2021 2018 2019 2020 2021
Gothenburg, including Bockasjö's acquisition in
Transaction volume, share of other segments Average purchase price, SEK/sq m
Landvetter, volume in the segment has increased in
Transaction volume industrial, warehouse & logistics Transaction volume industrial, warehouse & logistics
2021. The increase is partly due to some major sales in
Gothenburg harbour and the Gothenburg part of the
Transaction volume 2018-2021(1), sub-segment Transaction volume 2021(1), breakdown by buyer & seller
NREP portfolio that Axa acquired in Q4. breakdown category
The statistics for the breakdown by buyer and seller
100%
category are characterised by the major acquisitions Institutional investors
90%
made during the year, with other investors on the seller 80%
Core real estate funds
side and listed property companies on the buyer side 70% Construction companies
largely consisting of Castellum's acquisition of 60% State and municipalities
50% Opportunistic real estate funds
Kungsleden and Corem's purchase of Klövern.
40% Private real estate companies
30% Value add real estate funds
20% (2)
Other investors
10%
Listed real estate companies
0%
2018 2019 2020 2021 -60% -40% -20% 0% 20% 40% 60% 80%
Industrial/warehouse Divestments
Logistics Acquisitions
Note:
1)
2)
Refers to transactions over SEK 40 million
In 2021, Castellum acquired Kungsleden and Corem acquired Klövern, which
28
affects the proportional share of the category ”Other investors”.GOTHENBURG & BORÅS | THE TRANSACTION MARKET
The transaction market
Last year included several portfolio deals in the The light industrial segment has too seen a yield
industrial and logistics segment in the Gothenburg compression and in several cases the yield on deals
region. A significant increase compared to 2020, which has been around 5 %.
can be seen in the chart on the next page.
Tritax EuroBox took its first step into the Nordic region
Most of the transactions have taken place in well- with the acquisition of Arendal 1:16, a logistics property
established industrial areas in Gothenburg and Borås. spread over two buildings directly adjacent to the Port
Among the most active players were Blackstone, of Gothenburg. The agreed property value of the deal
Svenska Verksamhetsfastigheter (EQT), Stendörren was SEK 474m, equivalent to SEK 16,400/sq m.
and Revelop. According to Croisette's estimate, the initial yield was
3.6 %.
The latter three are oriented in the light industrial
segment and have made first purchases in the region In January, Barings acquired Sörred Kubiklager, a
in recent years. Revelop entered the Gothenburg modern logistics property built by Skanska, which was
market with its acquisition of eight industrial properties also the seller. The underlying property value in the
in March 2021 and has since maintained a high transaction was SEK 265m, which corresponds to just
acquisition rate in the region. By the end of the year, the over SEK 13,000/sq m at an estimated yield of 4 %.
company had built up a significant portfolio of well-
Vatne Real Estate AS acquired the property Vindtyget 1
located industrial and logistics properties.
at Viared in Borås during the spring. The property has
The Gothenburg market has been considered by many Ellos as tenant and comprises almost 94,000 sq m of
to be difficult to enter for companies without a local lettable area. Ellos has its head office and Nordic
presence, but the companies just mentioned are good central warehouse in the property. The agreed property
examples of the snowball effect a first-time purchase value in the deal amounted to SEK 908m, equivalent to
can have, and more companies are expected to make SEK 9,700/sq m. The seller was Bosjö Fastigheter.
the same journey in 2022. Croisette estimates the yield on the deal to be just over
5 %.
As in the previous years, the yield has continued to fall.
We have seen a major yield compression for logistics
properties and during the year, the majority of the deals
have been quoted at yield levels around or below 4%,
which is a record low.
Note:
1) Avser transaktioner över 40 Mkr
29GOTHENBURG & BORÅS | THE TRANSACTION MARKET
The transaction market
Another persistent trend is the shortage of buildable land is estimated at SEK 400-450 million. The area,
land in the region. Demand for modern premises is high located within Halvorsäng, is situated directly north of
among tenants and the availability of planned land the port's terminals next to Hisingsleden. The location
remains limited, particularly in the Gothenburg area. is well suited for handling incoming goods, for onward
The shortage has led to intensified competition in transport across Sweden and Scandinavia by truck or
transactions and increasing land prices. This was train.
illustrated, for example, in the series of rapid
Transaction volume 2018-2021(1), breakdown of portfolio
establishments at Landvetter Airport that took place in and single assets among industrial and logistics transactions
2020 and 2021. The establishments were within MSEK
9,000
Landvetter Logistikpark, one of the few prime locations
8,000
that was able to offer planned land on a large scale
7,000
during the year. Dawa Däck, Postnord, Rajapack and 6,000
Vätterleden Logistik have recently chosen to establish 5,000
themselves in the area. Construction on the last plots 4,000
sold in 2021 is expected to take place in early 2022 for 3,000
tenants such as Nordiska Galleriet and Zeppelin. 2,000
1,000
During the year, Castellum and the Port of Gothenburg
0
also entered a letter of intent to develop logistics 2018 2019 2020 2021
properties corresponding to 155,000 sq m BTA through Total volume, single assets
a joint venture. Castellum's initial investment for the Total volume, portfolio deals
approx. SEK 7,200/sq m, 6.00 %(2) approx. SEK 13,300/sq m, 5.75 % approx. SEK 16,900/sq m, 4.75 %(2) approx. SEK 13,200/sq m, ~4.00 %(2)
Nelly’s logistics property Modern warehouse Santa Marias warehouse in Kungsbacka Sörred warehouse on Hisingen
6.50 – 5.50 % 6.00 – 5.25 % 5.50 – 4.50 % 5.00 – 3.75 %
2019 2020 2021 2022
Logistics property in Kungsbacka Portfolio in Viareds industrial area Logistics property in the port of
Gothenburg
approx. SEK 17,100/sq m, 6.00 %(2) approx. SEK 10,900/sq m, 6.00 %(2)
approx. SEK 16,400/sq m, 3.60 %
Note:
1) Refers to transactions over SEK 40 million
30
2) Assessed by Croisette4 SKÅNE
31SKÅNE & HALMSTAD | INTRODUCTION
Modern industrial properties set new market standards
In our previous report from 2020, Croisette noted that At the same time, the tenants themselves are also
vacancy rates in the Skåne region were remarkably more eager to lease premises that in a larger extent
low, and this year’s report is no exception. In 2020, provide a better working place for their employees. With
the vacancy rate in Skåne was 3.9%, followed by that said, we do believe that there is a hidden potential
3.5% in Q3 2021 and 3.8 % in Q1 2022. In addition, in the older stock, but several vacancies will need
this year we further expect rising rental levels and investments to reach the next level.
new all-time low yields, perhaps as far down as 5.0%.
Croisette believes that the low vacancy is an indication
Happy reading!
of a healthy industrial market, but there are concerns
that an increasing shortage of suitable and modern
premises is becoming a problem for the region’s
expansive industrial companies. Low vacancy rates
combined with a lack of developable land, particularly
in Malmö, could lead to an unwelcome bottleneck for
the long-term growth of the industrial market in the
region as demand for modern space is high. However,
a likely outcome is that secondary premises in
favourable locations will increase in attractiveness,
both from a tenant and an investor perspective.
In addition, Croisette has observed that property
owners have improved at letting modern premises at
higher market rents compared to older premises.
Naturally, this is largely due to reasons such as
available supply, construction costs and the overall
product itself.
Andreas Larsson
Senior Associate
Malmö
andreas.larsson@croisette.se
+46 (0) 735 36 88 39
32You can also read