LAYMAN'S REPORT - TSUMAPS NEAM
←
→
Page content transcription
If your browser does not render page correctly, please read the page content below
ECHO/SUB/2015/718568/PREV26
LAYMAN’S REPORT
TSUNAMI: a real threat
A tsunami is a large sea wave caused by the sudden displacement of the sea floor. This displacement can be
caused by an earthquake, a submarine landslide, or a volcanic eruption. The impact of meteorites or other
impacts upon the sea surface can also generate tsunamis.
Earthquakes are the primary cause of the larger tsunamis, and they are especially large and dreadful when
occurring along a subduction zone, an area where a tectonic plate is being drawn down under another.
Tsunamis are rare, but their occurrence can cause wide destruction.
The TSUMAPS-NEAM project deals with tsunamis generated by earthquakes.
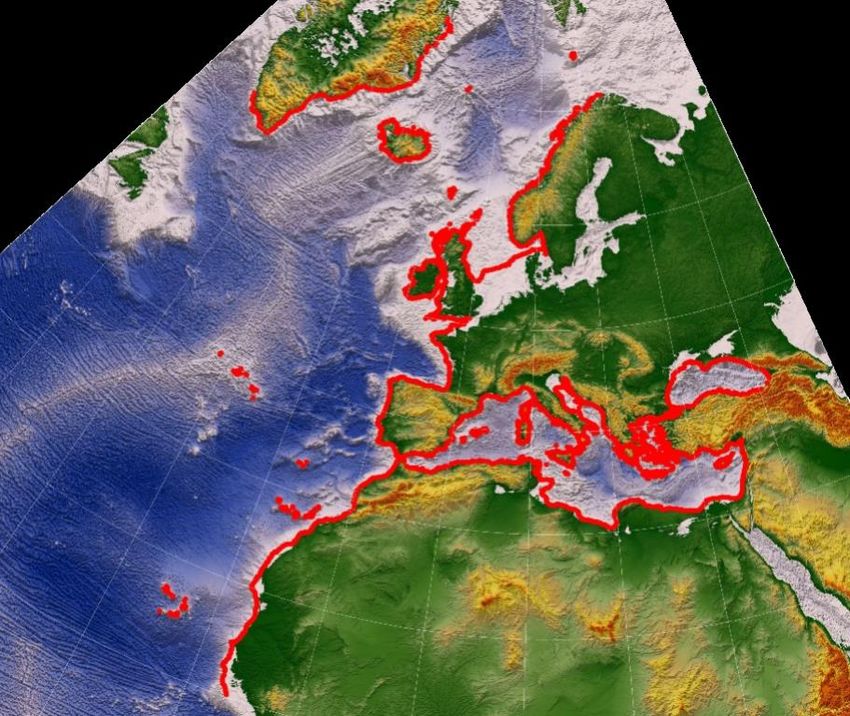
Sendai (latitude 38.19, longitude 140.96), Miyagi Prefecture, Japan,
31/03/2009 14/03/2011
before and after the earthquake and tsunami of 11 March, 2011.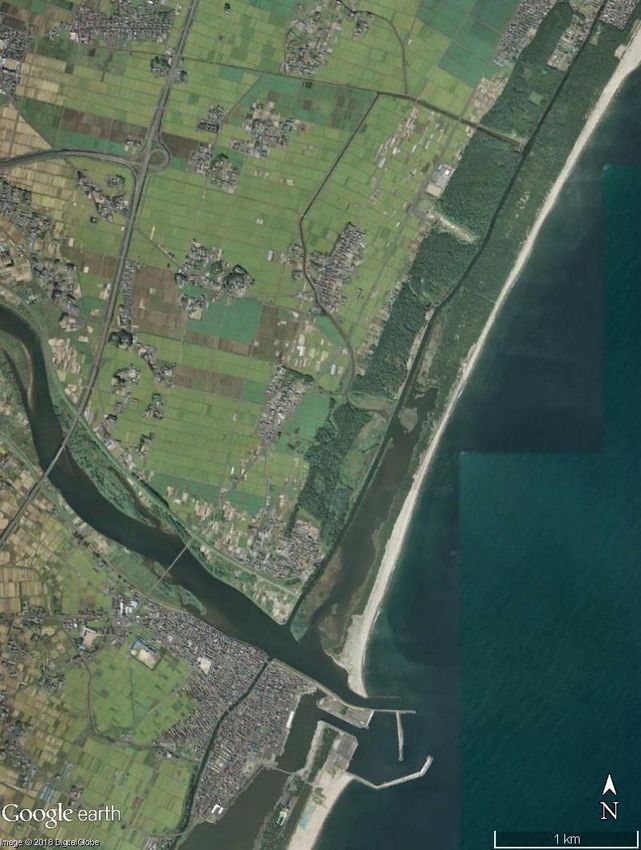
TSUMAPS-NEAM Factsheet

TSUMAPS-NEAM is funded by European Union - Humanitarian Aid & Civil Protection
(ECHO/SUB/2015/718568/PREV26)

Project full title: Probabilistic TSUnami Hazard MAPS for the NEAM Region

Duration: 21 months (01/01/2016 - 30/09/2017)
Budget: 660 kEuro

Goal: produce the first region-wide long-term homogeneous Probabilistic Tsunami Hazard
Assessment (PTHA) from earthquake sources of the NEAM region.

Partners: INGV (coordinator), NGI, IPMA, GFZ, UB, NOA, CNRST, INM.

Project website: http://www.tsumaps-neam.eu

TSUMAPS-NEAM Team, 2018. The TSUMAPS-NEAM Layman’s Report. Version updated on
12/07/2018, available from http://www.tsumaps-neam.eu/documentation/.

              This work is licensed under a Creative Commons Attribution 4.0 International License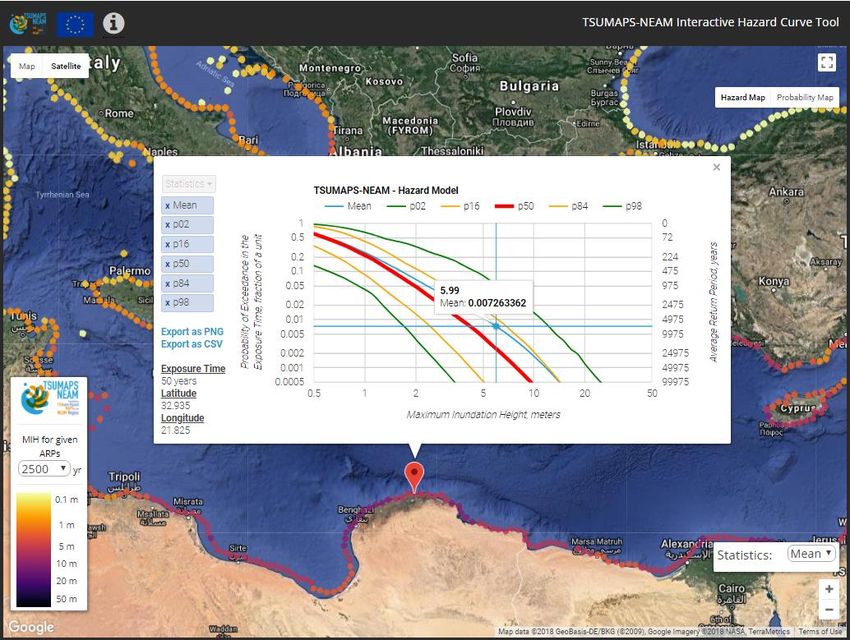
The NEAM region

                  1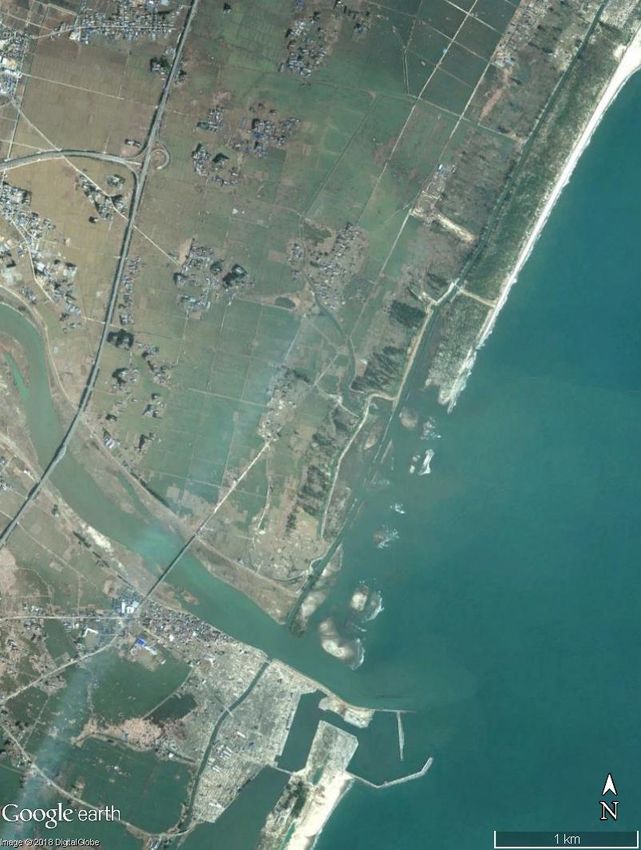
Tsunami generation from earthquakes
Tsunamis generated by earthquakes originate from the sea bottom displacement due to
fault dislocation. They are the majority of all tsunamis in the World’s oceans.
    Tectonic forces build strain onto the fault. Friction on the fault
    interface prevents a slow and steady motion, so that the two                                                 the rock body undergoes
    blocks on either sides of the fault are stuck. Energy                                                        minimal distortion
    accumulates into the rock body that hosts the fault for a long
    time, in some cases even for thousands of years.                                        the fault is stuck

     tsunami starts
                                                                         When the accumulated energy exceeds the resisting frictional
                                                                         forces, the fault moves to regain a resting position. This
                                                                         movement on the fault deforms at once the sea bottom and
              earthquake fault
                                                                         the water above it. This generate the first wave of the
              rupture deforms the
              sea bottom
                                                                         tsunami.
                                                                                         tsunami waves spread

The tsunami waves spread apart and move away from the
source area.

                                                                         The waves then travel across the deep sea very quickly. This
                                                                         computer simulation of tsunami wave propagation shows how
                                                                         long it takes for a tsunami generated near the Island of Crete to
                                                                         spread across the eastern Mediterranean Sea. In this example
                                                                         the first wave reaches the coast of Libya in about 30 minutes
                                                                         and the coast of southern Italy in about one hour.

Earthquake faults can be of various types, and the most active             past each other horizontally, with neither extension nor
ones align along plate boundaries.                                         contraction.
Earth’s outer shell, the crust, is deformed by the so-called               Another type of faults is the subduction. In this case the sense
crustal faults in different fashions linked to the different               of movement is always reverse or oblique-reverse, and the
sense of movement they may attain. We can distinguish                      crust on one side of the fault, called the subduction interface,
between normal faults, when the crust is extended, reverse                 is drawn down under the other side. Subduction earthquakes
faults when the crust is contracted (the case shown above),                are the biggest ones on Earth, and also those that generate
and transcurrent faults, when the two sides of a fault slide               the largest tsunamis.

                                                                           The two most recent tsunamis in the NEAM region were
                                                                           generated by crustal faults. The Zemmouri (Algeria),
                                                                           magnitude 6.8 earthquake of 21 May, 2003, was generated
                                                                           by a reverse crustal fault, and the Bodrum/Kos (Turkey-
                                                                           Greece border), magnitude 6.6 earthquake of July 20, 2017,
                                                                           was generated by a normal crustal fault. The subduction zone
                                                                           between the eastern Mediterranean Sea and the Aegean
                                                                           Sea, called Hellenic Arc, is the most active in the NEAM
                                                                           region. Many scholars consider the Hellenic Arc to be the
                                                                           most likely source of the July 21, 365 CE, magnitude 8+
                                                                           earthquake and tsunami, one of the largest known seismic
Sketch map of the tectonic plates and plate boundaries (the                event in history in the NEAM region.
white ribbon) and the earthquakes of magnitude larger than 5
of the last 40 years (red circles). Most of the plate boundaries
lay in the oceans.

2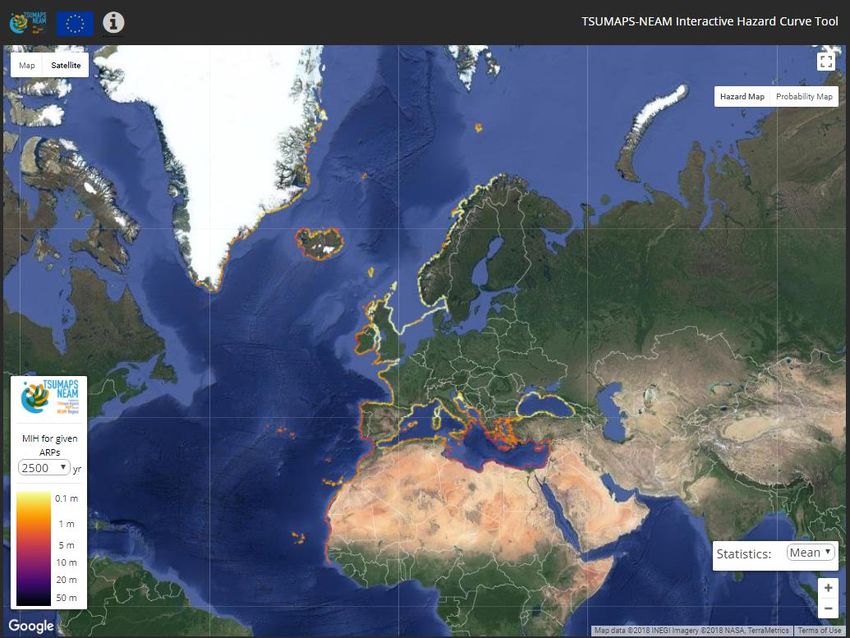
The next tsunami in the NEAM Region cannot be a surprise
Although tsunamis are rare events, the notion of tsunami
occurrences in the NEAM region is as old as the dawn of
written documents. However, for very old tsunamis, such
as that of Crete, Greece, in 365 CE, that spawned
destruction across the eastern Mediterranean coasts, there
is only scattered information. Older tsunamis are solely
known for the footprints they left on the geological record.

                                                                                Damages of the 1908 earthquake and tsunami in Messina, Italy (photo from
                                                                                the INGV photo gallery http://www.ingv.it/ufficio-stampa/stampa-e-
                                                                                comunicazione/Galleria-immagini/archivio-immagini-
                                                                                terremoti/photo_album.2010-04-28.5890391000/).

                                                                                resounds as a wake-up call for the entire community of
                                                                                professionals working on the mitigation of natural risks.
                                                                                To scientists, tsunamis are known for the data gathered in
                                                                                post-tsunami field surveys and the wave amplitudes
Sketch-map of the effects of the earthquake and tsunami of 21 July, 365 CE,
                                                                                recorded in real time by networks of hi-tech instruments
according to written sources, and archaeological and geological findings        strategically deployed beforehand. However, knowledge
(redrawn from the Catalogue of ancient earthquakes in the Mediterranean         about past tsunamis, whatever detailed it can be, is only a
area up to the 10th century, ING, Italy) .
                                                                                part of the story. Not to be surprised by the next tsunami
Throughout history, the disastrous effects of tsunamis have                     requires preventive actions to be undertaken on the basis
often been portrayed in paintings or engravings, with one                       of solid scientific estimates of what can be expected.
of the most famous being the destruction of Lisbon,
Portugal, after the 1755 tsunami. In the early XX century
the first pictures of the effects of tsunamis made their
appearance, such as in the case of Messina, Italy,
overwhelmed by the 1908 tsunami.

                                                                                Sea withdrawal in Gumbet Bay (top) and mareogram recorded by a tide gauge
A depiction of the 1755 Lisbon earthquake as seen from across the Tagus River
                                                                                in Bodrum (bottom), Turkey, for the tsunami ensued by the earthquake
(from the archives of Art and History, Berlin, public domain image).
                                                                                occurred on 20/07/2017 in the Bodrum/Kos area (images from the post-
These images helped to keep vivid recollections of past                         tsunami survey available at http://users.metu.edu.tr/yalciner/july-21-2017-
                                                                                tsunami-report/Report-Field-Survey-of-July-20-2017-Bodrum-Kos-
tsunamis, but they are known mainly to scholars, historians,                    Tsunami.pdf).
specialists, and amateurs. Nowadays, once that gripping
videos of recent giant tsunamis from all around the world                       The TSUMAPS-NEAM project committed to develop a
(Sumatra 2004, Chile 2010, Japan 2011) were broadcasted                         novel, robust, and effective tool to enable our society to
by media and social networks in real time, nobody is no                         cope with the threats posed by tsunamis of earthquake
longer unaware of the threat posed by tsunamis. A                               origin in the NEAM region. The approach relies on intensive
relatively small tsunami, such as that of July 20, 2017, in                     computational tsunami simulations of all the possible
Bodrum/Kos, spreading in the waters between Turkey and                          seismic sources that could generate them, and the
Greece, makes the headline in the news for many days and                        treatment of these data in a probabilistic framework.

                                                                                                                                                          3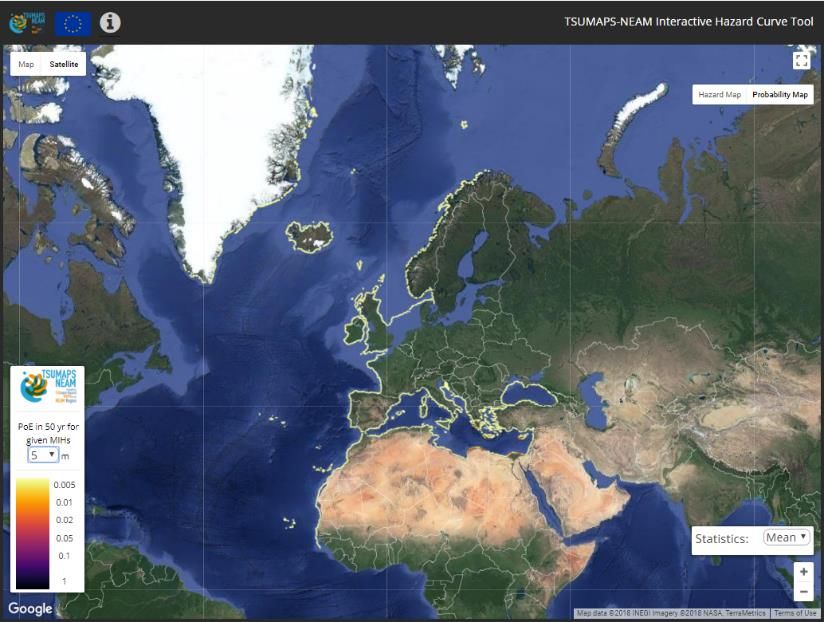
The TSUMAPS-NEAM partnership

The TSUMAPS-NEAM partnership has formed to pursue the objectives of the European Civil
Protection and Humanitarian Aid Operations to support and complement the European
efforts in actions aimed at achieving a higher level of protection and resilience against
disasters by preventing or reducing their effects.

The partnership of the project includes
research institutions established in EU
countries, as well as in Enlargement1 and
Neighborhood Policy2 countries.
Geographically, these countries are
distributed in all corners of
the continents facing coastlines of the
North-Eastern
Atlantic, the Mediterranean,
and connected Seas, i.e. the
so-called NEAM region.
All these countries are
significantly exposed
to tsunami hazard and host
renowned research
institutions specialized
in the study of
tsunamis science.
1 Turkey
2 Morocco,   Tunisia

                Istituto Nazionale di Geofisica e Vulcanologia (INGV), Italy, Project coordinator

                Norges Geotekniske Institutt (NGI), Norway

                Instituto Português do Mar e da Atmosfera (IPMA), Portugal

                Helmholtz-Zentrum Potsdam Deutsches GeoForschungsZentrum (GFZ), Germany

                Middle East Technical University (METU), Turkey

                Universitat de Barcelona (UB), Spain

                National Observatory of Athens (NOA), Greece

                Centre National pour la Recherche Scientifique et Technique (CNRST), Morocco

                Institut National de la Météorologie (INM), Tunisia

4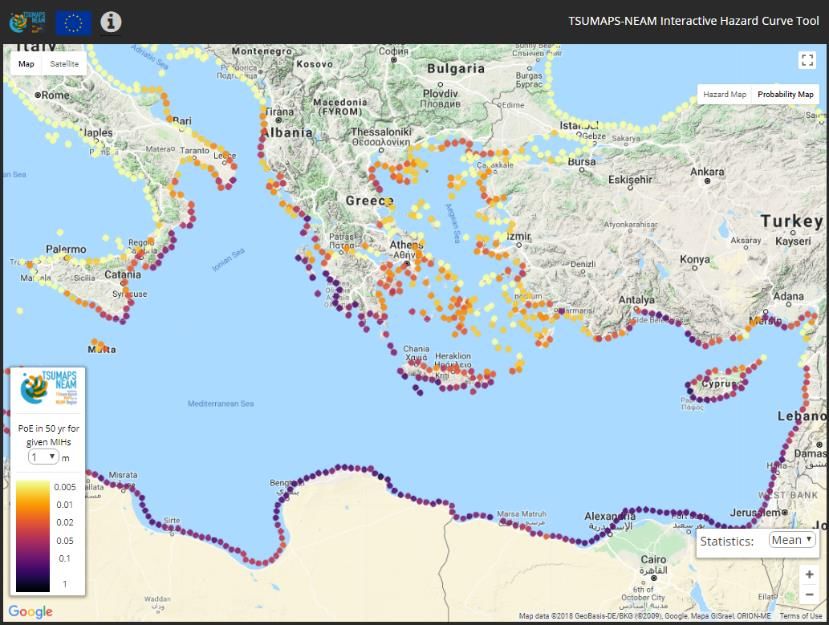
The TSUMAPS-NEAM project at a glance
Objective: the TSUMAPS-NEAM project goal was to produce the first region-wide long-term homogenous
Probabilistic Tsunami Hazard Assessment (PTHA) from earthquake sources with the aim of triggering a
renewed and common tsunami risk management strategy in the NEAM region.
The project started in January 2016 and ended in September 2017.

                                                                                                                           DG-ECHO
    Knowledge base,
    methods, and data from
                                                 TSUMAPS-NEAM
    previous tsunami and
    seismic hazard projects1.
                                                                                             PTHA                          End Users &
                                                                                            Products                       Stakeholders
                                                                                                                           Civil Protection Agencies
    EU ASTARTE                                                                                                             General public
    project2
                                                                                                                                       IOC/UNESCO
    • knowledge base                                                                                                                    NEAMTWS
    • methods and data

1 Several experiences contributed to shaping up the TSUMAPS-NEAM project, among them the following were the most influential projects: SHARE
(http://www.share-eu.org/), STREST (http://www.strest-eu.org/), UNISDR GAR15 (https://www.preventionweb.net/english/hyogo/gar/2015/en/home/).
2 The collaboration with the European ASTARTE project (http://astarte-project.eu/) went on during most of the TSUMAPS-NEAM project with continuous and

mutually beneficial exchanges.

TSUMAPS-NEAM PTHA builds upon robust datasets and                               weighting of the adopted choices. Renowned scientists
methods developed in previous projects at local, regional,                      from all around the world helped the TSUMAPS-NEAM
and global scales. It also relies on innovative and robust                      team throughout the development of this complex
procedures implemented during the development of the                            procedures with their expertise and voluntary dedication.
project. However, every hazard assessment requires                              The scheme below shows the different roles taken on by
several decisions to be made, such as the selection of                          different groups of experts (the actors) and a simplified
scientifically-acceptable alternative models and the                            flowchart of their work (the actions).

      Elicited scientists

      TSUMAPS-NEAM
          Team

     Volunteer scientists,
     engineers, and civil
         protection
       representatives

The core products of the TSUMAPS-NEAM project are the                           entire NEAM region. However, its results are also suitable
probabilistic tsunami hazard curves and maps which are                          for other uses, such as local efforts, for which they
seamlessly made available to anyone through a specifically                      represent an important starting point. Examples of such
developed interactive web tool.                                                 efforts are the designing of applications devoted to
                                                                                prevent the tsunami impact, preparing evacuation maps of
TSUMAPS-NEAM products can be directly used to plan and                          coastal areas, prioritize local, and more detailed,
develop hazard prevention programs at the scale of the                          probabilistic inundation maps for hazard and risk analyses.

                                                                                                                                                         5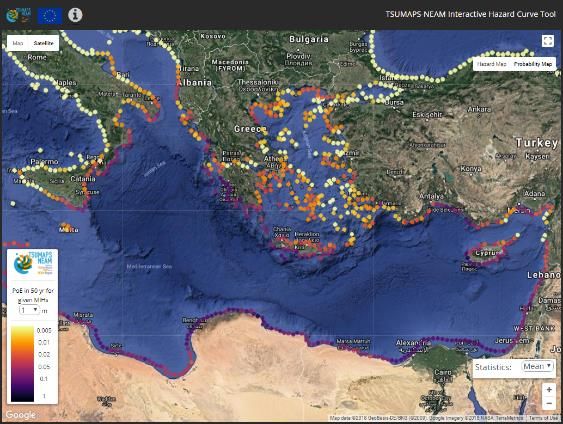
Familiarizing with hazard basic concepts
                                                 What is a hazard curve?                                          high probability
A hazard curve is a plot of the results of mathematical calculations. The curve                                    low intensity
expresses the probability of exceedance versus an “intensity measure level” for a given
period of time, called the “exposure time”. The adopted exposure time in TSUMAPS-
NEAM is 50 years. In other words, each point on the curve tells you how frequently an
                                                                                                                                      low probability

                                                                                                    probability
event of a certain intensity is surpassed in the future. Probability and frequency of an
                                                                                                                                       high intensity
event in time are linked together, so that at each probability value corresponds a so-
called average return period which is the average time span between two consecutive
events of the same intensity. The probability of exceedance is always a number
between 0 and 1, often expressed as a percentage.
                  suite of hazard curves expressing the
                  uncertainty of the hazard model                                                                            intensity
                                            lower
                                                               All models have a certain degree of uncertainty, including hazard
    probability

                                          uncertainty
                                                               models. Several hazard curves can be shown in a single plot to
                                                               represent this uncertainty, through a quantity called percentile. Look
                                                               at how spread apart are the percentiles to evaluate the level of
                    higher                                     uncertainty of the hazard model.
                  uncertainty
                                                                                point of interest                     inundation length
                           intensity
In TSUMAPS-NEAM the adopted intensity measure level is                                                                 inundation             run-up
the tsunami maximum inundation height (MIH) evaluated at a                                 mean sea level                height               height
point of interest (POI). The MIH necessarily represents an                50 m isobath
average, as it may vary laterally along the coast behind the
POI. Local MIH (and maximum run-up) values along the coast can
be 3-4 times larger than the MIH estimated by the hazard model.

                     How are hazard and probability maps built?
To make a hazard map or a probability map, the first step is to calculate hazard curves at any point of interest (POI) and then plot
these points on a map viewer. Each point is then colored according to the value of the intensity measure level or of the
probability of exceedance. In TSUMAPS-NEAM we considered more than two thousand POIs distributed along the NEAM
coastlines. These points are spaced, on average, at about 20 km from one another. There are 1,076 points in the North-East
Atlantic; 1,130 points in the Mediterranean Sea; and 137 points in the Black Sea.

                                                                                                                                     HAZARD MAP
                                                                                                                    This map shows the maximum
                                                                                                                    inundation height at each POI
    design                                                                                                          for a single design probability.
probability                                                                                                         The POI colors scale according
                                                                                                                      to the maximum inundation
                                                                                                                       height measured in meters.
                                                                                                                   This type of maps are generally
                                                                                                                      used by engineers and other
                                       MIH at                                                                                    hazard specialists.
                                       the POI
PROBABILITY MAP
This map shows the probability
of exceedance in 50 years at
each POI for a single value of the
                                                                                         probability
MIH. The POI colors scale
                                                                                         at the POI
according to the probability
expressed by a number between
0 and 1. This type of maps are
more effective to communicate
the hazard to administrators,
                                                                                                                            MIH tolerance
decision makers, and the
                                                                                                                                level
general public.

6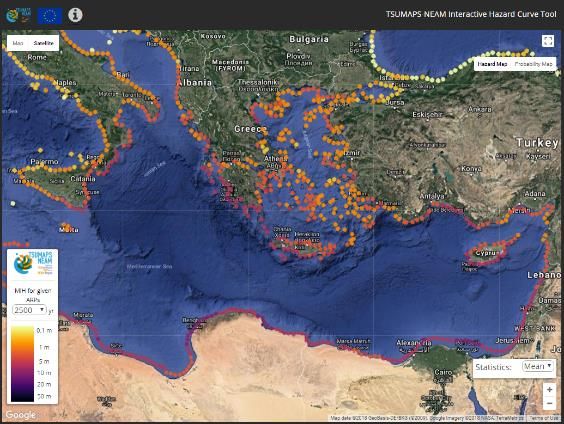
Bringing tsunami hazard at your fingertips

No authorization, no login, no special permission is required to access the TSUMAPS-NEAM
tsunami hazard assessment. Data can also be seamlessly downloaded on your personal
computer. Just go online and start browsing.

Navigating the portfolio of hazard and probability maps
                                                                        There are 30 different hazard
                                                                        displays in this mapper. Five
                                                                        hazard map views for average

           1                                 2                          return periods of 500, 1,000,
                                                                        2,500, 5,000, and 10,000
                                                                        years, and five probability
                                          1) Base Map Switcher          map views for maximum
                                          2) Map Display Switcher       inundation heights of 1, 2, 5,
                                          3) Statistics Switcher        10, and 20 meters. For each
                                          4) MIH-PoE Selector with      map, the mean, 16th, and
                                     5       Color Legend for PoIs      84th percentiles can be
                                                                        shown to explore the
                                          5) Interactive PoI circles
                                                                        uncertainty on the reported
                                                                        values. All these displays can
             4                                                          be rendered with different
                                                                        backgrounds and zoom levels
                                                 3                      for enhancing your navigation
                                                                        experience. Whatever map
                                                                        display you select, hazard
                                                                        curves are just one mouse-
                                                                        click away…

                               Exploring hazard curves for any Point of Interest
… click anywhere on the map
 and the hazard curves of the
 nearest point of interest will
          pop up. When mouse-
      hovering on these curves
  your pointer shapes-up as a
                                                  2
 crosshair to visually connect
      the axes of the plot and a
 balloon that shows the exact                                                  1
  values of the curve. Use the
   filters on the left-hand side
       of the pop-up window to
turn on and off hazard curves                         3
  of different percentiles. Got
    the point of your interest?
You’re ready to download the
       hazard curve data or the                       1) Hazard Curves
       image of the hazard plot                       2) Hazard Curve Filter
   through the provided links.                        3) Data Export Links

                                                                                                     7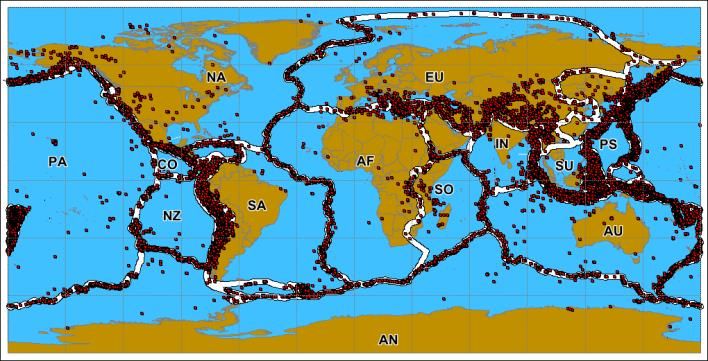
Simple facts to remember about the tsunami
               An unprecedented look at tsunami hazard
    Uniform region-wide                                                  Tsunami waves can travel long
    hazard mapping allows                                                distances without losing their
    you to compare the                                                   destructive power. Therefore,
    hazard of places that                                                relatively high hazard can even
    are very far apart from                                              affect places that are very far
    each other.                                                          from the stronger earthquake
                                                                         sources that generate
                                                                         tsunamis. This is the case for
                                                                         northeastern Africa, the
                                                                         Balearic Islands, and most of
                                                                         the coasts of the Atlantic Sea.

                                                        The highest tsunami hazard of the
                                                        NEAM region is to be found in the
                                                        central-eastern Mediterranean.

    Compare at a glance the hazard of places as far
                  apart as Ireland and the Black Sea.
          Ireland can be affected by tsunamis from
    earthquake sources as distant as the Caribbean
      subduction, whereas the Black Sea, an almost
               closed basin, can be affected by local
    earthquake sources only. Such comparisons are
         possible only because tsunami hazard was
                   computed all at once everywhere.

                                                              Although Libya and Egypt do not host important
                                                              seismic sources, this probability map shows that their
                                                              coastlines are more likely to be affected by maximum
                                                              inundation heights of 1 meter than the coastlines of
                                                              southern Italy, Greece, Turkey, and Cyprus which are
                                                              the nearest to the subduction zones that host the
                                                              largest seismic sources of the entire NEAM region.

8
hazard of the NEAM region
Catastrophic events, such as
those that can produce
maximum inundation heights
larger than several meters, are
rare but not impossible. 0.002
Compare the hazard curves
at these two localities.
The probability of exceeding
a maximum inundation
height of 5 meters in
northern Libya is 25 times
larger than in southern Sicily.
0.05
Map showing the probability of exceeding an inundation
height of 5 meters in 50 years.
Over 30% of NEAM coastlines can be
affected by a maximum inundation height
larger than 1 meter with an average return
period of 2,500 years.
This pie chart shows the percentage of NEAM coastlines that can
be affected by different maximum inundation heights. Notice
that this percentage decreases with increasing maximum
inundation height because larger events are rarer.
Be aware though…
… that the above few facts cannot substitute for an in-depth analysis of the hazard/probability
maps and curves.
… that even if two places have the same mean hazard, the actual hazard can be very different for
different percentiles. Look at how spread apart are the hazard curves of any point of interest.
Never forget that all estimates are affected by uncertainties.
… that 1-meter MIH at one POI may indicate 3-4 meters of local maximum run-up. Therefore, a
region-wide hazard assessment cannot replace detailed local hazard assessments.
… that reusing hazard data for risk-management applications and decision making is not
necessarily straightforward. Always rely on the work done by specialists.
9Use cases
Establishing a regional long-term probabilistic The main advantage of the probabilistic approach
tsunami hazard assessment for seismic sources is with respect to classical scenario-based methods is
the first step to be undertaken for starting local and that it allows engineers to perform spatially-
more detailed hazard and risk assessments and homogeneous quantitative risk-analysis, and
then risk management. Coastal regulation and decision-makers to base their choices on
planning, building code definition, and safety of quantitative cost-benefit analysis and comparative
critical infrastructures depend on these actions. studies between different areas.
From Long-Term Hazard to Evacuation Maps for Tsunami Early Warning
People can become aware of an impending tsunami by receding sea, roars from offshore. It is important that people
warnings issued by a National authority or by observing knows in advance the possible escape routes toward higher
natural signs, such as strong and/or unusually long shaking, ground.
Example of tsunami awareness material prepared by the Civil
Defence of New Zealand (https://www.civildefence.govt.nz/get-
tsunami-ready/tsunami-public-education-resources/)
In the absence of a probabilistic tsunami hazard map, the local authorities
usually follow the experts’ advice coming from the scientific community.
This sometimes leads to the decision to set the limit of the tsunami hazard
zone at a distance from the coast that corresponds to a certain topographic
height or to a maximum tsunami run-up that may be spatially very
inhomogeneous because it hardly contemplates all the possible scenarios.
Using probabilistic tsunami hazard maps can help making this decision in a
less subjective way. The inundation corresponding to a design probability or
average return period, considering uncertainty for increasing safety, can be
Tsunami warning sign on the beach next to Santa Cruz Harbor
chosen. This type of approach is being followed in New Zealand. The Italian (Photo by Flickr user Cal OES CC BY-NC 2.0
Civil Protection is also following this approach for establishing the national https://flic.kr/p/bCmPnc)
guidelines for the local planning against tsunamis.
Setting priorities for Local Probabilistic Inundation Maps in Hazard and Risk Analyses
Local hazard analyses can be expensive and time consuming, proposed for building codes by civil engineers in the USA) can
and should then be standardized and prioritized. help the work of decision-makers. The priority assessment
Standardization can be based on the comparison with a can be done by comparing the regional hazard at different
common regional analysis. A prioritization based on the locations for that specific ARP. Other aspects can be also
selection of an average return period (ARP) suitable for a taken into account, such as the locally exposed coastal
specific application (e.g., an ARP of 2,500 years is being population or infrastructures.
Local tsunami hazard analysis is computationally
expensive, requiring the use of high-
performance computers, provided that high-
resolution digital elevation models are available
for nearshore and onshore areas. To limit the
computational cost, the analysts needs to select
a limited number of high-resolution inundation
scenarios. The relevant scenarios for the site
under examination can be selected using the
regional TSUMAPS-NEAM results, and then
perform detailed simulations without
compromising the results of the analysis. Example of a high-resolution tsunami inundation map showing the maximum wave height in
the Milazzo Port, southern Italy, for a nearby magnitude 8 earthquake.
10Estimating hazard is a never-ending process
Evaluate epistemic
and aleatory
Perform hazard
uncertainties
study (considering
uncertainties)
Promote/improve data
acquisition
and developments of The virtuous
methods circle of hazard
analysis
Perform deaggregation
Identify most critical and sensitivity to evaluate
datasets and parameters impact of individual
for site/area/application datasets and parameters
of interest
Several technical steps are more complex approaches to be
required to obtain effective explored.
hazard analyses. This work has to Building on the legacy of recent
be carried out by specialists and European research projects
it’s never a one-shot deal. It’s dedicated to develop data and
rather a never-ending process, as methods for tsunami hazard
schematically illustrated above. analysis, the TSUMAPS-NEAM
One full round of this virtuous project has brought about the
circle may take several years to be first homogeneous long-term
completed. At each new round, tsunami hazard assessment for
hazard maps can be made better the NEAM region. Only a few
and updated. Successive hazard actions are now needed to
projects will not only use better complete the first round of the
data and smarter methods, but virtuous circle. Then we can start
will also exploit technological a new round and carry on over
advancements and innovations, and over again for continuously
such as the enhanced bettering the tsunami hazard
performances of computer maps, and improve our countries’
systems that becomes more protection and resilience against
powerful year by year allowing for tsunami disasters.
11Contacts
INGV
Istituto Nazionale di Geofisica e Vulcanologia
Via di Vigna Murata, 605, 00143, Roma, Italy
http://www.tsumaps-neam.euYou can also read