Lender Presentation March 2018 - Amazon AWS
←
→
Page content transcription
If your browser does not render page correctly, please read the page content below
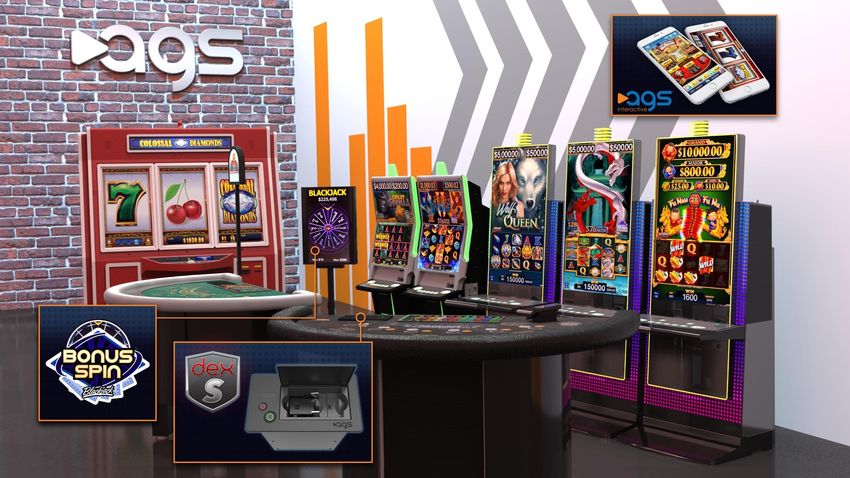
Social Casino

                                Core EGMs
                                  ICON

Specialty EGMs
    Big Red

                                                                  Premium EGMs
                                                                      Orion

                                         Table Games

              Table Equipment

 Lender Presentation                                              March 2018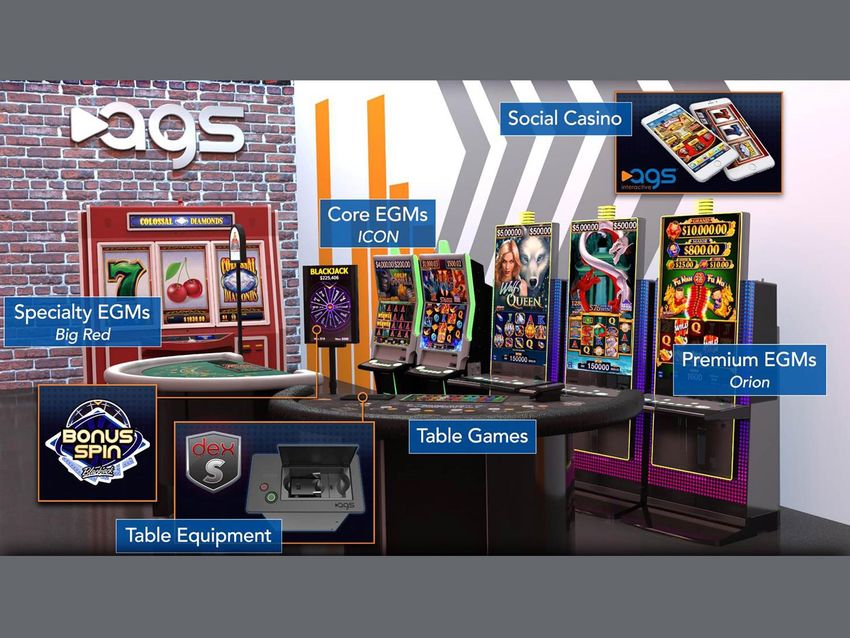
CAUTIONARY NOTE REGARDING FORWARD-LOOKING STATEMENTS
This presentation and information contained herein constitutes confidential information and is provided to you on the condition that you will hold it in strict
confidence and not reproduce, disclose, forward or distribute it in whole or in part, other than to your directors, officers and employees who have a need to know such
information, without the prior written consent of AGS.

This presentation contains statements that constitute forward-looking statements which involve risks and uncertainties, including such risks and uncertainties
described in the Annual Report on Form 10-K of PlayAGS, Inc. (“AGS”) for the fiscal year ended December 31, 2017 filed with the Securities and Exchange Commission.
These statements include descriptions regarding the intent, belief or current expectations of AGS or its officers with respect to the consolidated results of operations
and financial condition, future events and plans of AGS. These statements can be recognized by the use of words such as "expects," "plans," "will," "estimates,"
"projects," or words of similar meaning. Such forward-looking statements are not guarantees of future performance and actual results may differ from those in the
forward-looking statements as a result of various factors and assumptions. These statements are subject to risks, uncertainties, changes in circumstances, assumptions
and other important factors, many of which are outside management’s control, that could cause actual results to differ materially from the results discussed in the
forward-looking statements. You are cautioned not to place undue reliance on these forward looking statements, which are based on the current view of the
management of AGS on future events. We undertake no obligation to publicly update or revise any forward-looking statement contained in this presentation, whether
as a result of new information, future events or otherwise, except as required by law. In light of the risks, uncertainties and assumptions, the forward-looking events
discussed in this presentation might not occur, and our actual results could differ materially from those anticipated in these forward-looking statements.

This presentation also contains references to Earnings Before Interest, Taxes, Depreciation and Amortization (“EBITDA”), Adjusted EBITDA and other measures that are
non-GAAP financial measures. Management believes that EBITDA and Adjusted EBITDA and related measures are commonly reported by companies and widely used
by investors as indicators of a company’s operating performance. There are other non-GAAP financial measures which should be considered only as a supplement to,
and not as a superior measure to, financial measures prepared in accordance with GAAP. Please refer to the last slide of this presentation for a reconciliation of certain
non-GAAP financial measures included in this presentation to the most directly comparable financial measure prepared in accordance with GAAP.

Unless otherwise noted, information included herein is presented as of the dates indicated. This presentation is not complete and the information contained herein
may change at any time without notice. Except as required by applicable law, we do not have any responsibility to update the presentation to account for such
changes.

Certain information in this presentation is based upon management forecasts and reflects prevailing conditions and management’s views as of this date, all of which
are subject to change. In preparing this presentation, we have relied upon and assumed, without independent verification, the accuracy and completeness of all
information available from public sources or which was provided to us by third parties. The information contained herein is subject to change, completion or
amendment and we are not under any obligation to keep you advised of such changes. We make no representation or warranty, express or implied, with respect to
the accuracy, reasonableness or completeness of any of the information contained herein, including, but not limited to, information obtained from third parties.

The information contained herein is not intended to provide, and should not be relied upon for, accounting, legal or tax advice or investment recommendations.

                                                                                                                                                                             1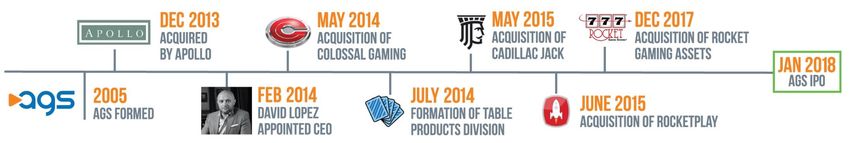
AGS COMPANY OVERVIEW

 FINANCIAL SNAPSHOT            SEGMENT BREAKDOWN                     SIGNIFICANT WHITESPACE
 FY 12/31/17                                                               OPPORTUNITY
 $212mm Revenue
 +27% Y-o-Y
                                  80% RECURRING REVENUE
                                   EGM: $200mm
                                       +28% Y-o-Y
 $107mm Adjusted EBITDA
                              Table Products: $4mm      FY
 +25% Y-o-Y                                          12/31/17
                                        +52% Y-o-Y
                                 Interactive: $8mm
                                                     Revenue
 50% Adjusted EBITDA margin            +3% Y-o-Y
                                                                              Mexico     Canada       Philippines     Brazil

                                                                Established   Ramping   Early Entry   Prospective   No Gaming

CORPORATE EVOLUTION

                                                                                                                                2
DIVERSE PORTFOLIO PROVIDING COMPLETE SUITE OF PRODUCTS
EGMs
Cabinets Titles
Unique Cabinet Designs Content Drives
Drive Performance Performance
New Orion family 50+ titles set to
significantly expands launch
premium offerings
Some of the highest
Demand continues for performing games in
ICON cabinet the industry
Expanding Interactive
Channels
New Table Equipment Leverages land-based
EGMs
30+ unique offerings
Newly launched B2B
New single-deck card business
shuffler
Potential upside from
real money gaming
Table Products Interactive
Ability to Cross-Sell Between Product Categories Provides for Meaningful Synergies
3
EGM PERFORMANCE OVERVIEW
EGM Installed Base(1) Steady Ramp in Number of Leased EGMs
~100% recurring business; ~80% gross profit margin(2)
VLT High
+23% recurring
Class III 1,217
5% revenue
2,909 23,805
12% 20,851
Strong 19,251
relationships 7,727
6,898
23,805 Class II 6,112
11,952 Stable
Brazil & leased 50% business 13,953 16,078
Intl 13,139
Philippines 7,727 EGMs
upside 33%
2015 2016 2017
Domestic International
+12% +15% ($ in mm)
18.1%
Recurring CAGR
Revenue $113.5 $144.5 $158.3
Y-o-Y Growth
EGM Revenue and Adjusted EBITDA Huge Growth in Sold EGMs
($ in mm) ~50% gross profit margin(3)
~700
Units Sold
$199.9 in Q4 17
Achieved +5% ship share
$156.4 2,565
in Q4 17 vs.
EGM SEGMENT
COMPREHENSIVE EGM PRODUCT LINE-UP
                         ICON                   Orion Slant                        Orion Portrait                              Big Red                                  Alora            New Cabinets
                 Best value in the industry   Fills the need for the              Performance focused,                 Ultra Jumbo Format with                Utility cabinet designed   Robust product pipeline
                 and smartest price point.        fastest-growing                 premium portrait. One                    classic gameplay                    specifically for video-     fuels future growth
                  Core cabinet for mass           segment of the                  of the top-performing                                                             bingo players
                          market                      market                        cabinets in the U.S.

                                                                                                                            Specialty Large                             Latin-Style
 Cabinet Type                Core                     Core Plus                            Premium                                                                                               Planning
                                                                                                                               Format                                     Bingo

 Key Markets          Class II/Class III       Growth/Class III                       Growth/Mixed                                 Mixed                      Growth/International
                                                                                                                                                                                                  50 new
                                                                                                                                                                                                  titles &
      Year                                       Launching in                                                                                                           Launching in               5 new
                            2015                                                              2017                                  2014
  Introduced                                       Q2 2018                                                                                                                Q1 2018
                                                                                                                                                                                                 cabinets
Installed Base              2,741              Not yet released                                935                                   235                          Not yet released               through
     RPD                    ~$25                        ~$35                                  ~$50                                  ~$85                                  $10-$30
                                                                                                                                                                                                    2020

Units Sold 2017             1,555              Not yet released                                749                                   N/A                          Not yet released

     ASP                  ~$15,000                    ~$18,000                            ~$20,500                                   N/A                                   N/A

                                              Note:     ASP figures and installed base as of 12/31/2017. Installed base units are contracted recurring revenue units.

                                                                                                                                                                                                               5
TABLE PRODUCTS PERFORMANCE OVERVIEW
Table Products Installed Base and ALP
Over 30 different products, including premium table
games (poker and blackjack derivatives), side bets, ~70% Side Bets
progressive systems, card shufflers and table ~25% Progressives
~5% Premium 2,400
signage
Full quarter contribution of In Bet assets 1,500
125+ Bonus Spin units in the field 815
Quadrupled Buster Blackjack installed base since
acquisition in September 2015 2015 2016 2017
Adjusted EBITDA positive in Q4 ‘17 ALP
($ in mm) $171 $194 $171
Table Revenue Adjusted EBITDA
($ in mm) ($ in mm)
~100% Q4 17
Recurring $0.2
$4.1
$2.7
$1.7 ($0.5)
($1.4)
($1.7)
2015 2016 2017 2015 2016 2017
6
INTERACTIVE PERFORMANCE OVERVIEW
B2C - continued focus on optimizing marketing
spend by decreasing user acquisition fees
ARPDAU increased by ~10% to $0.54 in Q4 due to
marketing optimization and increased attention on
player
Significant EBITDA improvement in 2017 compared
in 2016
Ended the year with six signed agreements for
Social WLC, our B2B offering
Interactive Revenue Adjusted EBITDA
($ in mm) ($ in mm)
$7.7 $8.0 ($0.4)
($2.5)
($4.7)
$2.0
2015 2016 2017 2015 2016 2017
7
FAVORABLE CASH FLOW DYNAMICS PRODUCE HIGH DISCRETIONARY
CASH FLOW AND PERMIT ATTRACTIVE ROI INVESTMENTS
Favorable Cash Flow Drivers
Total Adjusted EBITDA – industry-leading 50%
Adjusted EBITDA margins (vs ~32% for peers) Growth capex – builds recurring revenue base by
Strong placing higher yielding leased cabinets with
Cash taxes – significant NOLs of over $100 cash flow highly compelling ROIs
million and high D&A result in no cash taxes for high-ROI
investments, • 12 month payback on core units and 8
growth and months on premium units
Working capital – change in net working capital
deleveraging
is only ~1% of revenue
Intangibles – primarily capitalized R&D that
facilitates cutting edge hardware and content
Maintenance capex – refurbishment obligations
development
on existing installed base are low and decreasing
Strong Cash Flow Conversion
>90% cash flow conversion(1)
Reinvestment in high
ROI growth
Significant potential
97.3%(1)
for future
deleveraging
2016 2017
(1) Percentages equal (EGM Adjusted EBITDA – maintenance capex) / EGM Adjusted EBITDA
8
SUMMARY OF Q4 AND FY 2017 FINANCIAL PERFORMANCE

                      Revenue                                                                                                       Adjusted EBITDA
($ in mm)                                                                                    ($ in mm)

                                                 $57.7
            $42.7                                 $1.9
                                                  $1.6                       Recurring
             $1.8                                                            Revenue                                                                                       $26.4
             $0.7                                                              $45.2                                   $22.1

                                                  $54.2                                                                 $23.0                                               $26.3
             $40.3
                                                                                                                    Tables: ($0.3)                                       Tables: $0.2
                                                                                                                  Interactive: ($0.7)                                 Interactive: ($0.1)

            Q4 '16                               Q4 '17                                                                Q4 '16                                              Q4 '17
                EGM   Table Products         Interactive

                                                 $212.0
                                                   $8.0
            $166.8                                                           Recurring
                                                   $4.1
             $7.7                                                            Revenue
             $2.7                                                             $170.3                                                                                      $106.8
                                                                                                                       $85.3
                                                 $199.9
            $156.4                                                                                                      $91.7                                              $107.8
                                                                                                                    Tables:
                                                                                                                     Table: ($0.3
                                                                                                                            ($1.7)                                      Tables:
                                                                                                                                                                          Table: ($0.5)
                                                                                                                                                                                 $0.2
                                                                                                                  Interactive: ($4.7)
                                                                                                                               ($0.6)                                 Interactive: ($0.4)
                                                                                                                                                                                   ($0.1)

            FY 2016                             FY 2017                                                               FY 2016                                             FY 2017
                EGM   Table Products         Interactive

                              Note:    Adjusted EBITDA allows us to add back certain non-cash charges that are deducted in calculating net income and to deduct certain gains that are included in
                                       calculating net income. However, these expenses and gains vary greatly, and are difficult to predict. They can represent the effect of long-term strategies as opposed
                                       to short-term results. In addition, in the case of charges or expenses, these items can represent the reduction of cash that could be used for other corporate
                                       purposes.                                                                                                                                                                9
2017 BUSINESS HIGHLIGHTS
Launch of Orion Portrait in Q1 2017; ended year with ~1,900(1) units
Achieved over 5% ship share(2) in 2H 2017
2,565 EGMs sold in 2017 vs 465 in 2016 (452% increase)
Optimized ~1,600 legacy EGM units in 2017
Grew the recurring EGM base by more than 2,900 units in 2017
Continued success of ICON core cabinet; ended year with over 4,700(1) units
Acquisition of ~1,500 Class II units from Rocket Gaming in Q4 2017
Table Products segment EBITDA positive in Q4 2017
Launched 7 new table products in 2017
Acquisition of nearly 500 table game units from In Bet Gaming in Q4 2017
Interactive segment EBITDA positive in December 2017
Successful launch of our new B2B Social White Label Casino platform
AGS selected as one of Nation’s Best & Brightest Companies to Work For®
(1) Includes sales, leases and trials
(2) Q4 Eilers Survey
10CAPITAL STRUCTURE UPDATE
AGS priced its IPO on January 25th (NYSE: AGS)
• 10,250,000 shares offered at $16.00 per share for net proceeds of $149 million
• Day 1 trading performance ( 15.6%), 31%+ since IPO(1)
• Greenshoe option was exercised for an additional 1,537,500 shares at $16.00 per share for net proceeds
of $23 million on February 27, 2018
Repricing overview:
• On February 6, 2018, AGS repriced its existing $513 million B term loan due February 2024
• Reprice from L + 550 bps to L + 425 bps, saving over $6 million in annual interest expense
Pro Forma Capitalization
($ in mm)
12/31/17 Adj. Pro Forma Rate Maturity
Capitalization
Cash $19 $18 $37
$30 million existing revolver – – – L + 4.25% 6/6/2022
First lien term loan 513 – 513 L + 4.25% 2/15/2024
Other 3 – 3 Various –
Total first lien debt $515 $515
HoldCo PIK notes $153 (153) – 11.25% 5/28/2024
Total debt $668 $515
Total net debt 649 478
(1) As of 3/13/18.
11EXPANDED FOOTPRINT WITH MANY NEWLY ENTERED JURISDICTIONS
WA
AK 31,841
92 ME
MT 1,564
17,681 ND
OR 4,298
19,707
ID MN VT
21,992 NH MA
3,739
SD WI NY 1,362
16,659 34,498
WY 14,990
CT RI
1,719
MI 9,011
31,557 5,311
NV IA PA NJ
NE 19,254 25,971 13,972
161,701 672
IL IN OH DE
UT 18,526
CA CO 37,652 19,047
WV
6,724
72,704 13,908 KS MO MD
KY
13,111 VA 11,748
8,334 16,610
1,776
NC
AZ OK TN 4,647
16,808
NM 74,737 AR
20,524 2,849 SC
9%
MS AL GA
30,377 6,602 11%
TX
4,097 LA % of total
11%
NL 41,910 units
1,896 FL 69%
BC AB 22,081
13,549 20,492 SK MB
7,172 10,099
ON QC
17,429
22,794 PE
520
NB NS Established Ramping Early Entry Prospective No Casino Gaming
2,711 2,895
12SIGNIFICANT WHITESPACE OPPORTUNITY
AGS Estimated
Market Estimated Total
Solid recurring revenue base and
market leadership in core markets of
Stage
Jurisdiction
Units in State(1)
Current Market
Share
Texas 4,097 41.7%
TX, AL and OK Established /
Alabama 6,602 40.6% AGS Q4 ship share
Class II
Oklahoma 74,737 9.2% demonstrates path
AGS has aggressively secured licenses
in, and begun to penetrate, key Ramping
Florida
Montana
22,081
17,681
8.2%
3.3%
to further market
share growth
Class III markets (e.g., NV, Canada, MS) California 72,704 1.8% 12%
Mississippi 30,377 0.8% 27%
New York 34,498 0.9%
Orion Portrait is driving the growth in
early-entry markets
Iowa 19,254 0.5%
New Mexico 20,524 0.5%
Indiana 19,047 0.5%
Recent ship share gains far in excess of
current market share
Louisiana
Michigan
41,910
31,557
0.4%
0.5%
Early Entry
Nevada 161,701 0.4% 12%
Ontario 22,794 0.1%
AGS is not dependent on the
replacement cycle to grow
Ohio
Alberta
18,526 0.0%
20,492 0.0%
Manitoba 10,099 0.0%
1% market share when excluding
established markets
Saskatchewan
Other(2)
7,172
215,400
0.0%
1.9%
Prospective Other(3) 130,667 0.0%
Total 981,920 2.1%
(1) Per Eilers & Krejcik Slot & Table Count 3Q17
(2) Other Early Entry jurisdictions include AZ, CT, DE, ID, IL, KS, MD, MN, ND, NE, NJ, NC, OR, SD, WA, WI and WY
(3) AGS is not currently licensed in U.S. states of AK, AR, CO, KY, ME, MA, MO, PA, RI, WV and Canadian provinces of British Columbia, New Brunswick,
Newfoundland & Labrador, Nova Scotia, Prince Edward Island and Quebec 13EMERGING SUPPLIERS WINNING SHIP SHARE FROM BIG-4
Non-Big-4 Ship Share Increasing as Customers Prefer More Diversification Given Industry Consolidation(1)
23%
20%
Industry consolidation triggered shift 15%
16%
towards Non-Big-4 suppliers
11%
10%
7% 7%
6%
5%
3%
0%
12/09 12/10 12/11 12/12 12/13 12/14 12/15 12/16 12/17
North American Expected FORWARD 12-Month Replacement Ship Share(2)
Big-4 Non-Big-4
23% 22% 23% Operators expect to
allocate ~6% of their
2018 purchases to AGS
10%
6% 5% 4% 4% 3%INTERNATIONAL EXPANSION STRATEGY
Entered the Philippines in Q1 of 2018
Philippines Target 3,000-5,000 unit leased footprint over 3-5 year period, representing
Immediate Upside
~4-7% of market
~70,000 unit market size
Canada is a large untapped market
Official launch into three jurisdictions planned for 2018 (currently in Ontario)
Canada
First installations of ICON cabinets have been successful
OLG privatization has brought a positive change in the market
When legislation is approved, AGS is poised to capitalize on what is
Legislation
Pending
considered one of the most significant expansions in gaming
Brazil
Potential to be a 500,000 gaming machine market
MOUs in place for ~8,700 leased units representing ~1.7% of market
Further Upside
Other
International Latin America, Asia, Australia and Europe all represent future opportunities
Opportunities for growth
15MULTIPLE LEVERS AVAILABLE TO DRIVE FURTHER GROWTH
Opportunities
in B2B and
Gaming real money
legalization gaming
Entering Q1 could support
a 500,000+ Continuing
Ramp up of 2018 strong track
B2B social video bingo
~70,000 unit market record of
New business and accretive
market size
progressive social RGS MOUs in EGM rollups
Penetrate new
markets technology Target 3,000 place with 9
Future Additional
and premium – 5,000 unit operators for
opportunity opportunities
Take share titles will footprint ~8,700 EGMs
through real in various
based on further boost over 3-5
money table games
strong game offerings years
gaming offerings
performance
In Bet Gaming
Significant assets will
yield also drive
optimization growth
opportunity
AGS Today EGMs Table Products Interactive Philippines AGS planned Brazil M&A AGS further
near-term upside
16SUMMARIZING THE AGS OPPORTUNITY
1 Attractive high-margin, recurring revenue model
2 Pure-play casino gaming supplier with outsized growth potential
3 Capitalizing on strong Class II position while continuing to penetrate Class III markets
4 Growth from international expansion in Philippines, Brazil and other markets
5 Strong free cash flow generation allows for reinvestment in business at attractive ROIs
6 Industry-leading R&D platform in both hardware and content
7 Diversified product suite
8 Proven ability to successfully integrate acquisitions and scale the platform
17APPENDIX
COMPREHENSIVE OPERATIONAL SUMMARY
($ in mm, except RPD, ASP, ALP and ARPDAU)

Operational and other data                    Q1         Q2          Q3          Q4         2016         Q1          Q2          Q3          Q4         2017
Revenues by segment
  EGM                                        $37.9       $39.9       $38.4       $40.3     $156.4        $45.0       $47.4       $53.3       $54.2     $199.9
  Table products                               0.7         0.6         0.7         0.7        2.7          0.6         0.7         1.1         1.6        4.1
  Interactive                                  1.7         2.1         2.2         1.8        7.7          2.1         2.0         2.0         1.9        8.0
  Total revenue                              $40.2       $42.6       $41.2       $42.7     $166.8        $47.8       $50.1       $56.4       $57.7     $212.0

Adjusted EBITDA by segment
 EGM                                         $23.8       $24.0       $20.9       $23.0       $91.7       $25.2       $26.5       $29.8       $26.3     $107.8
   % margin                                   62.8%       60.1%       54.6%       57.2%       58.6%       56.0%       55.9%       55.8%       48.6%      53.9%
 Table products                                (0.5)       (0.6)       (0.4)       (0.3)       (1.7)       (0.2)       (0.3)       (0.2)        0.2       (0.5)
 Interactive                                   (2.0)       (1.4)       (0.6)       (0.7)       (4.7)       (0.1)       (0.1)       (0.1)       (0.1)      (0.4)
 Total Adjusted EBITDA                       $21.3       $22.0       $20.0       $22.1       $85.3       $24.9       $26.1       $29.4       $26.4     $106.8
   % margin                                   52.8%       51.7%       48.4%       51.7%       51.2%       52.1%       52.1%       52.1%       45.9%      50.4%

EGM segment
  Total installed base units                 19,747     20,014      20,108      20,851      20,851      21,204      21,479      22,015      23,805      23,805
  Total revenue per day                      $20.52     $20.33      $19.78      $18.55      $19.78      $19.93      $19.99      $19.65      $19.95      $19.88
  EGM units sold                              24           115          66         260         465         453         574         842         696       2,565
  Average sales price                    $16,868       $14,317     $14,361     $15,108     $14,897     $15,695     $15,840     $15,890     $17,676     $16,329
Table products segment
  Table products install base                  923       1,091       1,205       1,500       1,500       1,691       1,754       2,350       2,400       2,400
  Average monthly lease price                 $259       $187        $186        $149        $194        $125        $124        $151        $228        $171
Interactive segment
  Average MAU                            203,183       222,016     207,151     207,009     209,840     192,560     183,912     194,239     200,628     192,835
  Average DAU                             38,381        44,092      42,953      40,488      41,478      38,534      37,191      36,906      37,536      37,542
  ARPDAU                                   $0.49         $0.48       $0.47       $0.49       $0.48       $0.57       $0.58       $0.59       $0.54       $0.57

                                                                                                                                                                  19
TOTAL ADJUSTED EBITDA RECONCILIATION
($ in mm)
Adjusted EBITDA reconciliation Q1 Q2 Q3 Q4 2016
1 Write downs and other includes items related to
Net income ($21.1) ($18.8) ($21.2) ($20.2) ($81.4) loss on disposal or impairment of long lived assets,
Income tax (benefit) expense (2.2) (1.6) (1.2) 1.9 (3.0) fair value adjustments to contingent consideration
and acquisition costs
Depreciation and amortization 20.5 20.6 19.4 19.7 80.2
Other expense (income) 4.4 1.5 0.4 1.1 7.4 2 Loss on extinguishment and modification of debt
Interest income (0.0) (0.0) (0.0) (0.0) (0.1) primarily relates to the refinancing of long-term
Interest expense 14.6 14.6 14.9 15.8 60.0 debt, in which deferred loan costs and discounts
related to old senior secured credit facilities were
1 Write downs and other 0.1 0.2 1.9 1.1 3.3
written off
2 Loss on extinguishment and modification of debt – – – – –
3 Other adjustments 1.1 0.5 0.1 0.2 1.8 3 Other adjustments are primarily composed of
professional fees incurred for projects, corporate
4 Other non-cash charges 1.7 3.6 1.8 1.8 8.9
and public filing compliance, contract cancellation
5 New jurisdiction and regulatory licensing costs 0.0 0.1 0.8 0.4 1.3 fees and other transaction costs deemed to be
6 Legal & litigation expenses including settlement payments 0.7 0.5 0.4 0.1 1.6 non-operating in nature
7 Acquisition & integration related costs 1.3 1.0 2.7 0.4 5.4
Adjusted EBITDA $21.3 $22.0 $20.0 $22.1 $85.3 4 Other non-cash charges are costs related to non-
cash charges and losses on the disposition of
assets, non-cash charges on capitalized installation
and delivery, which primarily includes the costs to
($ in mm) acquire contracts that are expensed over the
estimated life of each contract and non-cash
Adjusted EBITDA reconciliation Q1 Q2 Q3 Q4 2017
charges related to accretion of contract rights
Net income ($12.4) ($20.1) ($4.1) ($8.5) ($45.1) under development agreements
Income tax (benefit) expense 2.2 1.3 1.1 (6.5) (1.9)
Depreciation and amortization 18.5 18.2 16.9 18.1 71.6
5 New jurisdiction and regulatory license costs
relates primarily to one-time non-operating costs
Other expense (income) (2.8) (1.5) (0.5) 1.9 (2.9) incurred to obtain new licenses and develop
Interest income (0.0) (0.0) (0.0) (0.0) (0.1) products for new jurisdictions
Interest expense 15.2 14.6 12.7 13.1 55.5
6 Legal & litigation expenses include of payments to
1 Write downs and other 0.2 1.9 0.5 1.8 4.5 law firms and settlements for matters that are
2 Loss on extinguishment and modification of debt – 8.1 – 0.9 9.0 outside the normal course of business
3 Other adjustments 0.6 0.9 0.5 0.8 2.9
Other non-cash charges 2.1 1.8 1.6 2.3 7.8
7 Acquisition and integration costs include
4 restructuring and severance and are related to
5 New jurisdiction and regulatory licensing costs 0.2 0.5 0.6 0.8 2.1 costs incurred after the purchase of businesses,
6 Legal & litigation expenses including settlement payments 0.4 0.2 0.2 (0.2) 0.5 such as the acquisitions of Cadillac Jack and
7 Acquisition & integration related costs 0.6 0.2 0.1 2.0 2.9 RocketPlay, to integrate operations
Adjusted EBITDA $24.9 $26.1 $29.4 $26.4 $106.8
20TERMS USED IN THIS PRESENTATION
Unless otherwise indicated or the context otherwise requires, the following terms in this presentation have the
meanings set forth below:
Adjusted EBITDA: Total adjusted EBITDA is not a presentation made in accordance with GAAP. Our use of the term total adjusted
EBITDA may vary from others in our industry. Total adjusted EBITDA should not be considered as an alternative to operating income
or net income
Average Monthly Lease Price (ALP): Average monthly lease price is calculated by dividing (a) total revenues recognized and directly
attributable to Table Products by (b) the number of Table Products Installed Base and by (c) the number of months in such period
Average Revenue per Daily Active User (ARPDAU): ARPDAU is calculated by dividing (a) daily revenue by (b) the number of Daily
Active Users
Average Sales Price (ASP): Average sales price is calculated by dividing (a) total revenues recognized and directly attributable to
EGM unit sales in a period by (b) the number of EGM units sold over that same period
Daily Active Users (DAU): DAU is a count of daily unique visitors to a site
EGM Installed Base: EGM Installed Base is the number of recurring revenue EGM units installed on a specified date
Electronic Gaming Machine (EGM): EGMs include but are not limited to slot machines, Class II machines, video poker and video
lottery machines
Monthly Active Users (MAU): MAU is a count of monthly unique visitors to a site
Recurring Revenue: Equal to the Gaming Operations Revenue line of our audited financial statements
Revenue Per Day (RPD): RPD is calculated by dividing (a) total revenues over a specified period recognized and directly attributable
to units on lease (whether on a participation or daily fee arrangement) by (b) the number of units installed over that period and by
(c) the number of days in such period
Ship Share: Ship Share is the share of all slots sold in a specified period
Table Products Installed Base: Table Products Installed Base is the number of recurring revenue table products installed on a
specified date
21CONNECT WITH US
You can also read