Liquefaction Vulnerability Study: Lower Wairau Plains
←
→
Page content transcription
If your browser does not render page correctly, please read the page content below
Liquefaction Vulnerability Study:
Lower Wairau Plains

Prepared for:

Marlborough District Council

Prepared by:

Omer Atlaf, Liam Wotherspoon, Rolando Orense

University of Auckland

Version 1.0

May 2021
SUMMARY
This report summarises the development of liquefaction vulnerability maps for the Lower
Wairau Plains in Marlborough based on the ‘Planning and engineering guidance for potentially
liquefaction-prone land’ (MBIE/MfE/EQC 2017). The methodology and datasets that were used
are summarised in this report and a suite of maps of liquefaction vulnerability categories
presented.

Data availability defined the level of assessment detail that was appropriate across the region
based on the guidance. At the highest level, this was based on geological, groundwater and
seismic hazard data. Geomorphological and basin groundwater geological models were used
to further refine this high-level assessment.

The most detailed assessment was based on a cone penetration test (CPT) dataset, and in
combination with the seismic hazard and groundwater data provided a quantitative liquefaction
assessment for a range of earthquake shaking return period scenarios. Due to the low density
of CPT soundings across the region, this approach could not be used to provide more refined
liquefaction vulnerability categories. For geomorphic zones where CPT data was available,
potential classifications if additional investigations were undertaken are discussed.

Liquefaction vulnerability category maps for Level A and Level B assessments are presented.
The age of deposits across the Wairau Plains and the relatively shallow depth to groundwater
means much of the area is classified as Liquefaction damage is possible. The surrounding hills
are classified as Very low liquefaction vulnerability and areas with deeper groundwater along
the edge of the plains are classified as Liquefaction damage is unlikely. The changes in
classification between Level A and B are discussed, in particular, the areas where the
liquefaction vulnerability of the soil profile is likely dominated by the performance of gravels
and where the profile is dominated by the performance of sand and silt deposits. Some alluvial
deposits in the plains dominated by gravel are classified as Low liquefaction vulnerability, with
investigations in this area suggesting an absence of loose sandy deposits. Combining these
multiple approaches, regional liquefaction-induced ground damage maps are developed for the
Lower Wairau Plains for different levels of investigation detail.

 i
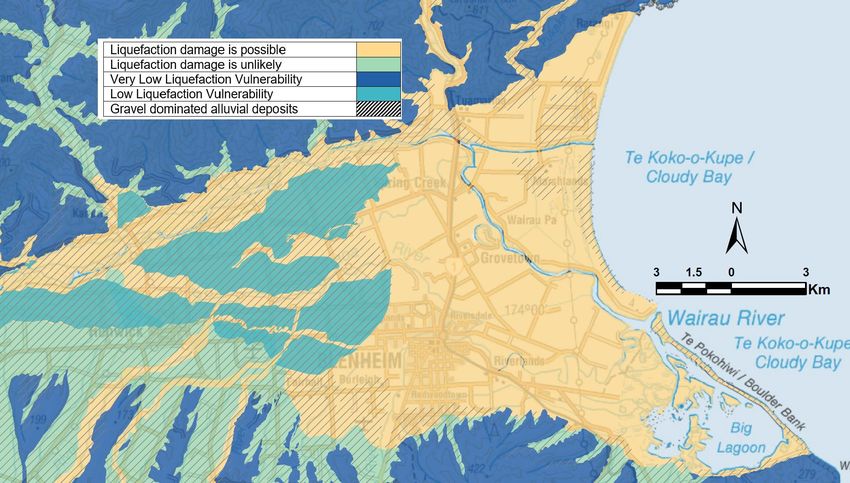
TABLE OF CONTENTS
Summary ..................................................................................................................................... i
Table of Contents .......................................................................................................................ii
1 Introduction ........................................................................................................................ 1
 1.1 Scope of work.............................................................................................................. 1
2 Methodology ....................................................................................................................... 3
 2.1 Level A assessment ..................................................................................................... 6
 2.2 Level B assessment ..................................................................................................... 7
 2.3 Level C assessment ..................................................................................................... 7
3 Ground Conditions ............................................................................................................. 9
 3.1 Geology ....................................................................................................................... 9
 3.2 Geomorphology ......................................................................................................... 10
 3.2.1 Rapaura Formation............................................................................................. 10
 3.2.2 Dillions Point Formation.................................................................................... 12
 3.2.3 Speargrass Formation......................................................................................... 13
 3.2.4 Hillersden Gravel ............................................................................................... 13
 3.2.5 Colluvium deposits ............................................................................................ 13
 3.2.6 Marlborough Schist ............................................................................................ 13
 3.3 Groundwater .............................................................................................................. 15
4 Seismic Hazard ................................................................................................................. 17
5 Observations from 2016 Kaikōura Earthquake ................................................................ 20
6 Basic Desktop Assessment ............................................................................................... 22
7 Level B Liquefaction Vulnerabilty Assessment ............................................................... 26
 7.1 Geomorphology-based screening .............................................................................. 26
 7.1.1 Lower elevation overbank gravel, Sand and silt flood plains ............................ 27
 7.1.2 Active floodplain alluivial gravel, sand and silt ................................................ 27
 7.1.3 Mid-elevation overbank gravel, sand and silt .................................................... 27
 7.1.4 Higher elevation overbank gravel, sand and silt ................................................ 28
 7.1.5 Alluvial fan gravel, sand and silt ....................................................................... 28
 7.1.6 Proximal alluvial gravel, sand and silt ............................................................... 28
 7.1.7 Paleo-channels ................................................................................................... 28
 7.1.8 Swamps .............................................................................................................. 28
 7.1.9 Recent alluvial deposits ..................................................................................... 29

 ii

7.1.10 Lagoon deposits ................................................................................................. 29
 7.1.11 Beach ridges ....................................................................................................... 29
 7.1.12 Other deposits: ................................................................................................... 30
 7.1.13 Summary of geomorphological screening ......................................................... 30
 7.2 Basin geological model ............................................................................................. 34
 7.3 Geotechnical investigation data screening ................................................................ 38
 7.3.1 Mid-elevation overbank gravel, sand and silt .................................................... 40
 7.3.2 High-elevation overbank gravel, sand and silt ................................................... 41
 7.3.3 Recent alluvial gravel, sand and silt .................................................................. 42
 7.3.4 Speargrass Formation glacial outwash gravel, sand and silt.............................. 43
 7.3.5 Alluvial fan gravel, sand and silt ....................................................................... 44
 7.4 Summary ................................................................................................................... 46
8 CPT-based Assessment..................................................................................................... 51
 8.1 Paleochannels with alluvial sand and silt .................................................................. 56
 8.2 Proximal alluvial gravel, sand, and silt ..................................................................... 57
 8.3 Low elevation overbank sand and silt ....................................................................... 58
 8.4 Mid elevation overbank gravel, sand and silt ............................................................ 60
 8.5 Recent alluvial sand and silt ...................................................................................... 62
 8.6 Regional scenario maps ............................................................................................. 64
 8.7 Summary ................................................................................................................... 69
9 Lateral spreading vulnerabilty .......................................................................................... 70
10 References ..................................................................................................................... 72
Appendix A .............................................................................................................................. 75
 Explanation of assigning precise categories following Level B assessment (extracted from
 MBIE/MfE/EQC 2017) ......................................................................................................... 75
Appendix B .............................................................................................................................. 76
 Details of different degrees of liquefaction-induced ground damage .................................. 76

 iii
1 INTRODUCTION
This report summarises a liquefaction vulnerability assessment of the Lower Wairau Plains in
Marlborough. The primary objective of this assessment is the definition of the spatial
distribution of liquefaction vulnerability across the region. This report includes the following
information for the study area:
 • Geological and geotechnical conditions
 • Near-surface groundwater characteristics
 • Seismic shaking hazard
 • Case history evidence of liquefaction manifestation
 • Assessment of the likelihood of liquefaction-induced land damage
1.1 Scope of work

The scope of work presented in this report comprises the collation of all available data within
the study area to inform a liquefaction vulnerability assessment based on the ‘Planning and
engineering guidance for potentially liquefaction-prone land’ (MBIE/MfE/EQC 2017). This is
referred to as the MBIE Guidance throughout the remainder of this report. The extent of the
study area in the Lower Wairau Plains is summarised in Figure 1.
The following data is collated to inform this study:
 • Geological and digital elevation model data
 • Geomorphological mapping based on surface expression
 • Regional groundwater lithology models
 • Geotechnical site investigation data
 • Groundwater models from hydrologic and geotechnical sources
 • Case history evidence of liquefaction manifestation, with a focus on the 2016 Kaikōura
 earthquake
This data is used to inform the appropriate level of assessment detail across the study area
based on the MBIE Guidance. Geological, groundwater and seismic hazard data is used to
undertake a high-level assessment. Geomorphological and basin groundwater geological
models are used to further refine this high-level assessment.
A cone penetration test (CPT) dataset is used along with the seismic hazard and groundwater
data to provide an assessment of the liquefaction hazard for a range of earthquake shaking
return period scenarios. CPT soundings in each geomorphic zone are grouped together to
provide an indication of the representative performance of the soils in these areas. Where
possible, observations from the 2016 Kaikōura earthquake are used to further inform the CPT-
based liquefaction assessment.

 1
The output of this scope of work is the report presented herein and a suite of maps of
liquefaction vulnerability categories for the study area.

Figure 1: Geographic location of the Lower Wairau Plains and extent of the study area.

 2
2 METHODOLOGY
In order to develop liquefaction vulnerability categories for the Lower Wairau Plains, the
methodology presented in the MBIE Guidance summarised in Figure 2 is applied. Liquefaction
vulnerability categories are based on performance criteria that relate a category to the
probability of different levels of liquefaction-induced ground damage severity for a given
return period of ground shaking.

Figure 2: Overview of the recommended process for categorizing the potential for
liquefaction-induced ground damage (MBIE/MfE/EQC 2017).

The first step in this methodology is the definition of the level of detail for the assessment so
that the required level of data and resources can be defined. Figure 3 summarises the different
levels of detail of the liquefaction assessment approaches from the MBIE Guidance. Three
levels of assessment are discussed in this study: Level A, B and C. Level A is a basic desktop
assessment, Level B is a calibrated desktop assessment and Level C is a detailed region-wide
assessment. These are discussed in more detail in the following sections.
The liquefaction vulnerability categories (referred to as category or categories througout this
report) assigned in each level of assessment are summarised in Figure 4. As the spatial density
of available information increases, the precision of categorisation can increase. The default
vulnerability category is Liquefaction Category is Undetermined. This is assigned to areas
where a liquefaction assessment has yet to be undertaken, or if there is not enough information

 3
to define an appropriate category. The remaining categories are defined based on the
probability of different ground damage severities for a 500 year return period ground shaking,
and in some cases, 100 year return period ground shaking. When undertaking a liquefaction
assessment using a desktop approach, it is typical to first focus on whether Liquefaction
damage is unlikely, where there is a greater than 85% probability of none-minor ground damage
for a 500-year return period level of ground shaking, or Liquefaction damage is possible, where
there is a greater than 15% probability of minor-moderate ground damage for a 500-yearreturn
period level of ground shaking. For Level A and Level B assessments, it is often not possible
to assign liquefaction vulnerability categories with any more precision than this. In some cases
a more precise category can be assigned with confidence, such as a Very Low category for
exposed rock outcrops. Level C assessments can shift the classification to more the refined
categories of Very Low, Low, Medium and High for areas where a high spatial density of site
investigation data is available. The details of these are discussed in subsequent sections of the
report.
The probabilities used as part of the liquefaction vulnerability assessment are intended to be a
general guidance framework rather than targets for a specific calculation. They are used along
with qualitative and quantitative estimates of the uncertainty associated with the input data to
define an appropriate liquefaction vulnerability category. This is discussed in relation to each
level of assessment applied in this report.

 4
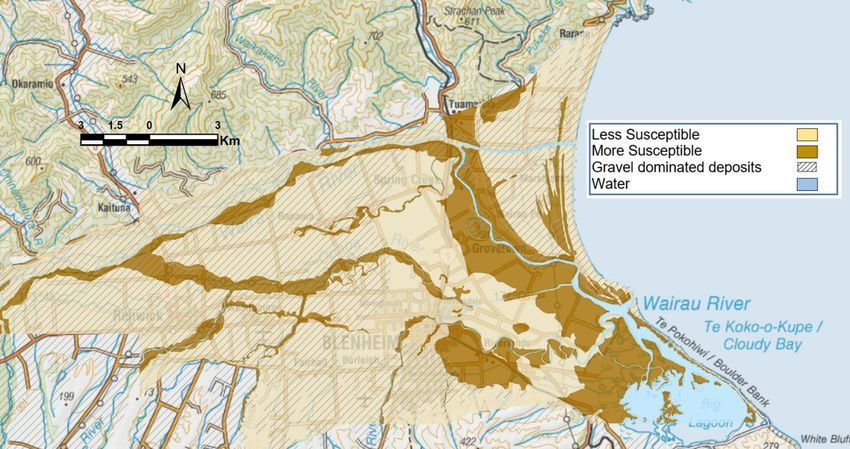
Figure 3: Levels of detail for liquefaction assessment studies (MBIE/MfE/EQC 2017).

Figure 4: Recommended liquefaction vulnerability categories for use in liquefaction
assessment studies to inform the planning and consenting process (MBIE/MfE/EQC 2017).

 5
2.1 Level A assessment
The Level A assessment is a basic desktop study that utilises surface geology, groundwater and
seismic hazard characteristics to classify the liquefaction-induced ground damage potential.
One of the primary focuses of this assessment is to identify land where Liquefaction damage
is unlikely so that it can be removed from further assessment. Where there is enough confidence
in the available data, the remaining areas can be classified as Liquefaction damage is possible.
Areas where there is not enough information to determine an appropriate category can be
classified as Liquefaction category is undetermined.
Potentially liquefiable deposits can be defined based on the classification by Youd & Perkins
(1978) and other researchers (Pyke 2003, Youd et al. 2001). This geology-based classification
considers the regional seismic hazard and the depth to groundwater in conjunction with the age
and depositional processes that formed the soil deposits. A semi-quantitative screening criteria
illustrated in Table 1 is used in the MBIE Guidance to identify geological units where
liquefaction-induced ground damage is unlikely to occur. A soil deposit of the specified type
may be assigned a liquefaction vulnerability category of Liquefaction damage is unlikely if the
500-year return period peak ground acceleration (PGA) is less than the value listed, or if the
depth to groundwater is greater than the value listed. The listed PGA values correspond to a
moment magnitude (Mw) 7.5 earthquake. When using this table for screening purposes,
earthquake scenarios with different moment magnitudes may be scaled using the magnitude
scaling factor (MSF) proposed by Idriss and Boulanger (2008):

 −
 = 6.9 exp ( ) − 0.058 up to a maximum value of 1.8.
 4

For regions where the design moment magnitude is less than 7.5, the limits for a Mw7.5 in
Table 1 is multiplied by the MSF to get the limits for an equivalent earthquake.

 6
Table 1: Semi-quantitative screening criteria for identifying land where liquefaction-induced
ground damage is unlikely based on a Mw7.5 earthquake (MBIE/MfE/EQC 2017).
 A Liquefaction Vulnerability category of
 Liquefaction damage is unlikely can be assigned
 if either of these conditions are met:
 Design peak ground
 acceleration (PGA) for the Depth to
 500-year intensity of groundwater
 Type of soil deposits earthquake shaking
 Late Holocene age < 0.1 g >8m
 Current river channels and their
 historical floodplains, marshes and
 estuaries, reclamation fills
 Holocene age < 0.3 g >6m
 Less than 11,000 years old
 Latest Pleistocene age < 0.3 g >4m
 Between 11,000 and 15,000 years old

2.2 Level B assessment
The Level B assessment is a calibrated desktop assessment, where the details from the Level
A assessment are further refined using additional datasets that can further clarify the subsurface
characteristics and potential land performance. Qualitative assessment using simple screening
criteria based on geomorphology can identify areas where there is potential for liquefaction
induced ground damage to occur, or the landform suggests it may have occurred. Any other
regional information on subsurface deposits can inform the calibration of the liquefaction
vulnerability categories, such as subsurface investigation data or models derived from this data.

2.3 Level C assessment
The Level C assessment is a detailed area-wide assessment based on cone penetration test
(CPT) soundings and applies a quantitative approach. These CPT soundings from across the
region are used to estimate the degree of liquefaction-induced ground damage for a range of
peak ground accelerations (PGA) and earthquake magnitudes that are representative of the
seismic hazard across the region.
CPT data and the seismic hazard and the groundwater data discussed in the Level A assessment
are used to estimate where liquefaction is expected to trigger (occur) within the soil profile of
a particular site. The combined effect of this triggering throughout the soil profile is used to
estimate the severity of liquefaction-induced land damage at the ground surface.
One of the key aspects of a quantitative liquefaction assessment is understanding the correlation
between the results of liquefaction analysis and the ground damage that is likely to occur. As
outlined in the MBIE Guidance, when assigning liquefaction vulnerability categories for an

 7
area-wide hazard assessment it is important to account for the uncertainties within the
assessment, and the potential consequences of over-estimating or under-estimating the
liquefaction vulnerability.
When there is not a high enough spatial density of CPT soundings from across a region to
inform an overall Level C assessment, the outputs can be used to classify small areas where
the density of investigations is adequate. These outputs can also be fed back into the calibrated
desktop assessment if the level of certainty is not high enough to inform the Very Low – High
vulnerability categories.
Observations from the 2016 Kaikōura earthquake are used in this report to assess the CPT-
based liquefaction assessment. The work of Ogden (2018) highlights locations where these
CPT based methods are able and unable to predict the manifestation in the Kaikōura
earthquake. The CPT based classification is discussed in the context of these observations of
the performance of soil profiles in the region.

 8
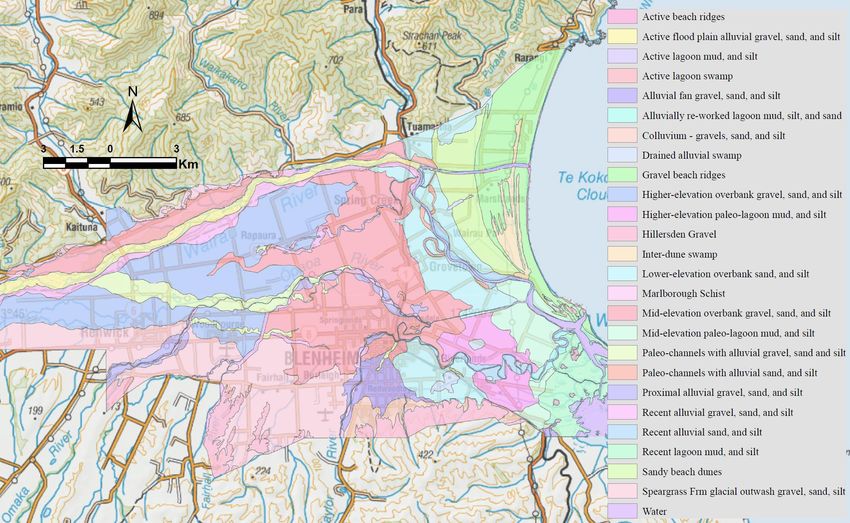
3 GROUND CONDITIONS
3.1 Geology
The Lower Wairau Plains are located in the north-east of the South Island of New Zealand in
the region of Marlborough. The region is intersected by many active crustal faults such as the
Wairau, Awatere, and Clarence Faults (Rattenbury et al. 2006). The Lower Wairau Plains are
predominantly flat to gently undulating alluvial plains, underlain by Holocene age marine and
estuarine silts and sands of the Dillons Point Formation, and alluvial gravels and sands of the
Rapaura Formation. The soils of the Dillons Point Formation are observed to vary significantly
in their composition and degree of consolidation, varying between loose sands and soft silts to
very dense sands and very dense clayey silts (MDC 2012). The alluvial sediments to the eastern
margin of the Wairau Plains are inter-fingered with lagoonal muds and coastal sands, silts, and
gravels which reflect coastline progradation and marine regression following the mid-Holocene
high stand 6,000 years ago (Basher 1995). As shown in Figure 5, near‐surface sediments
present in the Lower Wairau Plains towards the coast are postglacial swamp, lagoonal estuarine
and beach deposits that overlie fluvial and glacial outwash deposits. Figure 6 summarises the
surface geological deposits present in the Lower Wairua Plains.

Figure 5: Near‐surface sediments present in the Lower Wairau Plains (Basher et al., 1995).

 9
Figure 6: Surface geologic map of the Lower Wairau Plains.

3.2 Geomorphology
For liquefaction assessment of the Lower Wairau plains, the Marlborough District Council
commissioned Beca Ltd to prepare a revised geomorphic map of the region and extend the
initial geomorphic map of the coastal portion of the Lower Wairau Plains presented in Bastin
et al., (2018). Mapping comprised a desktop-based study utilising LiDAR-based Digital
Elevation Models (DEM) and aerial imagery, supplemented with the 1:250,000 geologic QMap
(Begg and Johnson, 2000), the geomorphic map by Brown (1981) and literature outlining
drainage modification and the history of the plains. The morphology of the Lower Wairau and
Opaoa Rivers is meandering and is characterised by a single sinuous channel that forms meaner
bends. The geomorphic map for the lower portion of the Lower Wairau Plains is presented in
Figure 7. The level of detail and classifications of the mapped geomorphic features were
selected to inform the liquefaction assessment. Mapped features were identified and
characterised as follows:

3.2.1 Rapaura Formation
– Active flood plain consists of the area immediately adjacent to the braided section of the
Upper Wairau River and are considered liable to flooding during bank full conditions. Deposits
typically comprise alluvial gravel, sands, and silts.
– Recent alluvial deposits are identified as the low elevation areas immediately adjacent to
active rivers and streams and considered liable to flooding during bank full conditions.
Deposits to the west of Blenheim typically contain alluvial gravel, sands, and silts while those
the east contain alluvial sands and silts.

 10
– Proximal alluvial deposits are classified as the low elevation areas proximal to rivers and
streams, typically separated from the active flood plain by a terrace riser. These areas are
typically at a lower elevation than the surrounding alluvial plain suggesting re-working by the
proximal river or stream. Subsurface deposits likely comprise predominantly gravels to the
west of Blenheim, and alluvial sand and silt to the east.
– Overbank flood plains are subdivided into low, mid- and higher- elevation surfaces and
identified as relatively flat surfaces distal to active rivers and streams.
 • Low elevation over-bank deposits consist of areas of low elevation proximal to the
 meandering Lower Wairau River and containing alluvial landforms such as paleo-
 channels. Subsurface deposits likely comprise alluvial sand to silt deposited during
 overbank floods of the Lower Wairau River and associated tributaries. The area is
 indicated in the 1:250,000 QMap as comprising swamp deposits.
 • Mid- and Higher-elevation over-bank deposits are identified to the west of Blenheim
 and likely consist of overbank deposits from the Upper Wairau River and associated
 tributaries. Subsurface deposits are likely predominantly gravels with localised lenses
 of sand to silt.
– Paleo-channels are identified as topographic depressions of similar morphologies to the
active rivers and streams on the surface of the Plains.
 • Paleo-channels in the mid- to higher- elevation flood plains likely contain alluvial
 gravels, sands, and silts and include the former southern branch of the Wairau River
 (Paleo-channels with alluvial gravel, sand and silt).
 • Paleo-channels within the lower elevation flood plain are typically related to cut-off
 and/or abandoned channels of the meandering rivers and streams. Subsurface deposits
 likely comprise alluvial sand to silt (Paleo-channels with alluvial sand, and silt).
– Drained alluvial swamps are identified as topographic depressions distal to active rivers and
streams and consist of areas where water would pool following over-bank flood events and/or
heavy rainfall. Subsurface deposits likely comprise alluvial sands to silts and possibly organics.
– Alluvial fans are identified as higher elevation surfaces at the mouths of valleys containing
tributary streams/ rivers, such as the Taylor River. Landforms are generally semi-circular and
decrease in elevation away from the mouth of the valley. Subsurface deposits likely comprise
alluvial gravels, sands, and silts.

 11
3.2.2 Dillions Point Formation
– Dune/ beach ridges
 • Active beach ridges are identified along the current coastline and are primarily
 composed of well sorted fine to coarse gravel.
 • Gravel beach ridges are recognised as raised linear landforms orientated parallel to the
 existing coastline and extending approximately 5.5 km inland from the active coastline.
 Brown (1981) indicates that the deposits comprise well sorted fine to coarse gravel.
 • Inter-dune swamps are identified in topographic depressions between the gravel beach
 ridges and locally contain standing water. Subsurface deposits likely comprise sand to
 silt.
 • Sandy beach dunes consisting of linear landforms orientated parallel to the existing
 coastline are identified from approximately 5.5 to 7 km inland in the area north of the
 Wairau Lagoon. The features exhibit less prominent topography than the gravel ridges
 and likely consist of well graded sand to silt.
– Lagoon deposits
 • Active lagoon deposits are identified in the aerial imagery as areas of mud to silt within
 the Wairau Lagoon. These areas may be underwater during high tide and/or storm
 events.
 • Recent lagoon deposits are identified as vegetated low elevation areas immediately
 adjacent to the Wairau Lagoon. The aerial imagery indicates that the vegetation
 comprises short grasses typical of marshy settings. Subsurface deposits likely comprise
 loosely consolidated mud to silt.
 • Mid-elevation paleo-lagoon deposits are identified as low elevation areas immediately
 inland from the Wairau Lagoon where beach ridges/ dunes were not observed.
 Subsurface deposits likely comprise mud to silt.
 • Higher-elevation paleo-lagoon deposits are identified further inland from the existing
 Wairau Lagoon and adjacent to the Sandy beach dune deposits. Paleo-channels crosscut
 the surficial deposits suggesting that the deposits are overlain by alluvial silts.
 • Alluvially re-worked lagoon deposits are identified on the inside of meander-bends of
 the Lower Wairau River where the river intersects the recent lagoon deposits.
 Landforms including scrollbars suggest the deposits have been alluvially re-worked.
 • Active lagoon swamps are identified as topographic depressions within the recent
 lagoon deposits and locally contain standing water. Subsurface deposits likely contain
 muds to silts with accumulations of organics possible.

 12
3.2.3 Speargrass Formation
This formation is identified as a relatively flat surface on the Plains that is separated from the
Rapaura Formation by a degradational terrace. Extents of the surface were inferred from areas
of consistent elevations and from the lack of evidence of recent fluvial re-working, such as
paleo-channels.
3.2.4 Hillersden Gravel
These are present on the higher hillslopes in the south-east of the study area, as indicated in the
geologic map of the region (Begg and Johnson, 2000). Deposits consist of Neogene poorly
sorted and poorly bedded channelized greywacke conglomerate with lenses of sandstone and
sandy siltstone. Deposits are identified from the mapped distribution in the geologic map and
from the ‘rolling’ topography.
3.2.5 Colluvium deposits
These deposits are inferred from a step change in topography at the base of hillslopes and
within valleys along the northern margin of the Plains. These deposits likely comprise gravel,
sand, and silt washed off the surrounding hillslopes.
3.2.6 Marlborough Schist
Marlborough Schist is indicated in the geologic map of the region (Begg and Johnson, 2000)
as present on the hillslopes along the northern margin of the valley. The unit comprises
basement rock of dominantly pelitic schist derived from quartzofeldspathic sandstone and
mudstone.

 13
Figure 7: Geomorphic map of the Lower Wairau Plains.

 14
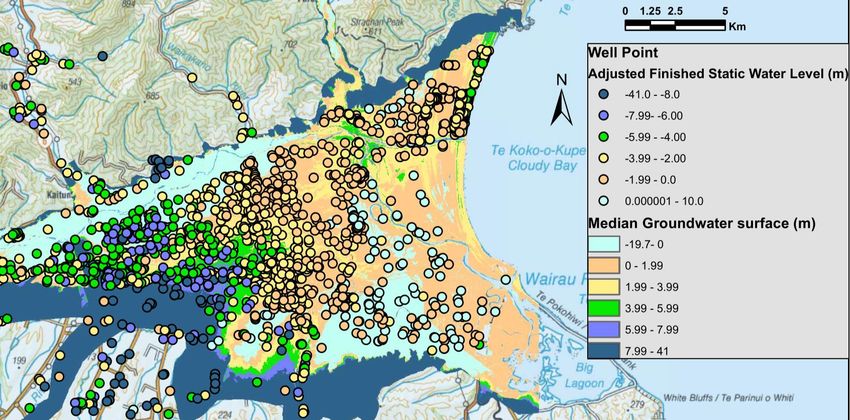
3.3 Groundwater

The study of Davidson & Wilson (2011) provides a thorough description of the groundwater
regime of the Lower Wairau Plains. Similarly, the groundwater model developed by Ogden
(2018) indicates that GWD was approximately 2 m below ground level for much of the coastal
parts of the plains and flows from west to east.
Figure 8 illustrates the median groundwater depths summarised from the available groundwater
information for the region. The depositional age of the geologic deposits are also summarised
in this figure. The depth increments are aligned with the depth limits used in the semi-
quantitative screening criteria in Table 1, where deposits of different depositional ages can be
assigned a liquefaction vulnerability category of Liquefaction damage is unlikely.

Figure 8: Median groundwater depths for the Lower Wairau Plains and depositional age of
deposits.

Recently, MDC has updated the depth to static water level field for each well in the MDC Wells
& Sediments database where an observation is available. Figure 9 shows that updated depth to
static ground water overlaid the current ground water model used in this study. The same
colours are used for the range of ground water depths for both model and static ground water
observations for comparison. This shows a good agreement between the model and the
observations of static ground water in the region, meaning that it can be used with confidence
in this study.

 15
Figure 9: Depth to static water table laid over the current water table model used.

 16
4 SEISMIC HAZARD
The plate boundary between the Pacific and Australian plates passes through the Marlborough
region, and consequently, this region is an area of high seismicity. The Marlborough region
consists of a series of northwest-tilted blocks forming mountain ranges, hills and drowned
valleys separated by major translucent faults such as Wairau, Awatere and Clarence Faults,
each of which can give rise to frequent seismic events. The Wairau Fault, which is a branch of
Alpine Fault, divides Marlborough into two regions with divergent geological structures. The
Wairau Plains are bounded by north-east trending mountain ranges (Richmond and Kaikoura
Ranges) reflecting uplift along the Wairau and Awatere Faults which are part of the
Marlborough Fault Zone (MFZ). This is a zone of north-east trending transpressional faulting
associated with the offshore transition of the plate boundary (Rattenbury et al. 2006). The
Wairau Fault is the closest active fault and is capable of rupturing in an earthquake event.
Figure 10 shows the location of faults in the Marlborough region.

Figure 10: Location of the faults in the Lower Wairau Plains and the Marlborough Fault
system (Adapted from Benson et al. 2001).

MBIE Guidance recommends the assessment of liquefaction-induced ground damage for
different return periods of ground shaking intensity to categorize liquefaction vulnerability.

 17
Peak ground acceleration (PGA) and earthquake moment magnitude (Mw) can be defined based
on the New Zealand Transport Agency Bridge Manual SP/M/022 (NZTA 2013). The PGA is
calculated using the following equation:

 = 0,1000
 1.3
where:
 0,1000 = 1000-year return period PGA coefficient
 = return period factor derived from NZS 1170.5 Structural design actions part 5
 Earthquake actions – New Zealand (NZS 2004)
 = Site subsoil class factor, equal to 1.0 for Site subsoil class A, B, D and E soil
 sites, and 1.33 for a site subsoil class C site.
 g = the acceleration due to gravity (9.81 m/s2)
A recent study by Cubrinovski et al. (2021) has identified revised PGA and Mw estimates
across New Zealand based on site-specific probabilistic seismic hazard analysis, with the
estimates from the Bridge Manual shown to underestimate the hazard in the Wairau Plains.
Based on this updated study, the design PGA for the Lower Wairau Plains is 0.26g for a 100-
year return period and 0.52g for a 500-year return period. The moment magnitude for each
return period was Mw 6.8 and Mw7.3, respectively.
When applied to the semi-quantitative criteria from Table 1, the PGA values from the 500-year
return period are scaled using MSF of 1.05. Table 2 summarises the revised PGA boundaries
for a Mw7.3 earthquake for the semi-quantitative criteria to inform liquefaction vulnerability
categories.

 18
Table 2: Semi-quantitative screening criteria for identifying land where liquefaction-
induced ground damage is unlikely for Mw7.3 (MBIE/MfE/EQC 2017).
 A Liquefaction Vulnerability category
 of Liquefaction damage is unlikely can be
 assigned if either of these conditions are met:
 Design peak ground
 acceleration (PGA) for the 500- Depth to
Type of soil deposit year intensity of earthquake groundwater
 shaking
Late Holocene age < 0.105 g >8m
Current river channels and their
historical floodplains, marshes and
estuaries, reclamation fills
Holocene age < 0.21 g >6m
Less than 11,000 years old
Latest Pleistocene age < 0.315 g >4m
Between 11,000 and 15,000 years old

 19
5 OBSERVATIONS FROM 2016 KAIKŌURA EARTHQUAKE
Liquefaction has manifested in the Lower Wairau Plains following a number of earthquakes
that generated significant ground shaking over the region, including the 1848 Marlborough and
1855 Wairarapa earthquakes, and most recently the 2013 Lake Grassmere and 2016 Kaikōura
earthquakes. These manifestations have either been the ejection of fine-grained sand and silt in
the form of sand boils, or if in close proximity to a free-face such as a river bank, the
development of lateral-spreading.
Strong to severe shaking was felt across the Marlborough region during the Kaikōura
earthquake. All Marlborough communities were subjected to earthquake damage. The main
impact was to buildings, farm assets, horizontal infrastructure, river control works, the
transportation networks and water supply networks. There are two strong motion stations
(SMS) in the Lower Wairau Plains that record earthquake shaking as part of the GeoNet
network. BWRS is a rock site on the edge of the Plains and MCGS is a deep soil site in
Blenheim. The geometric mean horizontal peak ground accelerations recorded at these SMS
were 0.15 g and 0.26 g, respectively. Across the Wairau Plains, peak ground accelerations
would be expected to be slightly greater than 0.26 g moving towards the south-east of
Blenheim, and would reduce moving to the west and north.
Post-earthquake reconnaissance surveys, aerial photography, and discussions with local
engineers and the Marlborough District Council provided a comprehensive summary of the
liquefaction related impacts and manifestations in the Wairau Plains following the 2016
Kaikōura earthquake. These are summarised in detail by Stringer et al. (2017) and in GEER
(2017). Within the Wairau Plains, liquefaction and lateral spreading was the major feature of
ground damage and was largely observed along the Lower Wairau and Opaoa Rivers. Figure
10 shows the location of manifestations of liquefaction in the region from this event. Severe
manifestations were recorded in the area of the Equestrian Park and the Blenheim Rowing Club
but as very few buildings are present in these areas, the engineering impacts were generally
low. Some moderate liquefaction manifestations were observed in a few locations within
Blenheim, but these again had limited impact. Localised liquefaction and associated lateral
spreading occurred proximal to the Opaoa River within Blenheim as shown in Figure 11.
Liquefaction and lateral spreading related damage was confined to the inner-banks of meander
bends of the rivers or associated paleo-channel, with damage was observed on the outer-banks
of the meander bends. Localised manifestations were also occurred adjacent to the Taylor River
within central Blenheim. Sand boils were observed at Lansdowne Park which is located

 20
adjacent to the southern bank of the Opaoa River on the northern edge of Blenheim (Stringer
et al. 2017, GEER 2017).
The observed distribution of liquefaction manifestations in this event further reinforces that
fluvial geomorphology and the depositional processes of the meandering rivers are important
factors for the interpretation of the distribution and sediment types in areas which are
susceptible to liquefaction.

Figure 11: Locations of liquefaction manifestation from the 2016 Kaikōura Earthquake.

 21
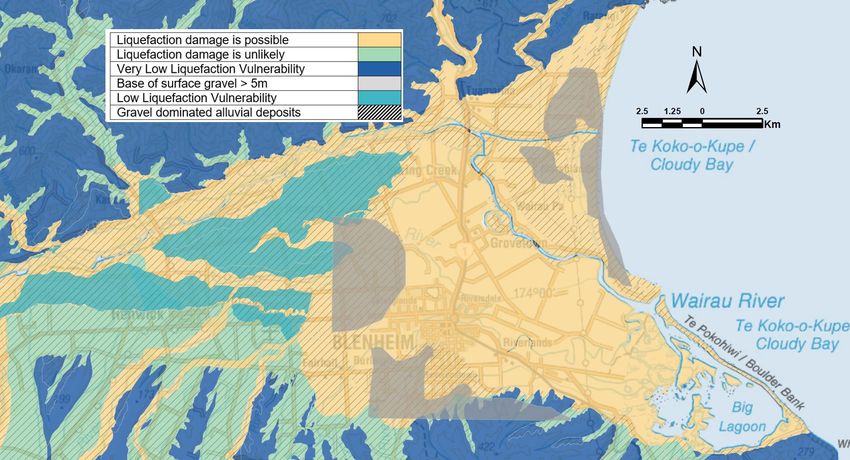
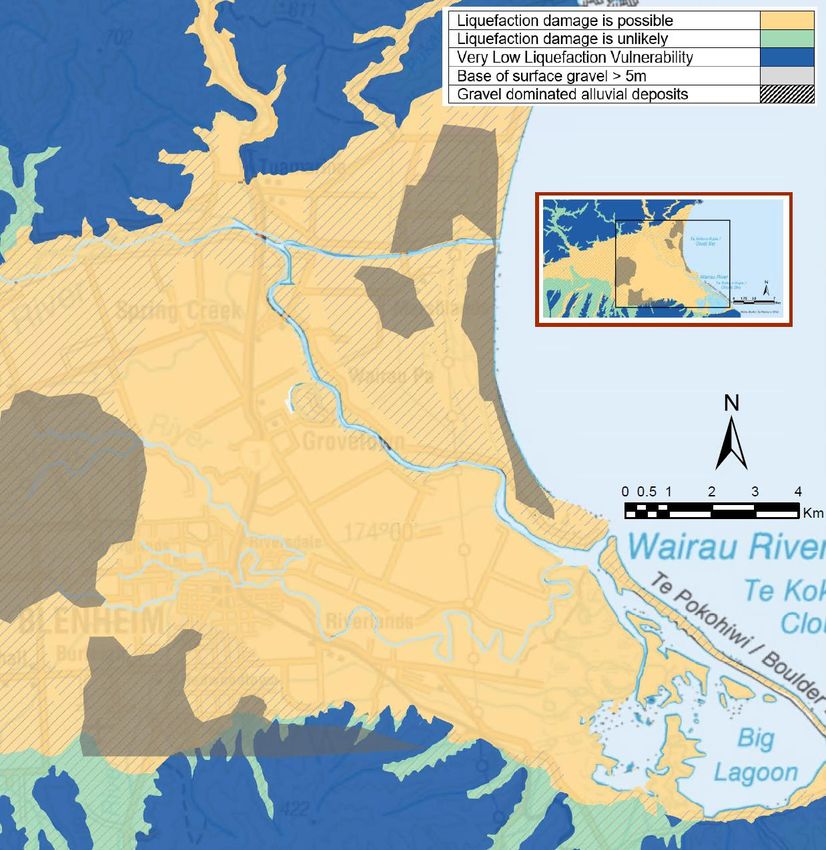
6 BASIC DESKTOP ASSESSMENT
In this section liquefaction vulnerability categories are defined using the Level A calibration
approach based on geological maps, groundwater and seismic hazard for the Lower Wairau
Plains following the MBIE Guidance.
A geological desktop assessment is undertaken based on published national and regional
surface geological maps and reports to characterise liquefaction. Q-Maps developed by GNS
Science are used to create geological layers for the Lower Wairau Plains. The output of this
initial assessment is a geology-based liquefaction vulnerability map illustrating areas in the
Lower Wairau Plains with deposits for which Liquefaction damage is possible and Liquefaction
damage is unlikely. Where rock outcrops are present, a Very Low liquefaction vulnerability
category is assigned. The primary aim of this initial screening is to identify geological units
that are fundamentally not susceptible to liquefaction.
By considering the regional seismic hazard and depth to groundwater, in conjunction with the
depositional process and the age of soil deposits, the semi-quantitative screening criteria in
Table 2 is used to identify geological units where significant liquefaction-induced ground
damage is unlikely to occur. A soil deposit of the specified type is assigned a liquefaction
vulnerability category of Liquefaction damage is unlikely if the 500-year peak ground
acceleration (PGA) is less than the limit for the age of that deposit, or if the depth to
groundwater is greater than the limit presented.
Geological age is one of the main factors in the semi-quantitative criteria to assess the
liquefaction vulnerability of the deposits, with Figure 12 summarising the geological age
associated with each deposit in the study area. Holocene and late Pleistocene deposits are
dominant in the Lower Wairau Plains, while the adjacent hills consist of basement rocks of
Neogene and Mesozoic ages.
Geological maps show that alluvial deposits of Holocene age become gravel dominated
towards the inland regions of the study area, as demonstrated in Figure 13. The liquefaction
vulnerability of the soil profile within these alluvial deposits will either be dominated by the
performance of gravels or the performance of sand and silt deposits. In general, the gravel
dominated deposits are likely to be better performing, and as a result these gravel dominated
areas are clearly identified in the maps presented throughout this report.

 22
Figure 12: Depositional age of deposits in the Lower Wairau Plains based on geologic maps.

Figure 13: Characteristics of the alluvial deposits in the Lower Wairau Plains based on
geologic maps.

The basement, Late Pliocene, and Early Pleistocene rocks present in this region are lithified
or relatively well consolidated and will not liquefy under strong ground shaking. Therefore,
exposed rock outcrops are assigned a category of Very Low. Because of their age, the early
and middle Pleistocene non-marine and marine deposits, the last interglacial marine deposits,
and the alluvial materials of the early and middle last glaciation are old enough to have been
consolidated by natural processes. Their liquefaction susceptibility is typically regarded as
negligible (Youd and Perkins 1978).
As defined in Section 4, the 500-year return period PGA value is greater than the cutoff value

 23
for Late Pleistocene deposits. As a result, the depth to groundwater is the governing criteria
for the liquefaction vulnerability categorisation of deposits of this age. Late Pleistocene
deposits with groundwater deeper than 4 m are assigned a category of Liquefaction damage is
unlikely using the semi-quantitative criteria presented in Table 2.
The remaining deposits in the study region are of Holocene age and include alluvial deposits
of fine-grained silts and sands that are present in the Lower Wairau Plains. The nature of the
deposits means that Liquefaction damage is possible is an appropriate categorisation.
Holocene gravel-dominated deposits are also assigned a Liquefaction damage is possible
categorisation. There is likely to be better ground performance in these areas compared to other
alluvial deposits. Most gravelly soils are relatively well-drained, but drainage can be impeded
if their voids are filled with finer particles or if they are surrounded by layers of less pervious
soils. As discussed in MBIE Guidance, large-scale geological maps might not identify small
pockets of potentially susceptible soils within larger geological units (e.g., infilled river
channels). This means that there is still potential for localised areas of more severe liquefaction-
induced ground damage to occur within these areas.
Figure 14 summarises the liquefaction vulnerability categories that are assigned to the Lower
Wairau Plains based on semi-quantitative geological screening (Level A). The alluvial deposits
dominated by gravel based on geologic maps have been highlighted by hatching.

 24
Figure 14: Level A Geology-based liquefaction vulnerability category map for the Lower Wairau Plains.

 25
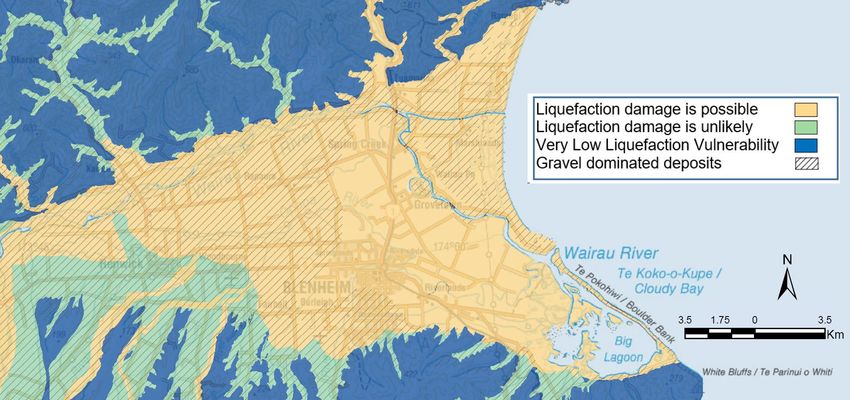
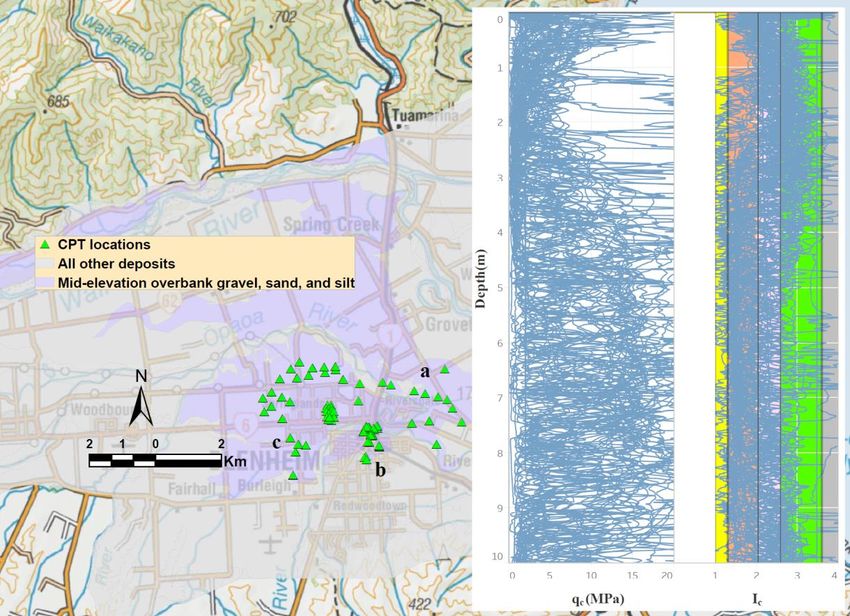
7 LEVEL B LIQUEFACTION VULNERABILTY ASSESSMENT
In this section, the liquefaction vulnerability categories from the Level A assessment are
combined with other datasets in an effort to further refine this categorisation. First, the surface
geomorphology of the Lower Wairau Plains presented in Section 3.2 are assessed. Second,
details of the subsurface stratigraphy are assessed using a lithology model of the Wairau Plains
developed for groundwater modelling. And finally, high-level ‘calibration’ of geological maps
with available geotechnical investigation data, including boreholes, CPTs and well logs for
each geomorphic zone is summarised. This approach straddles the Level A and Level B
assessment levels. Qualitative assessment provides a better understanding of liquefaction
susceptibility and triggering for the mapped deposits and underlying ground profile. It will
reduce the uncertainty in areas where existing information is sparse by using the targeted
collection of new information.
As significant uncertainty lies regarding the level of related risk, how it varies across each
mapped area and the delineation of boundaries between areas, updates on the geology-based
liquefaction map is only suggested in areas with a good density of geotechnical investigations
as these provide a better understanding of liquefaction susceptibility for the mapped deposits.
For example, deposits that were categorised as Liquefaction damage is unlikely in the Level A
assessment is assigned a liquefaction vulnerability category of Low where a thick layer of
gravel is present from surface as indicated by geotechnical investigations.. Suggestions are
made for each geomorphic zone where a good density of geotechnical investigations are present
regarding the liquefaction potential. This section highlights some areas where more robust
geotechnical screening with more data needs to be undertaken Although the lithologic model
only covers the central and coastal regions of the Plains, it provides an additional check in this
level of assessment for thick gravel layers from the surface and confidence in the regions where
a more precise liquefaction vulnerability can be suggested.

7.1 Geomorphology-based screening
In addition to surface geologic information, detailed geomorphic characteristics can be used to
refine the evaluation of the liquefaction potential of soil deposits. Previous studies have shown
that river migration promotes the formation and preservation of fluvial deposits prone to
liquefaction, and geomorphic interpretation is a useful tool to assess liquefaction vulnerability
for a region. During the Canterbury earthquake sequence, liquefaction and liquefaction-
induced ground deformation were primarily concentrated near modern waterways and areas
underlain by Holocene fluvial deposits with shallow water tables (< 1 to 2 m) (Wotherspoon et

 26
al. 2012, Grace 2015, Bastin et al. 2017). Similarly, a comparison of observed liquefaction
manifestation in Whakatane following the Edgecumbe earthquake with local geomorphology
highlighted the importance of geomorphic setting and fluvial formations in the assessment of
liquefaction (Mellsop 2017, Bastin et al. 2019). Liquefaction manifestation in historical events
have shown that young, unconsolidated point-bar and paleo-channel deposits are highly
susceptible to liquefaction, and thus are likely to liquefy during future events.
The geomorphology of the Lower Wairau Plains discussed in Section 3.2 is assessed in this
section in conjunction with the potential for liquefaction manifestation using literature related
to the performance of typical geomorphological formations in recent earthquakes.

7.1.1 Lower elevation overbank gravel, Sand and silt flood plains
Low elevation overbank gravel, sand and silt deposits cover a large portion of the Lower
Wairau Plains. These deposits mainly consist of fine-grained sand grading to silt. High
groundwater location, low elevation and material characteristics mean these deposits are
typically highly susceptible to liquefaction. Surface manifestations were observed in these
areas following the 2016 Kaikōura earthquake.

7.1.2 Active floodplain alluivial gravel, sand and silt
The active floodplain of the Wairau River avulsed across the Wairau Plains prior to European
settlement, as reflected by the many active and paleo-river channels that transect the surface of
the plains. These gravels dominated Holocene deposits typically have less susceptibility to
liquefaction than finer grained sand and silts.

7.1.3 Mid-elevation overbank gravel, sand and silt
There is high variability in content for these deposits in the Lower Wairau plains. Deposits
which are distal to the river and are typically dominated by silts. The limited deposition on the
outer bank and predominance of silts in these deposits typically result in lower liquefaction
susceptibilities of the underlying sediments. No manifestation of liquefaction was observed in
the 2016 Kaikōura earthquake in these areas. Ground water depth increases from east to west
and also the Gravel content increases from low to mid-elevation floodplain deposits making
these deposits typically highly dependent on other data in addition to formation to suggest
liquefaction susceptibility. Therefore “less susceptibility is considered for these deposits in the
Lower Wairau Plains.

 27
7.1.4 Higher elevation overbank gravel, sand and silt
Subsurface deposits for these formations are predominately gravel and ground water depth is
deep from mid to higher elevation deposits making these deposits low susceptible to
liquefaction.

7.1.5 Alluvial fan gravel, sand and silt
Alluvial fan deposits are present in the southern part of the Wairau Plains. These are well-
sorted floodplain gravel deposits. These are a build-up of Wairau River sediments and
possesses a sloping high elevation profile with good drainage. As a result, these deposits
typically have less susceptibility to liquefaction.

7.1.6 Proximal alluvial gravel, sand and silt
These deposits comprise of fine-grained sand grading to silt. They are found in the meandering
Opawa and Wairau River in adjacent deposits. These deposits are geologically young,
unconsolidated and saturated, and thus are typically highly susceptible to liquefaction.

7.1.7 Paleo-channels
A paleo-channel is a remnant of an inactive river or stream channel that has been filled or
buried by younger sediment. These depoits are shown in two formation types i.e., Paleo-
channels with alluvial gravel, sand and silts and Paleo-channels with alluvial sand and silt. The
sediments that the old channel is cut into or buried are mostly unconsolidated. Paleo-channels
deposits are present across the lower portion of the plains and reflect channel avulsion and
bank-overtopping flood events before the settlement of the area. These deposits are
geologically young, unconsolidated and saturated, making them typically highly susceptible to
liquefaction.

7.1.8 Swamps
Swamps generally form distal to the river in areas where standing water remains following
flood events (Fryirs and Brierley, 2012). These are shown as inter-dune swamp and active
lagoon swamp in Figure 7 and are comprised of mainly silts with layers of peat and mud. These
consist of flat to undulating terraces and floodplains of both Wairau and Opawa Rivers
underlain by Holocene sand and silt deposits which makes them typically highly susceptible to
liquefaction. During the 2010-11 Canterbury earthquake sequence areas of swamp deposits in
Christchurch had significant liquefaction manifestation impacts, whereas CPT based
assessments suggested they were less susceptible.

 28
7.1.9 Recent alluvial deposits
These deposits are shown as two types in Figure 7 i.e., recent alluvial gravel, sand and silt
deposits and recent alluvial sand and silt deposits. These are late Holocene deposits that are
unconsolidated and saturated and typically have a high liquefaction potential.

7.1.10 Lagoon deposits

These deposits are shown as six types in Figure 7:
 • Active lagoon mud and silt,
 • Mid-elevation paleo-lagoon depoits
 • Higher elevation paleo-lagoon deposits
 • Alluvially re-worked lagoon mud, silt and sand
 • Paleo-lagoon mud and sily and
 • Recent lagoon mud and silt
Lagoons are formed at the tidal mouth of a large river, where the river transitions into a marine
environment. The deposits from the mainland to the estuary in the northeast towards shoreline
and lagoon are silty and gravelly in nature and have high liquefaction potential. Paleo-lagoon
have similar soil characteristics and comprise of saturated fine-grained alluvial soils with some
gravel content, meaning they are typically highly susceptible to liquefaction. Highly visible
and immediate effects of liquefaction were observed in the Avon Heathcote Estuary, which is
an intertidal estuary east of Christchurch city forming lagoon deposits, during the 2011
Canterbury earthquake sequence.

7.1.11 Beach ridges
These depoits are shown in three types in Figure 7:
 • Active beach ridge,
 • Gravel beach ridges and
 • Sandy beach ridges
Holocene paleo beach ridge deposits are present in the Lower Wairau Plains and form a series
of undulating gravel ridges near the coast. These consist of shallow, well-drained soils that
formed from semi-consolidated interbedded sandy and loamy sedimentary beds. Gravel beach
ridges are present towards the shoreline are dominated by gravel deposits. Generally, these
deposits typically have low liquefaction potential as they are a gravel dominated material, and
due to their depositional characteristics, as they are compacted by wave action. Other beach
ridge formations formations are composed of sand as well as sediment worked from underlying
beach material. The beach ridges display a progressive change in orientation, with the younger
ridges parallel to the coast and the older ridges parallel to the Wairau River. Sediment derived

 29
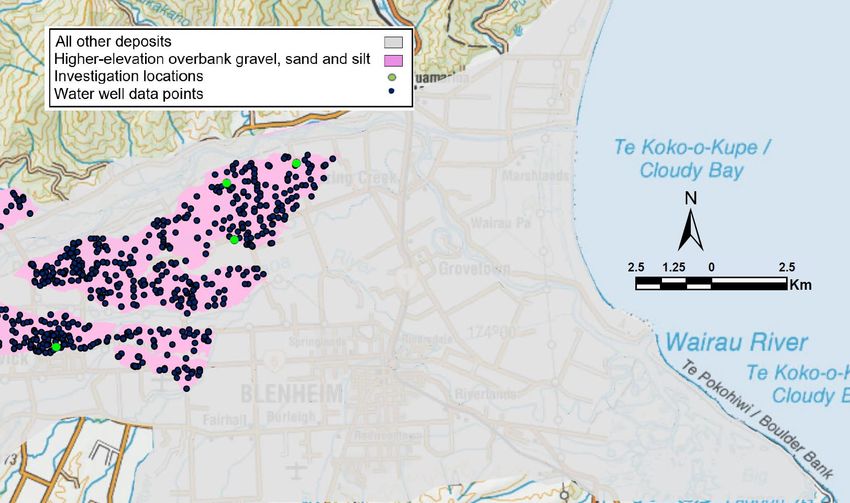
from the south (Awatere River and White Bluffs) is responsible for the development of the
gravel ridges since the Wairau River does not transport gravel to the coast. Due to these
depositional characteristics, these formations are typically less susceptible to liquefaction.

7.1.12 Other deposits:
Other deposits which are less susceptible to liquefaction are:

 • Hillersden Gravel are higher elevation Neogene aged poorly graded gravelly deposits.
 • Marlborough Schist derived from basement rocks of dominantly schist.
 • Colluvium deposits that are gravel dominated.
 • Speargrass Formation are well-sorted floodplain gravel deposits.

7.1.13 Summary of geomorphological screening
Based on the available geomorphological data, new sub-categories of less susceptible and more
susceptible are assigned, sitting within the Liquefaction damage is possible category. This
additional sub-categorisation can be used to guide the locations of future geotechnical site
investigation to potentially refine classifications based on an increased density of site
investigation data in these units. Table 3 summarises details of the sub-categorisation and
Figure 15 summarises these sub-categories for the Lower Wairau Plains. Rapaura Formation
deposits consists of alluvial gravel, sand and silt. These deposits are categorised based on
elevation and nature of dominating deposits. Overbank alluvial deposits which are Mid- and
High-elevation likely to have predominately gravel and deep water tables which makes them
less susceptible. Lower elevation overbank alluvial deposits are dominated by sand and silt and
are assigned More susceptible. Active flood plains and alluvial fans are assigned Less
susceptible while recent, paleo and proximal alluvial deposits are assigned More susceptible
within this formation. All deposits with beach ridges are assigned Less susceptible as they are
well sorted alluvial material and highly compacted along the shore. Lagoon deposits are
assigned More susceptible as these are generally overlain by alluvial sands and silts. Although
some deposits have organic material and mud these can still be prone to liquefaction and has
been seen in past earthquakes. Speargrass Formation deposits which are gravel dominated and
originate from adjacent rock deposits in the region are assigned Less susceptible.

 30
Table 3: Summary of liquefaction vulnerability sub-categories for the Lower Wairau Plains
based on geology and geomorphology.

 Geomorphological Surface Geology Formation Liquefaction Sub-category
 Unit type Vulnerability based on
 category Geomorphology
 Active flood plain Holocene River Rapaura Less susceptible
 alluvial gravel,sand deposits dominated by Formation
 and silt gravel
 Alluvial fan gravel, Holocene River Rapaura Less susceptible
 sand, and silt deposits dominated by Formation
 gravel
 Inter-dune swamps Holocene silty deposits Dillons More
 with sand, gravel and Point susceptible

 Liquefaction damage is possible
 peat formation
 Drained alluvial Fine sand grading to Dillons More
 swamps silts Point susceptible
 formation
 Active lagoon Holocene aged estuary Dillons More
 swamp deposits mainly consist Point susceptible
 of silts with peat and formation
 sand
 Active lagoon mud Holocene silty deposits Dillons More
 and silt with sand, mud and Point susceptible
 peat formation
 Paleo-channels Holocene alluvial Rapaura More
 with alluvial deposits with sand, Formation susceptible
 gravel, sand and gravel, and silt
 silt
 Paleo-channels Holocene alluvial Rapaura More
 with alluvial sand deposits with sand and Formation susceptible
 and silt silt

 31
You can also read