Machine Learning Approach for Personality Recognition in Spanish Texts

Page created by Christina Vargas
 
CONTINUE READING
Machine Learning Approach for Personality Recognition in Spanish Texts
applied
              sciences
Article
Machine Learning Approach for Personality Recognition in
Spanish Texts
Yasmín Hernández * , Alicia Martínez *, Hugo Estrada, Javier Ortiz and Carlos Acevedo

                                          Computer Science Department, Tecnológico Nacional de México/Cenidet, Cuernavaca 62490, Mexico;
                                          hugo.ee@cenidet.tecnm.mx (H.E.); javier.oh@cenidet.tecnm.mx (J.O.); carlos.acevedo@cenidet.edu.mx (C.A.)
                                          * Correspondence: yasmin.hp@cenidet.tecnm.mx (Y.H.); alicia.mr@cenidet.tecnm.mx (A.M.)

                                          Abstract: Personality is a unique trait that distinguishes an individual. It includes an ensemble of
                                          peculiarities on how people think, feel, and behave that affects the interactions and relationships of
                                          people. Personality is useful in diverse areas such as marketing, training, education, and human
                                          resource management. There are various approaches for personality recognition and different
                                          psychological models. Preceding work indicates that linguistic analysis is a promising way to
                                          recognize personality. In this work, a proposal for personality recognition relying on the dominance,
                                          influence, steadiness, and compliance (DISC) model and statistical methods for language analysis
                                          is presented. To build the model, a survey was conducted with 120 participants. The survey
                                          consisted in the completion of a personality test and handwritten paragraphs. The study resulted in a
                                          dataset that was used to train several machine learning algorithms. It was found that the AdaBoost
                                          classifier achieved the best results followed by Random Forest. In both cases a feature selection pre-
                                          process with Pearson’s Correlation was conducted. AdaBoost classifier obtained the average scores:
                                          accuracy = 0.782, precision = 0.795, recall = 0.782, F-measure = 0.786, receiver operating characteristic
         
                                          (ROC) area = 0.939.
         
Citation: Hernández, Y.; Martínez,        Keywords: DISC model; personality recognition; predictive model; text analysis
A.; Estrada, H.; Ortiz, J.; Acevedo, C.
Machine Learning Approach for
Personality Recognition in Spanish
Texts. Appl. Sci. 2022, 12, 2985.         1. Introduction
https://doi.org/10.3390/app12062985
                                               Personality has been recognized as a driver of decisions and behavior; it consists
Academic Editors: Arturo                  of singular characteristics on how individuals think, feel, and behave [1]. Understand-
Montejo-Ráez and Salud María              ing personality provides a way to comprehend how the different traits of an individual
Jiménez-Zafra                             merge as a unit, since personality is a mixture of traits and behavior that people have to
Received: 31 January 2022
                                          cope with situations. Personality influences selections and decisions (e.g., movies, music,
Accepted: 8 March 2022
                                          and books) [2]. Personality guides the interactions among people, relationships, and the
Published: 15 March 2022
                                          conditions around them. Personality has been shown to be related to any form of interac-
                                          tion. In addition, it has been shown to be useful in predicting job satisfaction, success in
Publisher’s Note: MDPI stays neutral
                                          professional relationships, and even preference for different user interfaces [3].
with regard to jurisdictional claims in
                                               Previous research on user interfaces and personality has found more receptiveness and
published maps and institutional affil-
                                          confidence in users when the interfaces take personality into account. When personality
iations.
                                          is predicted from the social media profile of users, applications can use it to personalize
                                          presentations and messages [3].
                                               Researchers have recognized that every person has a personality that usually remains
Copyright: © 2022 by the authors.
                                          consistent over time. Consequently, personality assessment can be used as an important
Licensee MDPI, Basel, Switzerland.        measure. Various psychological models of personality have been proposed, such as the
This article is an open access article    Five-factor model [4], the psychoticism, extraversion, and neuroticism (PEN) model [5], the
distributed under the terms and           Myers–Briggs type inventory [4], and the dominance, influence, steadiness, and compliance
conditions of the Creative Commons        (DISC) model [6].
Attribution (CC BY) license (https://          Typically, these models propose direct methods such as questionnaires to recognize
creativecommons.org/licenses/by/          personality. Conversely, linguistic analysis can be used to detect personality [3,7]. Lin-
4.0/).                                    guistic analysis can produce useful patterns for establishing relationships between writing

Appl. Sci. 2022, 12, 2985. https://doi.org/10.3390/app12062985                                               https://www.mdpi.com/journal/applsci
Machine Learning Approach for Personality Recognition in Spanish Texts
Appl. Sci. 2022, 12, x FOR PEER REVIEW                                                                                                             2 of 17

 Appl. Sci. 2022, 12, 2985              Typically, these models propose direct methods such as questionnaires to recognize                             2 of 17
                                  personality. Conversely, linguistic analysis can be used to detect personality [3,7]. Lin-
                                  guistic analysis can produce useful patterns for establishing relationships between writing
                                  characteristics
                                   characteristics and       personality. Researchers
                                                       and personality.        Researchersininnatural natural    language
                                                                                                              language         processing
                                                                                                                            processing     havehave    pro-
                                                                                                                                                 proposed
                                  posed   several   methods        of linguistic    analysis    to  recognize     personality,
                                   several methods of linguistic analysis to recognize personality, and machine learning has       and   machine     learn-
                                  ing
                                   beenhasone
                                           been    onemost
                                               of the    of theinvestigated
                                                                   most investigated        approaches.
                                                                                  approaches.
                                        Machine
                                         Machine learning techniques are usefulininthe
                                                    learning      techniques      are   useful        therecognition
                                                                                                            recognitionofofpersonality
                                                                                                                                personalitysincesincethey
                                                                                                                                                        they
                                  provide
                                   providemechanisms
                                              mechanismstotoautomatize
                                                                     automatizeprocesses
                                                                                     processesthat thatare
                                                                                                         arebased
                                                                                                               basedon  onaaset
                                                                                                                              setofofexamples.
                                                                                                                                      examples.Several
                                                                                                                                                    Several
                                  proposals
                                   proposalsfor  forpersonality
                                                       personalityrecognition
                                                                        recognition    based
                                                                                          based onon machine
                                                                                                         machine learning
                                                                                                                     learning cancan
                                                                                                                                   be found
                                                                                                                                        be foundin thein lit-
                                                                                                                                                          the
                                  erature   [8,9]. Machine        learning    algorithms       use   computational        methods
                                   literature [8,9]. Machine learning algorithms use computational methods to learn directly           to  learn  directly
                                  from
                                   fromdata
                                          datawithout
                                                  without  relying
                                                               relying on on
                                                                          a predetermined
                                                                               a predetermined     equation     as a model.
                                                                                                         equation               The algorithms
                                                                                                                       as a model.                   adap-
                                                                                                                                         The algorithms
                                  tively  improve      their   performance        as   the  number       of  instances
                                   adaptively improve their performance as the number of instances available for learning available     for  learning    in-
                                  creases  [10].
                                   increases   [10].
                                        Several
                                         Severalefforts
                                                    effortsininpersonality
                                                                   personalityprediction
                                                                                   predictionfrom  fromthe thelinguistic
                                                                                                                linguisticanalysis
                                                                                                                              analysisapproach
                                                                                                                                          approachhave have
                                  been
                                   beencarried
                                          carriedout.out.However,
                                                            However,they   theyhave
                                                                                  havefocused
                                                                                          focusedmostlymostlyon  onthetheEnglish
                                                                                                                           Englishlanguage
                                                                                                                                      languageand   andareare
                                  based
                                   basedon onthe
                                               thefive-factor
                                                    five-factormodel.model.ThisThismodel
                                                                                      model(also(alsocalled
                                                                                                       calledbigbigfive
                                                                                                                     fivemodel)
                                                                                                                           model)has  hasbeen
                                                                                                                                           beenused
                                                                                                                                                 usedasasaa
                                  standard
                                   standardfor forapplications
                                                    applicationsthat   thatneed
                                                                             needpersonality
                                                                                     personalitymodeling
                                                                                                     modeling[7].  [7].
                                        To
                                         Tocontribute
                                             contribute to the   the advancement
                                                                      advancementand      andunderstanding
                                                                                                 understandingofof      thethe  relationship
                                                                                                                             relationship        between
                                                                                                                                              between    per-
                                   sonality and
                                  personality    andlanguage,
                                                        language,   wewehave
                                                                           have developed
                                                                                   developed    a predictive
                                                                                                   a predictive  model
                                                                                                                    model forfor
                                                                                                                               personality
                                                                                                                                  personality  recognition
                                                                                                                                                 recogni-
                                   based
                                  tion     on the
                                        based   on DISC
                                                     the DISC personality      model
                                                                     personality         and aand
                                                                                      model       machine      learning
                                                                                                       a machine            approach.
                                                                                                                       learning            We performed
                                                                                                                                   approach.     We per-
                                   a personality
                                  formed              surveysurvey
                                            a personality         with 120with participants.
                                                                                  120 participants.The participants
                                                                                                           The participantswere were
                                                                                                                                  askedaskedto complete
                                                                                                                                                  to com-a
                                   demographic
                                  plete  a demographicform, fill    in the
                                                                form,   fill DISC
                                                                             in thetest,
                                                                                      DISC and    handwrite
                                                                                               test,             a text ona atext
                                                                                                      and handwrite             general
                                                                                                                                    on a topic    that
                                                                                                                                            general     they
                                                                                                                                                      topic
                                   selected.
                                  that they selected.
                                         Themodel
                                        The    modelfor   forpersonality
                                                                personality      prediction
                                                                              prediction         is based
                                                                                             is based    on aonsupervised
                                                                                                                   a supervised       machine
                                                                                                                                machine            learning
                                                                                                                                             learning   ap-
                                   approach
                                  proach   for for  multiclass
                                                multiclass          classification.
                                                                classification.    WeWe     evaluated
                                                                                         evaluated      sixsix
                                                                                                             ofof the
                                                                                                                the     mostknown
                                                                                                                     most      knownclassifiers:
                                                                                                                                         classifiers:naive
                                                                                                                                                       naive
                                   Bayes[11],
                                  Bayes    [11],sequential
                                                  sequentialminimal
                                                                  minimaloptimization
                                                                               optimization(SMO)  (SMO)[12],[12],k-Nearest
                                                                                                                  k-Nearestneighbors
                                                                                                                                 neighbors(kNN)(kNN)[13],
                                                                                                                                                        [13],
                                   AdaBoost[14],
                                  AdaBoost      [14],J48J48[15],
                                                             [15],and
                                                                    andrandom
                                                                          randomforestforest[16].
                                                                                               [16].WeWeconducted
                                                                                                           conductedpreprocess
                                                                                                                          preprocesstasks tasksasasfeature
                                                                                                                                                     feature
                                   extraction,feature
                                  extraction,    feature selection
                                                            selection andand data
                                                                               data augmentation
                                                                                      augmentationtotohave     haveninenineversions
                                                                                                                              versions of of
                                                                                                                                          thethe
                                                                                                                                               dataset.
                                                                                                                                                  dataset.We
                                   found   AdaBoost       [14]   and   random      forest  [16]   had   the   best  performance.
                                  We found AdaBoost [14] and random forest [16] had the best performance. Figure 1 pre-                Figure   1  presents
                                   the overview
                                  sents  the overviewof our ofapproach.
                                                                our approach.

                                         Data gathering          Personality survey          Demographic test               Handwritting

                                         Data preprocessing      Feature extraction           Feature Selection          Data Augmentation

                                                                                                                            Evaluation of
                                                                  Hyperparameter                Classification
                                         Model construction                                                                 classification
                                                                   optimization                models training
                                                                                                                               models

                                  Figure
                                   Figure1.1.Overview
                                              Overviewofofthe
                                                           theconstruction
                                                               constructionofofthe
                                                                                themodel
                                                                                    modelfor
                                                                                          forpersonality
                                                                                              personalityprediction.
                                                                                                          prediction.

                                         Thispaper
                                        This  paperpresents
                                                     presentsthe
                                                               theconstruction
                                                                   constructionofofthe
                                                                                     thepredictive
                                                                                         predictivemodel
                                                                                                      modelforforpersonality
                                                                                                                  personalityrecogni-
                                                                                                                               recogni-
                                   tion. Section 1 presents  related  work  and  background.     Section  2 describes  the protocol
                                  tion. Section 1 presents related work and background. Section 2 describes the protocol for        for
                                   the personality  survey.  Section  3 presents  the machine    learning   approach   for
                                  the personality survey. Section 3 presents the machine learning approach for building thebuilding the
                                   predictive model.
                                  predictive   model. Section
                                                       Section 44 presents
                                                                  presentsthe
                                                                            theresults
                                                                                 resultsofof
                                                                                           this research.
                                                                                             this          Finally,
                                                                                                   research.        Section
                                                                                                              Finally,      5 discusses
                                                                                                                        Section 5 dis-
                                   the results
                                  cusses       and outlines
                                          the results        futurefuture
                                                      and outlines   work. work.
Machine Learning Approach for Personality Recognition in Spanish Texts
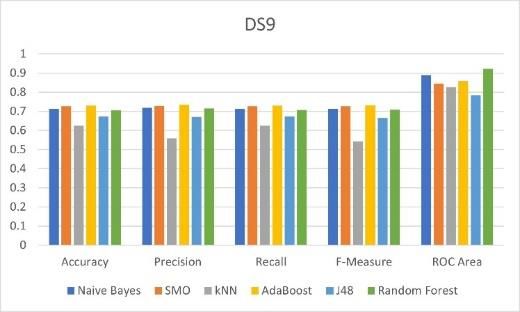
Appl. Sci. 2022, 12, 2985                                                                                          3 of 17

                            1.1. Related Work
                                 Srinarong and Mongkolnavin [17] developed a model based on machine learning
                            techniques to recognize the personality of the customers of a call center. The model allows
                            the call center to give them an appropriate response. This study is based on the MPI
                            (Maudsley personality inventory) personality model. Audio files of conversational voice
                            were collected from 92 voluntary participants who were instructed to make conversation in
                            the simulated context. Logistic regression, LinearSVC, random forest, and artificial neural
                            networks were used in the modeling process.
                                 Automatic personality recognition based on Twitter in Bahasa Indonesia was proposed
                            by Adi et al. [18]. Tweets were manually annotated by experts in psychology using the big
                            five model. In this study, stacking, gradient boosting, and stochastic gradient descent were
                            evaluated.
                                 A multi-label personality detection model based on neural networks, which combines
                            emotional and semantic features was proposed by Ren et al. [19]. This model relies on
                            bidirectional encoder representation from transformers (BERT) to generate sentence-level
                            embedding for text semantic extraction. A sentiment dictionary is used for text sentiment
                            analysis to consider sentiment information. The performance of the model was evaluated
                            on two public personality datasets for MBTI and big five.
                                 A model for personality prediction from text posts of social network users was devel-
                            oped based on a hierarchical deep neural network by Xue et al. [20]. The model predicts
                            the big five personality by means of traditional regression algorithms and the combination
                            of statistical linguistic features with deep semantic features from the text postings. This
                            approach has achieved the lowest average prediction error of all of the approaches.
                                 A model aiming to assist in recruiting and selecting appropriate personnel by knowing
                            the personality of customers has also been developed by Sher et al. [21]. The XGBoost
                            classifier is used to predict the personality from input text based on the MBTI model. A
                            publicly available benchmark dataset from Kaggle was used in the experiments.

                            1.2. The DISC Model of Personality
                                  DISC stands for Dominance, Influence, Steadiness, and Compliance. They are the four
                            dimensions of personality proposed by the model that represent the basic behavioral styles.
                            The Dominance and Influence dimensions denote receptiveness and assertiveness. The
                            Steadiness and Compliance dimensions denote control and openness. Personality falls
                            within these four dimensions [6,22].
                                  When a DISC profile shows a high Dominance factor, it is describing someone with
                            an independent attitude and a motivation to succeed on their own terms. Dominant
                            people have the willpower to work under pressure, and they are always ready to take on
                            responsibility [6,22].
                                  When Influence stands out as a major factor, it describes someone with a positive
                            attitude to other people, and the confidence to demonstrate that attitude. People of this
                            kind are comfortable in social situations and interact with others in an open and expressive
                            way [6,22].
                                  Steadiness is related to the natural pace of people and their reactions to change. This
                            factor describes a reticent and careful person. Steady people usually respond to events
                            rather than taking pro-active steps themselves. Steady people are consistent and reliable in
                            their approach. Indeed, they prefer to operate in situations following established patterns
                            and avoid unplanned developments. Therefore, people with high Steadiness tend to be
                            quite resistant to change and will need time to adapt to new situations [6,22].
                                  The Compliance dimension is related to organization, accuracy, and attitudes towards
                            authority. An individual showing high Compliance is concerned with detail and practicality.
                            The key characteristic of this dimension falls in attitudes towards authority. Compliant
                            people are rule oriented. They are also interested in accuracy, structure, and understanding
                            the ways things work [6,22].
Machine Learning Approach for Personality Recognition in Spanish Texts
Appl. Sci. 2022, 12, 2985                                                                                              4 of 17

                                 The DISC personality test consists of 28 groups of four adjectives. To assess personality,
                            individuals must choose the adjective that identifies them the most and the adjective that
                            identifies them the least. Some examples of the adjective groups of the DISC test are shown
                            in Table 1.

                            Table 1. Examples of the adjective groups in the dominance, influence, steadiness, and compliance
                            (DISC) personality test.

                                    Group 1                 Group 2                 Group 3                 Group 4
                                  Extroverted               Sociable               Analytical               Daring
                                   Cautious                Impulsive                 Bold                Conscientious
                                   Persistent             Determined                 Loyal                 Talkative
                                   Impatient                 Calm                   Helpful                Moderate

                                 The DISC model has been used widely in several fields such as education, health,
                            industry, and management. For instance, Milne et al. [23] conducted a study to identify
                            the behavior styles of physiotherapy students and to determine if there is a relationship
                            between students’ unique behavior patterns and their clinical placement grades. On the
                            other hand, DISC personality has been considered to be a predictor for the improvement
                            of manageability; Chigova et al. [24] conducted a study to identify impact factors that
                            improve the efficiency of structured interaction in enterprises and organizations.

                            2. Personality Survey to Gather Data
                                  To obtain the ground-truth data, a personality survey was conducted. The objective of
                            the survey was to gather data to relate writing characteristics and behavior with personality.
                            These relationships are useful for constructing a text classification model. The proposed
                            model for personality prediction is intended to be applied in the selection process of
                            candidates for postgraduate programs. Therefore, the study focused on knowing the
                            personality of undergraduate and graduate students. One hundred and twenty students
                            participated in the survey (49 women and 71 men). The participants ranged in age between
                            20 and 30 years old.
                                  The survey consisted of three parts: (i) a general information questionnaire; (ii) the
                            DISC personality test; and (iii) handwritten paragraphs. Each participant was contacted
                            individually and was told about the objectives and the procedure of the survey. If they
                            agreed to participate, the three parts of the survey were explained in detail. Additional
                            help was provided if the participants required it, but most of the participants did not need
                            help or explanations during the survey. The participants took between 20 and 30 min to
                            complete the survey. The entire survey was in Spanish.
                                  The first part asked the participants for personal data: age range, gender, schooling,
                            occupation, marital status, preferred social networks, and number of online friends. In
                            the second part, the participants filled in the personality test [5,6]. To complete the DISC
                            personality test, the participants had to do self-inspection and to conclude to what extent
                            the adjectives in the test represented them, as explained in Section 1.2. In the third part of
                            the survey, the participants handwrote some paragraphs on any topic. Suggested topics
                            were provided. These included goals, hobbies, what they did the day before, and so on.
                                  The study showed that Facebook and Twitter are the preferred social networks of the
                            participants, with 105 participants and 15 participants, respectively. The average number
                            of friends of the participants on the social networks was 531 people. Table 2 shows the
                            answers and the results of the personality test for four participants in the survey.
Machine Learning Approach for Personality Recognition in Spanish Texts
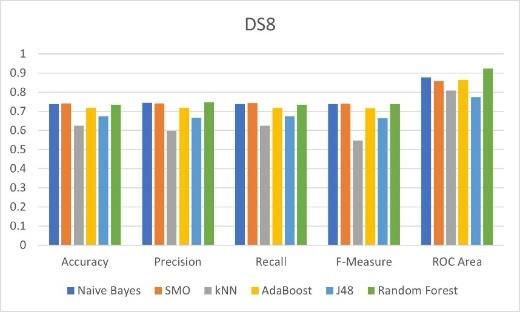
Appl. Sci. 2022, 12, 2985                                                                                                   5 of 17

                              Table 2. Examples of answers of the participants in the survey.

                                                  Civil                                              Friends in
                  Gender    Schooling                             Occupation   Preferred SN                         Personality
                                                  Status                                           Preferred SN 1
      1             Male      College            College           Student       Twitter               120          Dominance
      2            Female     College            College           Student      Facebook               1150          Influence
      3             Male    High School          College           Student      Facebook                100         Steadiness
      4            Female     College            Married           Student      Facebook                80          Compliance
                              1   SN stands for social network.

                                   The results of the personality survey are shown in Table 3. The most frequent per-
                              sonality dimension was Steadiness (62 people), the second most common dimension was
                              Influence (26 people), the next factor was Compliance (18 people), and the least common
                              factor was Dominance (14 people).

                              Table 3. Results of the personality survey.

                                       Personality                  Women                     Men                   Total
                                       Dominance                        8                     6                      14
                                        Influence                      10                     16                     26
                                       Steadiness                      24                     38                     62
                                       Compliance                       7                     11                     18
                                                                       49                     71                    120

                                    It is noteworthy that the DISC personality model was selected since it is a clean model
                              that only requires a short time for training and assessing answers. The results can be
                              obtained relatively easily, and the model can provide adequate information regardless of
                              whether the people conducting the survey are knowledgeable in psychology [22].
                                    Besides personality and demographic data, a set of 120 handwritten texts by partic-
                              ipants was obtained. It was observed that most of the participants chose to write about
                              one of the suggested topics. Just a few decided to write on another topic. It was also
                              observed that the participants used words related to their studies and their desire to be
                              successful and achieve their goals. This could be due to the age and level of studies of
                              the participants. Table 4 presents a sample of a paragraph in Spanish text gathered in the
                              study. The translation of the text in English for purposes of clarity. The complete study and
                              analysis were in the Spanish language. Figure 2 shows the original handwritten text.
                                    To conduct the analysis, the handwriting was transcribed to electronic texts. On
                              average, the texts had 90 words and a lexical diversity of 0.19. To measure lexical diversity,
                              the type–token ratio (TTR) measure was used. This measure is expressed as the number of
                              different words in a document divided by the total number of words in that document [25].
                                    The text processing includes eliminating stop-words since, as is well known, they do
                              not provide relevant information to the analysis because they are common words. There
                              is not a unanimously accepted comprehensive list of stop-words since these words can
                              depend on the context and specific application. However, there is agreement on most words
                              that are considered stop-words. A proposed list of Spanish stop-words was used [26]. This
                              list contains articles, pronouns, adverbs, prepositions, and verbs.
                                    We used AntConc, which is a corpus analysis toolkit for concordance and text analysis
                              which allows the extraction of data such as word frequencies, collocations, concordances,
                              and so on [27]. We eliminated stop-words, computed the number of words with and
                              without stop-words, and the number of different words.
                                    Every word was lemmatized, i.e., it was converted to its root. The FreeLing software
                              suite was used for this process. FreeLing is an open-source software suite for natural
                              language processing. This library provides a wide range of analyzers for several languages.
                              It offers natural language application developers text processing and language annotation
                              facilities [28].
Machine Learning Approach for Personality Recognition in Spanish Texts
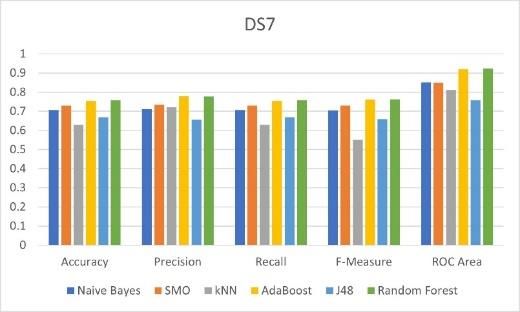
Appl. Sci. 2022, 12, 2985                                                                                                                    6 of 17

                                    Table 4. Example of a Spanish text gathered in the survey.

                                                          Original                                              Translated
                                       El día de ayer domingo me desperté muy tarde,       On Sunday, I woke up very late, about 10 o’clock.
                                         como a las 10, desperté muy contenta porque       I woke up very happy because I am from another
                                       como soy foránea únicamente convivo con mis         town, I only live with my family on weekends. I
                                     familiares los fines de semana, desperté y encendí      woke up and turned on the television and did
                                           la televisión e hice uno de mis pasatiempos        one of my favorite hobbies: watch an animal
                                      favoritos: ver televisión en un canal de animales,       channel. I like it very much. Then my sister
                                     me gustan mucho, después llego mi hermana con         arrived with my niece, and I continued learning
                                              mi sobrina y junto con ellas seguimos        about animals with them. Then we went to have
                                     aprendiendo sobre animales, después nos fuimos a        lunch with my whole family. Then we started
                                       almorzar con mi familia completa, después nos       playing lotería, a table game, with my nieces and
                                         pusimos a jugar con mis sobrinos y hermana         nephews, and my sister. Then we all had lunch
                                          lotería, después comimos todos juntos y nos      together and we went to the patio of my aunt to
                                       pasamos al patio de la casa a ayudar a pintar la     help paint the house. Later, I remembered I had
                                        casa de una tía, después recordé que hay tarea,     homework. I turned on the computer to do it. I
                                     encendí la computadora para hacerla, comencé con      started with what I like the most: programming,
                                       lo que más me gusta: programación, redes, etc..         networks, etc. I put the computer in energy
                                     Suspendí la computadora para bañarme y después          saving mode to take a bath, and later I tried to
                                     intenté terminar la tarea finalmente se terminó el
Appl. Sci. 2022, 12, x FOR PEER REVIEW                                                        finish my homework. Finally, Sunday ended,6 of 17
                                                  domingo y mi hermana se fue.                               and my sister left.

                                    Figure
                                    Figure 2.
                                           2. Example
                                              Example of
                                                      of aa handwritten
                                                            handwritten text.
                                                                         text.

                                           With
                                           To     this data,
                                               conduct   the we   built an
                                                              analysis,  theannotated
                                                                              handwriting linguistic   corpus for Spanish,
                                                                                                was transcribed                which
                                                                                                                     to electronic     wasOn
                                                                                                                                    texts.   useful
                                                                                                                                                av-
                                     for thethe
                                    erage,    construction
                                                  texts had 90of words
                                                                 the predictive     modeldiversity
                                                                          and a lexical     for personality
                                                                                                       of 0.19.recognition.
                                                                                                                 To measure lexical diversity,
                                    the type–token ratio (TTR) measure was used. This measure is expressed as the number
                                     3. Supervised Learning Model to Classify Texts
                                    of different words in a document divided by the total number of words in that document
                                    [25]. Machine learning is defined as the field of study that gives computers the ability to
                                     learnThe
                                            without    being explicitly
                                                text processing           programmed.
                                                                   includes   eliminatingThese       algorithms
                                                                                              stop-words           use
                                                                                                              since,  ascomputational
                                                                                                                         is well known,methods
                                                                                                                                          they do
                                     to learn
                                    not        fromrelevant
                                         provide      data without   relying to
                                                               information     onthe
                                                                                   a predetermined
                                                                                       analysis because equation    as acommon
                                                                                                             they are     model. The   algorithms
                                                                                                                                   words.    There
                                     adaptively
                                    is              improve their
                                        not a unanimously            performance
                                                                accepted               as the number
                                                                            comprehensive                 of instancessince
                                                                                                 list of stop-words        available
                                                                                                                                thesefor learning
                                                                                                                                       words   can
                                     increases   [10].
                                    depend on the context and specific application. However, there is agreement on most
                                    words  The
                                             thatmodel    for personality
                                                    are considered            prediction
                                                                      stop-words.            is basedlist
                                                                                       A proposed        onofa Spanish
                                                                                                                supervised    machinewas
                                                                                                                          stop-words     learning
                                                                                                                                              used
                                     approach     for  multiclass   classification.    We   evaluated     six  of
                                    [26]. This list contains articles, pronouns, adverbs, prepositions, and verbs.the  most  well-known      classi-
                                     fiers:We
                                            naive
                                                usedBayes   [11], which
                                                      AntConc,     sequential    minimal
                                                                           is a corpus        optimization
                                                                                          analysis              [12],
                                                                                                      toolkit for     k-nearest neighbors
                                                                                                                   concordance                 [13],
                                                                                                                                   and text anal-
                                    AdaBoost      [14], J48 [15], and   random     forest  [16].
                                    ysis which allows the extraction of data such as word frequencies, collocations, concord-
                                    ances,Theandconstruction
                                                   so on [27]. Weof the   model included
                                                                      eliminated     stop-words,a pre-processing
                                                                                                     computed thedata        step,ofsince
                                                                                                                        number        wordsthere
                                                                                                                                              withis
                                     often
                                    and     noisy, inconsistent,
                                          without    stop-words, and missing,   irrelevant,
                                                                          the number           or imbalanced
                                                                                         of different   words. data. Some of the causes are
                                     large databases, multiple and heterogeneous sources of data, and data collected for other
                                           Every word was lemmatized, i.e., it was converted to its root. The FreeLing software
                                    suite was used for this process. FreeLing is an open-source software suite for natural lan-
                                    guage processing. This library provides a wide range of analyzers for several languages.
                                    It offers natural language application developers text processing and language annotation
                                    facilities [28].
Machine Learning Approach for Personality Recognition in Spanish Texts
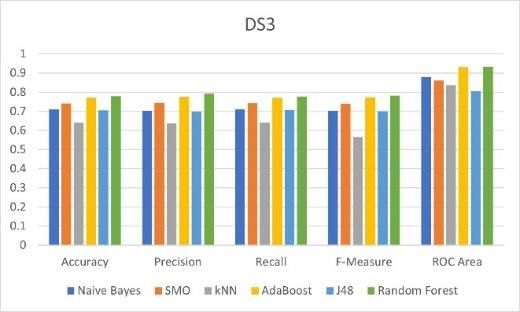
Appl. Sci. 2022, 12, 2985                                                                                          7 of 17

                            objectives other than different to data mining. Techniques for data pre-processing increase
                            the performance of data mining algorithms [10]. Therefore, we applied techniques such as
                            feature extraction, feature selection, and data augmentation. For most of the processes of
                            data mining, we used the Waikato environment for knowledge analysis, WEKA, which is a
                            full implementation of most of the machine learning algorithms [10]. For data augmentation,
                            we used the scikit-learn library in Python programming language.

                            3.1. Feature Extraction
                                 The text classification problem is challenging since machine learning algorithms prefer
                            well-defined inputs and outputs instead of raw text. Therefore, the text must be converted
                            into an understandable representation. This process is called feature extraction or feature
                            encoding [29]. We used the bag-of-words (BoW) model of text. BoW is a way of extracting
                            features from text for modeling. This model is only concerned with whether known words
                            occur in the document. The intuition is that documents are similar if they have similar
                            content [29]. Every verb and adjective in the text were converted to a nominal feature with
                            two possible values: Yes (the word occurs in the text) and No (the word does not occur in
                            the text).

                            3.2. Feature Selection
                                 The dataset is composed of a total of 546 features (540 features representing verbs and
                            adjectives in the text documents, and 6 features representing the demographic data) and a
                            personality label.
                                 Commonly, raw data contains a combination of features, some of which are irrelevant
                            since they do not provide information to the prediction process. The feature selection
                            process takes a subgroup of related features to be included in the training of a learning
                            model. Feature selection techniques are useful because they simplify models and reduce
                            training time. Feature selection aims to establish redundant or irrelevant features which can
                            be eliminated without losing information [10]. We applied two feature selection methods
                            in order to have several versions of the dataset.
                                 We used the correlation feature selection method with a Ranker search. This method
                            evaluates the worth of a feature by measuring the Pearson’s correlation between it and the
                            class [30]. This method generated a ranked list of the 546 features.
                                 We also used the Info Gain feature selection method with the Ranker search. This
                            method evaluates the worth of a feature via the information gain with respect to the class.
                            Information gain is computed by the contribution of the feature in decreasing overall
                            entropy [31]. The Info Gain method produced a ranked list of the 546 features.
                                 Additionally, for feature subset selection, we experimented with Wrappers and several
                            classifiers (e.g., AdaBoost and random forest). The Wrappers method evaluates sets of
                            features by means of a learning scheme [32]. However, few features were selected by the
                            Wrappers method; at most, 35 features were selected. Therefore, there was a significant loss
                            of information and the performance of the machine learning decreased.
                                 Cross validation is used to estimate the accuracy of the learning scheme for a set of
                            features. Based on the results of the feature selection process, we built eight datasets from
                            the original dataset. The datasets are detailed below.

                            3.3. Data Augmentation
                                 From the personality survey, we obtained a dataset with 120 instances where classes
                            are not equally represented (See Table 3). Imbalanced classes could lead to a bias toward
                            the majority class during the model training [33]. To deal with this issue, we resampled
                            the dataset by means of the synthetic minority oversampling technique, SMOTE [33].
                            SMOTE generates synthetic instances to over-sample the minority class, and it can also
                            under-sample the majority class if necessary. The original dataset was transformed using
                            SMOTE, and the new class distribution is summarized in Table 5. After applying SMOTE,
                            we obtained a dataset with 248 records.
Machine Learning Approach for Personality Recognition in Spanish Texts
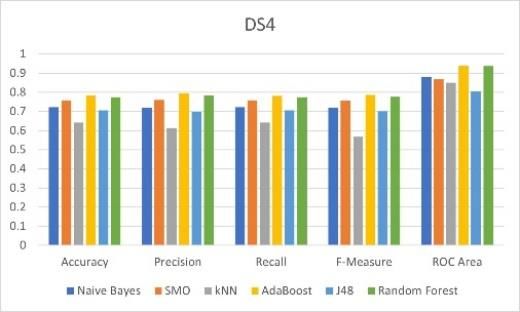
Appl. Sci. 2022, 12, 2985                                                                                                 8 of 17

                            Table 5. Class distribution.

                                       Personality                   Original Dataset           After SMOTE Dataset
                                      Dominance                               14                          62
                                       Influence                              26                          62
                                      Steadiness                              62                          62
                                      Compliance                              18                          62
                                                                             120                          248

                            3.4. Datasets
                                 We built eight different datasets base on the results of the feature selection process. In
                            the original dataset there are 546 features, 540 of which represent verbs and adjectives, and
                            six of which represent demographic data. Table 6 describes the nine datasets (including the
                            original dataset). It shows the number of features in each dataset and presents the features
                            representing demographic data.

                            Table 6. Datasets.

                             DS         Description                                Features    Demographics Features
                                                                                               Gender, Schooling, Civil
                                                                                               status, Occupation,
                             DS1        Original dataset                             546
                                                                                               Preferred Social Network
                                                                                               Friends in Social Network
                                        The 100 least correlated features                      Occupation, Preferred
                             DS2        with the class were removed,                 446       Social Network, Friends in
                                        according to the Correlation method                    Social Network
                                        The 150 least correlated features
                                                                                               Occupation, Friends in
                             DS3        with the class were removed,                 396
                                                                                               Social Network
                                        according to the Correlation method
                                        The 200 least correlated features
                                                                                               Occupation, Friends in
                             DS4        with the class were removed,                 346
                                                                                               Social Network
                                        according to Correlation method
                                        The 271 least correlated features
                                        (about half) with the class were                       Occupation, Friends in
                             DS5                                                     275
                                        removed, according to Correlation                      Social Network
                                        method
                                                                                               Gender, Schooling, Civil
                                        The 100 least informative features
                                                                                               status, Occupation,
                             DS6        were removed, according to the Info          446
                                                                                               Preferred Social Network,
                                        Gain feature selection method
                                                                                               Friends in Social Network
                                                                                               Gender, Schooling, Civil
                                        The 150 least informative features
                                                                                               status, Occupation,
                             DS7        were removed, according to the Info          396
                                                                                               Preferred Social Network,
                                        Gain feature selection method
                                                                                               Friends in Social Network
                                                                                               Schooling, Civil status,
                                        The 200 least informative features
                                                                                               Occupation, Preferred
                             DS8        were removed, according to the Info          346
                                                                                               Social Network, Friends in
                                        Gain feature selection method
                                                                                               Social Network
                                        The 265 least informative features
                                                                                               Schooling, Civil status,
                                        (about half) were removed,
                             DS9                                                     371       Occupation, Friends in
                                        according to the Info Gain feature
                                                                                               Social Network
                                        selection method

                                 To add features to the datasets, we experimented with several characteristics of the text
                            such as TD-IF, lexical diversity, number of words from each word type. However, we do
                            not observe improvement in the learning models. We need to conduct further experiments
                            and undertake processes such as principal components analysis in order to obtain new
Machine Learning Approach for Personality Recognition in Spanish Texts
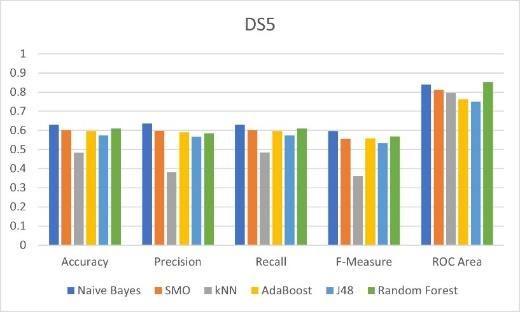
Appl. Sci. 2022, 12, 2985                                                                                                 9 of 17

                            features that provide relevant information to the model. Consequently, these features were
                            not included in the datasets.

                            3.5. Hyperparameter Optimization
                                  Some machine learning algorithms have parameters that can be tuned to optimize
                            their behavior. They are called hyperparameters to distinguish them from basic parameters
                            such as the coefficients in linear regression models. An example is the parameter k that
                            determines the number of neighbors considered in a k-nearest neighbor classifier. Usually,
                            best performance on a test set is achieved by adjusting the value of this hyperparameter to
                            suit the characteristics of the data [10].
                                  In the literature, there are some methods to tune hyperparameters such as grid search,
                            random search, and Bayesian optimization, among others [34]. However, there is not a
                            direct way to know how a change in a hyperparameter value will reduce the loss of the
                            model, therefore we must do experimentation.
                                  We conducted an empirical process of hyperparameters based on trial and error. Since
                            our dataset is small, the change of many hyperparameters did not have impact. Mainly
                            our objective with hyperparameters optimization was to have a configuration that allows
                            to have a reliable classification with the nine versions of our small dataset, since some
                            configurations could not evaluate the performance of the learning model because there
                            were few samples. Table 7 presents the hyperparameters configuration for our experiments.

                            Table 7. Hyperparameter optimization of classification algorithms.

                               Classifier                                    Hyperparameters
                                              Use a kernel estimator for numeric attributes = false (use a normal distribution)
                             Naïve Bayes
                                              Number of instances to process with batch prediction = 100
                             SMO              Kernel = polykernel
                                              k=5
                             kNN
                                              Distance function = euclidean distance
                                              Classifier = random Forest
                             AdaBoost
                                              Number of models to create = 10
                                              Pruning = true
                             J48
                                              Minimum number of instances per leaf = 2
                                              Number of features to consider in each split = int (log_2 (#predictors) + 1)
                             Random
                                              Percentage of the raw training dataset = 100
                             Forest
                                              Number of bags = 100

                            4. Results
                                  After we preprocessed the data and built the datasets, we proceeded to the evaluation
                            of several classifier algorithms to build the predictive model of personality.
                                  In machine learning, classification refers to a predictive modeling problem where
                            a class label is predicted for a given example of input data. A classifier algorithm finds
                            relationships between unknown objects and a set of correctly labeled objects in order to
                            classify the unknown objects [35]. There is an extensive range of classifier algorithms to be
                            used based on the nature of data.
                                  Based on an analysis of recent work on machine learning proposals, the nature of the
                            problem, and the data available, we decided to evaluate six of the most well-known clas-
                            sifiers: naive Bayes [11], sequential minimal optimization (support vector machines) [12],
                            k-nearest neighbors [13], AdaBoost [14], J48 [15], and random forest [16]. A stratified ten
                            times ten-fold cross-validation technique was used in the training and testing of the model,
                            which is the standard when there is limited data [10].
                                  We compared the statistical measures obtained by each one of the classifier algorithms
                            to select the best predictive model. We evaluated the classifier algorithms within the nine
                            datasets for the statistics measures: accuracy, precision, recall, F-measure, and receiver
                            operating characteristic (ROC) area.
Appl. Sci. 2022, 12, 2985                                                                                                                10 of 17

                                        Specifically, we focus on F-measure and ROC area. We are interested in F-measure
                                    because
 Appl. Sci. 2022, 12, x FOR PEER REVIEW      we want to have a balance between precision and recall. Precision is the fraction    10 of 17
                                  of relevant instances among the retrieved instances, while recall is the fraction of relevant
                                  instances that have been retrieved over the total amount of relevant instances [36]. The
                                  ROC curve
                                         Figureis3 used  for the
                                                   presents   the visual
                                                                  results comparison     of classification
                                                                           of the six classifiers          models,
                                                                                                  within the         which shows
                                                                                                              nine datasets  for the the
                                                                                                                                     five
                                  tradeoff   between  the  true positive  rate and  the  false positive rate. The area  under
                                   measures. Table 8 depicts the best classifier for each dataset according to F-measure. The  the ROC
                                  curve   is a measure
                                   best classifier  for of
                                                        eachthedataset
                                                                accuracy  of the model.
                                                                       according     to ROCWhen   a model
                                                                                               area        is closer
                                                                                                    is presented   intoTable
                                                                                                                        the diagonal,
                                                                                                                             9. Table it
                                                                                                                                       10
                                  is less accurate, and the model with perfect accuracy will have an area of 1.0 [36].
                                   presents the ten classifiers that have the best performance based on F-measure. Table 11
                                        Figure 3 presents the results of the six classifiers within the nine datasets for the five
                                   presents the ten classifiers that have the best performance according to ROC area.
                                  measures. Table 8 depicts the best classifier for each dataset according to F-measure. The
                                         Tables 8 and 9 show that AdaBoost and random forest are the classifiers with the best
                                  best classifier for each dataset according to ROC area is presented in Table 9. Table 10
                                   performance for most datasets according to F-measure and ROC area. Naive Bayes (DS5)
                                  presents the ten classifiers that have the best performance based on F-measure. Table 11
                                   and SMO (DS8) have good performance according to F-measure. The algorithms J48 and
                                  presents the ten classifiers that have the best performance according to ROC area.
                                   kNN have low performance with most datasets.

                            (a)                                       (b)                                              (c)

                            (d)                                       (e)                                              (f)

                            (g)                                       (h)                                              (i)
                                   Figure 3. Performance of classifiers in the nine datasets: (a) Original dataset; (b) without the 100
                                  Figure 3. Performance of classifiers in the nine datasets: (a) Original dataset; (b) without the
                                   least correlated features with the class; (c) without the 150 least correlated features with the class;
                                  100 least correlated features with the class; (c) without the 150 least correlated features with the class;
                                   (d) without the 200 least correlated features with the class; (e) without the 271 least correlated fea-
                                  (d) without
                                   tures with the
                                               the 200  least
                                                    class; (f) correlated
                                                               without thefeatures with
                                                                            100 least   the class; (e)
                                                                                      informative      without(g)
                                                                                                    features;   the 271 least
                                                                                                                  without  thecorrelated
                                                                                                                                150 least features
                                                                                                                                          informa-
                                  with
                                   tive features; (h) without the 200 least informative features; (i) without the 265 leastinformative
                                        the class; (f) without    the 100 least informative  features;  (g) without   the 150  least  informative
                                  features;
                                   features.(h) without the 200 least informative features; (i) without the 265 least informative features.

                                        As can be observed in Tables 8–10, the best classifier is AdaBoost (F-Measure = 0.786
                                   and ROC area = 0.939 for DS4 (276 features selected by Pearson correlation). Table 12
                                   shows the measures for this classifier. The average ROC area of 0.939 indicates that the
                                   model separates the four classes very well. Table 12 also shows that measures for Steadi-
                                   ness are low. This phenomenon was observed for every classifier; therefore, this class is
                                   the hardest class to predict.
Appl. Sci. 2022, 12, 2985                                                                                                            11 of 17

                                     Table 8. Best classifier for each dataset according to F-measure.

 Dataset                Classifier                 Accuracy           Precision           Recall          F-Measure          ROC Area
 DS1                    AdaBoost                   0.745968           0.774               0.746           0.754              0.911
 DS2                    AdaBoost                   0.770161           0.775               0.77            0.772              0.935
 DS3                    Random Forest              0.778226           0.792               0.778           0.782              0.933
 DS4                    AdaBoost                   0.782258           0.795               0.782           0.786              0.939
 DS5                    Naïve Bayes                0.629032           0.635               0.629           0.597              0.84
 DS6                    AdaBoost                   0.762097           0.774               0.762           0.766              0.924
 DS7                    Random Forest              0.758065           0.777               0.758           0.763              0.923
 DS8                    SMO                        0.741935           0.741               0.742           0.74               0.858
 DS9                    AdaBoost                   0.729839           0.734               0.73            0.731              0.858

                                     Table 9. Best classifier for each dataset according to receiver operating characteristic (ROC) area.

 Dataset                Classifier                 Accuracy           Precision           Recall          F-Measure          ROC Area
 DS1                    AdaBoost                   0.745968           0.774               0.746           0.754              0.911
 DS2                    Random Forest              0.766129           0.777               0.766           0.769              0.938
 DS3                    Random Forest              0.778226           0.792               0.778           0.782              0.933
 DS4                    AdaBoost                   0.782258           0.795               0.782           0.786              0.939
 DS5                    Random Forest              0.608871           0.585               0.609           0.568              0.852
 DS6                    Random Forest              0.75               0.767               0.75            0.755              0.929
 DS7                    Random Forest              0.758065           0.777               0.758           0.763              0.923
 DS8                    Random Forest              0.733871           0.747               0.734           0.738              0.923
 DS9                    Random Forest              0.705645           0.715               0.706           0.709              0.921

                                     Table 10. Top-ten classifiers according to F-measure.

 Dataset                Classifier                 Accuracy           Precision           Recall          F-Measure          ROC Area
 DS4                    AdaBoost                   0.782258           0.795               0.782           0.786              0.939
 DS3                    Random Forest              0.778226           0.792               0.778           0.782              0.933
 DS4                    Random Forest              0.774194           0.783               0.774           0.777              0.937
 DS2                    AdaBoost                   0.770161           0.775               0.77            0.772              0.935
 DS3                    AdaBoost                   0.770161           0.776               0.77            0.772              0.932
 DS2                    Random Forest              0.766129           0.777               0.766           0.769              0.938
 DS6                    AdaBoost                   0.762097           0.774               0.762           0.766              0.924
 DS7                    Random Forest              0.758065           0.777               0.758           0.763              0.923
 DS7                    AdaBoost                   0.754032           0.779               0.754           0.76               0.92

                                     Table 11. Top-ten classifiers according to ROC area.

 Dataset                Classifier                 Accuracy           Precision           Recall          F-Measure          ROC Area
 DS4                    AdaBoost                   0.782258           0.795               0.782           0.786              0.939
 DS2                    Random Forest              0.766129           0.777               0.766           0.769              0.938
 DS4                    Random Forest              0.774194           0.783               0.774           0.777              0.937
 DS2                    AdaBoost                   0.770161           0.775               0.77            0.772              0.935
 DS3                    Random Forest              0.778226           0.792               0.778           0.782              0.933
 DS3                    AdaBoost                   0.770161           0.776               0.77            0.772              0.932
 DS6                    Random Forest              0.75               0.767               0.75            0.755              0.929
 DS6                    AdaBoost                   0.762097           0.774               0.762           0.766              0.924
 DS7                    Random Forest              0.758065           0.777               0.758           0.763              0.923

                                          Tables 8 and 9 show that AdaBoost and random forest are the classifiers with the best
                                     performance for most datasets according to F-measure and ROC area. Naive Bayes (DS5)
                                     and SMO (DS8) have good performance according to F-measure. The algorithms J48 and
                                     kNN have low performance with most datasets.
Appl. Sci. 2022, 12, 2985                                                                                                     12 of 17

                                    As can be observed in Tables 8–10, the best classifier is AdaBoost (F-Measure = 0.786
                               and ROC area = 0.939 for DS4 (276 features selected by Pearson correlation). Table 12 shows
                               the measures for this classifier. The average ROC area of 0.939 indicates that the model
                               separates the four classes very well. Table 12 also shows that measures for Steadiness are
                               low. This phenomenon was observed for every classifier; therefore, this class is the hardest
                               class to predict.

                               Table 12. Measures for the best classifier.

 DS            Classifier   Class                 Accuracy         Precision          Recall        F-Measure    ROC Area
 DS4           AdaBoost     Steadiness                             0.608              0.726         0.662        0.885
                            Compliance                             0.831              0.790         0.810        0.955
                            Influence                              0.889              0.774         0.828        0.962
                            Dominance                              0.852              0.839         0.846        0.954
 Avg                                              0.782258         0.795              0.782         0.786        0.939

                                    DS4 was the dataset that provided the best performance to the classifiers. Tables 10 and 11
                               shows that the datasets built from correlation feature selection (DS2, DS3 and DS4) provided
                               better performance than info gain feature selection (DS6 y DS7).
                                    Table 13 presents the confusion matrix for AdaBoost with DS4. This confirms the
                               measures in Table 12. There are many true positives and true negatives (diagonal) and a
                               few false positives and false negatives (outside the diagonal).

                               Table 13. Confusion matrix for AdaBoost classifier with DS4.

                                                                                 Predicted
                                      Actual
                                                   Steadiness       Compliance          Influence   Dominance
                                    Steadiness          45                  7                  4             6           62
                                    Compliance           9                 49                  2             2           62
                                     Influence          12                  1                 48            1            62
                                    Dominance           8                  2                   0            52           62
                                                        74                 59                 54            61

                               Error Analysis
                                    We conducted an error analysis of AdaBoost with DS4 (the classifier with the best
                               performance) to identify which personality the model misclassified. We found that the
                               model has trouble in classify the Steadiness personality. Table 14 shows the misclassifica-
                               tions. Most of the errors are related to Steadiness personality. The model classified 17 actual
                               Steadiness instances incorrectly and misclassified 29 instances as Steadiness.

                               Table 14. Classification errors for AdaBoost with DS4.

                                                                                 Predicted
                                      Actual
                                                   Steadiness       Compliance          Influence   Dominance
                                    Steadiness           -                   7                4             6            17
                                    Compliance           9                   -                2             2            13
                                     Influence          12                   1                -             1            14
                                    Dominance           8                    2                0             -            10
                                                        29                 10                 6             9            54

                                    Figure 4 shows correct and incorrect classifications for each class and compares the ac-
                               tual personality versus the predicted personality. This shows that the other three personality
                               has more errors with Steadiness personality.
Predicted                   Actual            To create, to write, to listen, to be, to inspire, to get free,
                                                       3                     Steadiness                 Compliance                                        Words
                                                                              Personality                Personality                       older, to publish,   to be, to see
                                                       4                     Dominance                  Steadiness                             To do, to know, to be
                                                                                                                                To decide, favorite, to do, to play, to be, to smile, to
                                                        1                     Steadiness                 Dominance           To support, to help, short, to develop, to find, long, me-
                                                                                                                                                        overcome
                                                       5                      Influence                  Steadiness           dium, personal, main, next, satisfactory, to be, to sus-
Appl. Sci. 2022, 12, 2985                                                                                                     To have fun, favorite, to play, personal, to prefer,13 of to
                                                                                                                                                                                        17 be,
                                                        2                      Steadiness                  Influence                         tain, to have, to graduate
                                                                                                                                                         to have
                                                       6                    Compliance                   Steadiness                         To give, to go, to be, to have
                                                                                                                              To create, to write, to listen, to be, to inspire, to get free,
                                                        3                    Steadiness                  Compliance
                                                                                                                                            older, to publish, to be, to see
                                                            Dominance
                                                                    4         Dominance                    Steadiness                           To do, to know, to be
                                                                                                                              To support, to help, short, to develop, to find, long, me-
                                                                    5            Influence                 Steadiness          dium, personal, main, next, satisfactory, to be, to sus-
                                                                     Influence                                                                tain, to have, to graduate

                               Predicted personality
                                                                    6         Compliance                   Steadiness                        To give, to go, to be, to have

                                                                    Dominance

                                                         Compliance

                                                                        Influence
                                            Predicted personality

                                                                    Steadiness
                                                                                    Steadiness                    Compliance                            Influence                            Dominance
                                                                                                                               Actual personality
                                                                    Compliance Dominance           Influence   Compliance   Steadiness      x Correct classification       □   Incorrect classification

                               Figure
                            Figure    4. Actual
                                   4. Actual    personality
                                             personality    versus
                                                         versus    predicted
                                                                predicted    personality
                                                                          personality    comparation.
                                                                                      comparation.

                                                       Dominance
                                                       Figure    5 compares the prediction margin versus the predicted personality. The predic-
                                                         Steadiness
                            tion                       margin is Steadiness
                                                                    defined as the difference   between the probability
                                                                                         Compliance                    Influencepredicted for the actual
                                                                                                                                              Dominance
                                                                                                    Actual personality
                            class and the highest probability predicted for the other classes. We can see that Steadiness
                            personality
                                   Influence
                                             hasDominance Influence Compliance Steadiness
                                                 a prediction    margin very low while thex Correct classification □ Incorrect classification
                                                                                               other three personality has many
                               Predicted personality

                            instances    with   a prediction   margin  of  1.0.
                                Figure 4. Actual personality versus predicted personality comparation.

                                                                    Dominance

                                                       Compliance

                                                                        Influence
                                            Predicted personality

                                                             Steadiness

                                                                                                                               Prediction Margin

                                                                    ComplianceDominance          Influence Compliance   Steadiness        x Correct classification     □   Incorrect classification

                               Figure 5. Prediction margin versus predicted personality comparation.

                               5. Discussion
                                   Steadiness
                                    In this paper, a predictive model for Prediction
                                                                               personality
                                                                                      Margin recognition through text analysis has
                               been proposed.    The model was built based on a personality
                                           Dominance Influence Compliance Steadiness
                                                                                                          survey. The model relies on a
                                                                                       x Correct classification □ Incorrect classification
                               machine learning approach. An annotated linguistic corpus for Spanish was built using
                                Figure
                               the
                            Figure data
                                   5.  5.gathered
                                         Prediction
                                      Prediction     margin
                                                    in
                                                 marginthe    versus
                                                             survey.
                                                          versus      predicted  personality
                                                                       Ninepersonality
                                                                 predicted   datasets  were  comparation.
                                                                                               built using this corpus to train the
                                                                                        comparation.

                                5.We analyzed some misclassified instances individually. We found that the most com-
                                   Discussion
                            mon words    in Steadiness
                                     In this            instancesmodel
                                             paper, a predictive  are also
                                                                        forcommon   words
                                                                            personality    in other personality
                                                                                        recognition through textinstances,
                                                                                                                 analysis has
                            therefore
                                been proposed. The model was built based on a personality survey. Thethat
                                      when    these words   are present, the model  fails. We  also found       Steadiness
                                                                                                            model  relies on a
                            instances
                                machinehaslearning
                                           a narrow   set of words
                                                    approach.       while the other
                                                                An annotated        personalities
                                                                              linguistic corpus forhave a wider
                                                                                                     Spanish wasrange
                                                                                                                  built of
                                                                                                                        using
                            words, therefore when the instance has just few words and are common word for most
                                the data gathered in the survey. Nine datasets were built using this corpus to train the
                            of the personalities, the model fails and classify it as Steadiness. Table 15 shows some
                            misclassified instances compared with the actual personality.
Appl. Sci. 2022, 12, 2985                                                                                                  14 of 17

                            Table 15. Examples of misclassifications.

                                       Predicted             Actual
                                                                                                  Words
                                      Personality          Personality
                                                                           To decide, favorite, to do, to play, to be, to smile,
                              1        Steadiness          Dominance
                                                                                                to overcome
                                                                           To have fun, favorite, to play, personal, to prefer,
                              2        Steadiness           Influence
                                                                                               to be, to have
                                                                            To create, to write, to listen, to be, to inspire, to
                              3        Steadiness         Compliance
                                                                                 get free, older, to publish, to be, to see
                              4       Dominance            Steadiness                      To do, to know, to be
                                                                             To support, to help, short, to develop, to find,
                              5        Influence           Steadiness      long, medium, personal, main, next, satisfactory,
                                                                                 to be, to sustain, to have, to graduate
                              6       Compliance           Steadiness                  To give, to go, to be, to have

                            5. Discussion
                                   In this paper, a predictive model for personality recognition through text analysis
                            has been proposed. The model was built based on a personality survey. The model relies
                            on a machine learning approach. An annotated linguistic corpus for Spanish was built
                            using the data gathered in the survey. Nine datasets were built using this corpus to train
                            the classification model. Several machine learning algorithms were evaluated. AdaBoost
                            obtained the best performance.
                                   The AdaBoost learning model has a good performance in identifying three of the four
                            classes; as mentioned before, the model has trouble to identify Steadiness. We have reached
                            some conclusions about this weakness of the model. Much research has been conducted on
                            adults who are fully developed, but with adolescents and teenagers, there is still a lot that is
                            unknown; and it is recognized that the personality does not change but it is getting settled
                            as individual grow up. Our population are young adults, they are leaving youth group,
                            therefore they have not developed their personality completely. These results are consistent
                            with the results of another personality test we conducted based on big five model; we
                            found in 58 participants within the same age group (23.2 years old in average) that the 80%
                            are in the middle of the Stability dimension (Neuroticism in big five model), they do not
                            have low Stability neither high Stability [37]. Additionally, we have a population sample
                            with 71 men and 49 women; it is also recognized that younger girls often experience a dip
                            in emotional stability but increase as they near adulthood. For these reasons, we need to
                            conduct a study to know if our benchmark is appropriate for identifying the four classes.
                                   Even though the results are satisfactory, further research is required. At this point,
                            this predictive model is not a replacement for the DISC model for personality analysis.
                            It is important to emphasize that the study was conducted with a very specific group of
                            participants (young people, mostly students) which biases the results. The population
                            sample was also very small.
                                   The DISC model has been extensively used in professional settings, industry, and
                            business organizations. Even DISC is a popular model, this model has not been studied as
                            much as similar models, such as big five and MBTI, and therefore there are less controlled
                            research and relatively little scientific experimentation to support it. Additionally, DISC
                            model is focused on behavior to establish the personality, but there are another deeper
                            thought patterns and characteristics. This makes it less applicable in emotional situations.
                                   In the other hand, data mining is an experimental science, whose results depend on
                            the quality and quantity of the data and the nature of the problem. As a result of the new
                            studies, we will have a bigger and different benchmark, therefore we must set up new
                            experiments to have concluding findings. Additionally, machine learning is a huge field,
                            therefore, there are many techniques that could be useful, and they were not focused on
                            this research.
                                   There are companies which offers predictive analytics for decision makers and tech-
                            nologies to optimize processes through intelligent applications. Such is the case of SOTA
Appl. Sci. 2022, 12, 2985                                                                                                     15 of 17

                                 solutions (http://sota-solutions.de/wordpress_en/accessed on 6 March 2022), a company
                                 that develops big data solutions for producing, the energy, and the services industries.
                                 Their products are the results of many years of work on machine learning, statistics, mathe-
                                 matics, and software developing, therefore, they have very good performance. The core of
                                 these technologies is the same of our approach, machine learning and data mining. The
                                 difference strives in the application domain.
                                       Even though the results are encouraging, there are several points in the research
                                 agenda of personality analysis. For example, the DISC model includes 15 patterns that are
                                 related to the four dimensions of personality. As future work, we will conduct another
                                 survey to obtain more data to recognize personality patterns in addition to the personality
                                 dimensions. This will help to provide a more precise prediction. The corpus can also be
                                 enriched using other metrics for the texts. For example, it could integrate collocations, use
                                 Point Mutual Information, and n-grams in order to obtain the information of associated
                                 words. In particular, we want to explore the CollGram technique, which assigns to bigrams
                                 in a text two association scores computed on the basis of a large reference corpus to
                                 determine the strength of the collocation [38]. This analysis will allow us to deepen into the
                                 relationship between writing patterns and personality. CollGram has been used successfully
                                 to detect depression in annotated corpus [39]. Our corpus was small; therefore, it would be
                                 interesting to compare the performance. However, we are planning to gather more texts in
                                 a further study.
                                       The demographic data have not been thoroughly analyzed in the construction of the
                                 predictive model and some experimentation is needed to determine its relationship to per-
                                 sonality and writing behavior. A future line of research line is to analyze the handwriting.
                                       Additionally, during the results analysis, it was observed that most of the participants
                                 chose to write about the suggested topics. Most of the participants used words related
                                 to their studies and their desire to be successful. This could be due to the age of the
                                 participants. More experimentation is needed with participants of other ages in order to
                                 determine if this behavior is more related to the age of the participants or their personality.
                                       In summary, this research provides some insights into the analysis of personality,
                                 which will help in the planning of the next steps in the investigation of the relationship
                                 between personality and writing characteristics.

                                 Author Contributions: Conceptualization, Y.H. and A.M.; methodology, Y.H. and A.M.; software,
                                 C.A.; validation, H.E. and J.O.; formal analysis, Y.H.; investigation, A.M. and C.A.; resources, A.M.
                                 and H.E.; data curation, C.A.; writing—original draft preparation, Y.H.; writing—review and editing,
                                 Y.H., A.M., H.E. and J.O.; visualization, Y.H.; supervision, A.M.; project administration, A.M.;
                                 funding acquisition, A.M. and J.O. All authors have read and agreed to the published version of the
                                 manuscript.
                                 Funding: This research was funded by Tecnológico Nacional de México and The APC was funded by
                                 PRODEP.
                                 Institutional Review Board Statement: Not applicable.
                                 Informed Consent Statement: Informed consent was obtained from all subjects involved in the
                                 study.
                                 Data Availability Statement: The data presented in this study are available on request from the
                                 corresponding author.
                                 Conflicts of Interest: The authors declare no conflict of interest.

References
1.    Bromme, L.; Rothmund, T.; Azevedo, F. Mapping political trust and involvement in the personality space—A meta-analysis and
      new evidence. J. Pers. 2022, 1–27. [CrossRef] [PubMed]
2.    Stachl, C.; Au, Q.; Schoedel, R.; Gosling, S.D.; Harari, G.M.; Buschek, D.; Völkel, S.T.; Schuwerk, T.; Oldemeier, M.; Ullmann,
      T.; et al. Predicting personality from patterns of behavior collected with smartphones. Proc. Natl. Acad. Sci. USA 2020, 117,
      17680–17687. [CrossRef] [PubMed]
Appl. Sci. 2022, 12, 2985                                                                                                           16 of 17

3.    Christian, H.; Suhartono, D.; Chowanda, A.; Zamli, K.Z. Text based personality prediction from multiple social media data
      sources using pre-trained language model and model averaging. J. Big Data 2021, 8, 68. [CrossRef]
4.    Costa, P.T.; McCrae, R.R. Four ways five factors are basic. Pers. Individ. Dif. 1992, 13, 653–665. [CrossRef]
5.    Eysenck, H.J. Dimensions of Personality, 1st ed.; Routledge: New Brunswick, NJ, USA; London, UK, 1997.
6.    Marston, W.M. Emotions of Normal People; Harcourt Brace & Company: New York, NY, USA, 1928. [CrossRef]
7.    Moreno, J.D.; Martínez-Huertas, J.; Olmos, R.; Jorge-Botana, G.; Botella, J. Can personality traits be measured analyzing written
      language? A meta-analytic study on computational methods. Pers. Individ. Dif. 2021, 177, 110818. [CrossRef]
8.    Amirhosseini, M.H.; Kazemian, H. Machine learning approach to personality type prediction based on the Myers–Briggs type
      indicator® . Multimodal Technol. Interact. 2020, 4, 9. [CrossRef]
9.    Fu, J.; Zhang, H. Personality trait detection based on ASM localization and deep learning. Sci. Program. 2021, 2021, 5675917.
      [CrossRef]
10.   Witten, I.H.; Frank, E.; Hall, M.A.; Pal, C.J. Data Mining: Practical Machine Learning Tools and Techniques, 4th ed.; Morgan Kaufmann:
      Cambridge, UK, 2017.
11.   John, G.H.; Langley, P. Estimating Continuous Distributions in Bayesian Classifiers. In Eleventh conference on Uncertainty in
      Artificial Intelligence, UAI’95; ACM: New York, NY, USA, 1995; pp. 338–445. [CrossRef]
12.   Platt, J.C. Sequential Minimal Optimization: A Fast Algorithm for Training Support Vector Machines. MSRTR Microsoft Res. 1998,
      3, 88–95.
13.   Aha, D.W.; Kibler, D.; Albert, M.K. Instance-based learning algorithms. Mach. Learn. 1991, 6, 37–66. [CrossRef]
14.   Freund, Y.; Schapire, R.E. Experiments with a New Boosting Algorithm. In Proceedings of the 13th International Conference on
      Machine Learning, Bari, Italy, 3–6 July 1996; pp. 148–156.
15.   Quinlan, J.R. C4.5: Programs for Machine Learning, 1st ed.; Morgan Kaufmann: San Mateo, CA, USA, 1993.
16.   Breiman, L. Random Forests. Mach. Learn. 2001, 45, 5–32. [CrossRef]
17.   Srinarong, N.; Mongkolnavin, J. A Development of Personality Recognition Model from Conversation Voice in Call Center
      Context. In ACM International Conference Proceeding Series; Association for Computing Machinery: Bangkok, Thailand, 2021; pp.
      1–5. [CrossRef]
18.   Adi, G.Y.N.N.; Tandio, M.H.; Ong, V.; Suhartono, D. Optimization for Automatic Personality Recognition on Twitter in Bahasa
      Indonesia. Procedia Comput. Sci. 2018, 135, 473–480. [CrossRef]
19.   Ren, Z.; Shen, Q.; Diao, X.; Xu, H. A sentiment-aware deep learning approach for personality detection from text. Inf. Process.
      Manag. 2021, 58, 102532. [CrossRef]
20.   Xue, D.; Wu, L.; Hong, Z.; Guo, S.; Gao, L.; Wu, Z.; Zhong, X.; Sun, J. Deep learning-based personality recognition from text posts
      of online social networks. Appl. Intell. 2018, 48, 4232–4246. [CrossRef]
21.   Sher Khan, A.; Ahmad, H.; Zubair Asghar, M.; Khan Saddozai, F.; Arif, A.; Ali Khalid, H. Personality Classification from Online
      Text using Machine Learning Approach. Int. J. Adv. Comput. Sci. Appl. 2020, 11, 460–476.
22.   Agung, A.A.G.; Yuniar, I. Personality assessment website using DISC: A case study in information technology school. In
      Proceedings of the 2016 International Conference on Information Management and Technology (ICIMTech), Bandung, Indonesia,
      16–18 November 2016; pp. 72–77. [CrossRef]
23.   Milne, N.; Louwen, C.; Reidlinger, D.; Bishop, J.; Dalton, M.; Crane, L. Physiotherapy students’ DiSC behaviour styles can be
      used to predict the likelihood of success in clinical placements. BMC Med. Educ. 2019, 19, 1–15. [CrossRef]
24.   Chigova, E.A.; Plyushch, I.V.; Leskova, I.V. Organization of structured interaction on the base of psychographic characteristics
      within the model of personality traits DISC. IOP Conf. Ser. Mater. Sci. Eng. 2019, 483, 012097. [CrossRef]
25.   Jarvis, S. Grounding lexical diversity in human judgments. Lang. Test. 2017, 34, 537–553. [CrossRef]
26.   Bougé, K. Download Stop Words. Available online: https://sites.google.com/site/kevinbouge/stopwords-lists (accessed on 28
      January 2022).
27.   Anthony, L. Programming for Corpus Linguistics. In A Practical Handbook of Corpus Linguistics; Paquot, M., Gries, S.T., Eds.;
      Springer: Cham, Switzerland, 2020; pp. 181–207. [CrossRef]
28.   Padró, L.; Stanilovsky, E. FreeLing 3.0: Towards Wider Multilinguality. In Proceedings of the Eighth International Conference on
      Language Resources and Evaluation (LREC’12), Istanbul, Turkey, 21–27 May 2012; European Language Resources Association:
      Paris, France, 2012; pp. 2473–2479.
29.   Goldberg, Y. Neural Network Methods for Natural Language Processing; Morgan & Claypool: Williston, VT, USA, 2017. [CrossRef]
30.   Hall, M.A. Correlation-based Feature Selection for Machine Learning. Ph.D. Thesis, University of Waikato, Hamilton, New
      Zealand, 1999.
31.   Sharma, A.; Dey, S. Performance Investigation of Feature Selection Methods and Sentiment Lexicons for Sentiment Analysis. IJCA
      Spec. Issue Adv. Comput. Commun. Technol. HPC Appl. 2012, 3, 15–20.
32.   Kohavi, R.; John, G.H. Wrappers for feature subset selection. Artif. Intell. 1997, 97, 273–324. [CrossRef]
33.   Chawla, N.V.; Bowyer, K.W.; Hall, L.O.; Kegelmeyer, W.P. SMOTE: Synthetic Minority Over-sampling Technique. J. Artif. Intell.
      Res. 2002, 16, 321–357. [CrossRef]
34.   Schratz, P.; Muenchow, J.; Iturritxa, E.; Richter, J.; Brenning, A. Hyperparameter tuning and performance assessment of statistical
      and machine-learning algorithms using spatial data. Ecol. Modell. 2019, 406, 109–120. [CrossRef]
You can also read