MANNING RETAIL MARKET ANALYSIS - NOVEMBER 2017 - County Of Northern ...
←
→
Page content transcription
If your browser does not render page correctly, please read the page content below
MANNING RETAIL
MARKET ANALYSIS

                                                NOVEMBER 2017
Prepared for the Town of Manning & County of Northern Lights

Prepared by Cushing Terrell Architecture Inc.
RETAIL
       Market Analysis

Suite 216, 9525 201 Street | Langley, B.C. Canada | V1M 2M3 | 604.888.6680 p | www.CushingTerrell.com
Table of
CONTENTS
PREFACE......................................................................................................................................................................i
EXECUTIVE SUMMARY........................................................................................................................................ii

1.0    INTRODUCTION...........................................................................................................................................1
1.1    Scope of Study & Project Background .......................................................................................................................1
1.2    Report Structure.................................................................................................................................................................1
1.3    Sources of Information.....................................................................................................................................................1

2.0    LOCATION CONTEXT...................................................................................................................................5
2.1    Introduction..........................................................................................................................................................................5
2.2    Local & Regional Context................................................................................................................................................5
2.3    Transportation Context....................................................................................................................................................5

3.0    RETAIL TRADE AREA....................................................................................................................................9
3.1    Introduction..........................................................................................................................................................................9
3.2    Population Projections...................................................................................................................................................11
3.3    Age Profile...........................................................................................................................................................................15
3.4    Household Income Profile.............................................................................................................................................15
3.5    Retail Spending Profile...................................................................................................................................................17

4.0    RETAIL SUPPLY.......................................................................................................................................... 21
4.1    Introduction........................................................................................................................................................................21
4.2    Manning Retail Market...................................................................................................................................................21
4.3    Retail Vacancy....................................................................................................................................................................21
4.4    Retail Inventory by Category........................................................................................................................................25
4.5    Retail Inventory by NAICS..............................................................................................................................................27
4.6    Retail Space Per Capita...................................................................................................................................................27

5.0    RETAIL DEMAND....................................................................................................................................... 31
5.1    Introduction........................................................................................................................................................................31
5.2    Retail Floor Space Demand...........................................................................................................................................31
5.3    Developing Successful Retail.......................................................................................................................................33
5.4    Summary & Implications................................................................................................................................................37
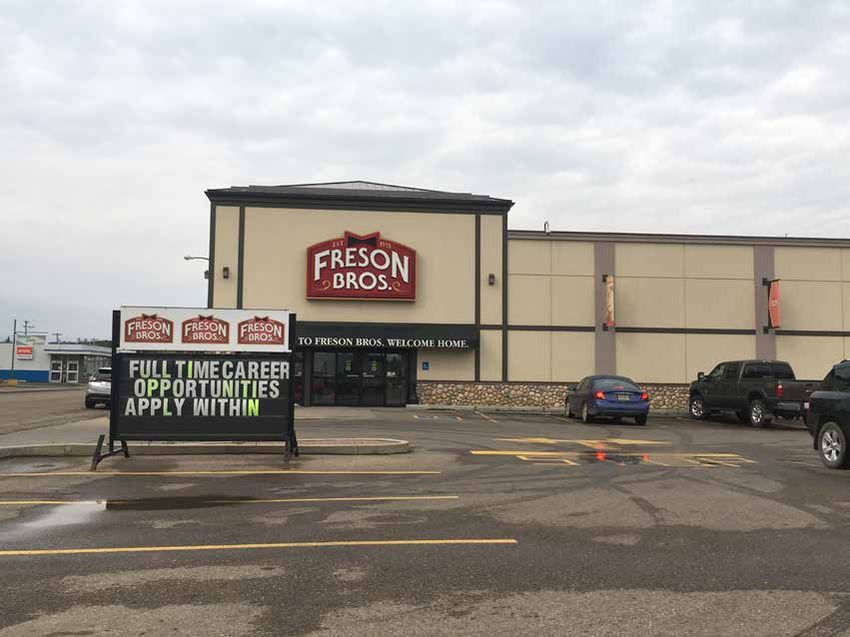
Table of
CONTENTS
 APPENDICES
 A Detailed Retail Inventory.............................................................................................................................................. 40

 TABLES......................................................................................................................................................................
 3.1 Trade Area Demographic Summary..........................................................................................................................12
 3.2 Trade Area Population Projections Summary 2017 - 2027................................................................................13
 3.3 Trade Area Population Age Breakdown...................................................................................................................14
 3.4 Trade Area Household Income Breakdown............................................................................................................16
 3.5 Trade Area Retail Spending 2017................................................................................................................................18

 4.1 Retail Market Snapshot...................................................................................................................................................22
 4.2 Town of Manning Retail Inventory Summary........................................................................................................23
 4.3 Retail Inventory by NAICS..............................................................................................................................................24

 5.1 Town of Manning 2017 Estimated Retail Market Share & Sales Productivity.............................................32
 5.2 Town of Manning 2022 Targeted Retail Market Share & Resulting Demand Forecast...........................35

 FIGURES........................................................................................................................................................ ............
 2.1 15-30-45 Minute Drive Time from Town of Manning............................................................................................4
 2.2 Town of Manning AADT Traffic Counts......................................................................................................................6

 3.1    Town of Manning/County Northern Lights Retail Trade Area.........................................................................10
 3.2    Trade Area Population Age Breakdown...................................................................................................................14
 3.3    Trade Area Household Income Breakdown............................................................................................................17
 3.4    Trade Area Retail Spending Summary......................................................................................................................20
 3.5    Trade Area Retail Spending By General Category................................................................................................20

 4.1    Town of Manning Retail Inventory by Category...................................................................................................24
 4.2    Retail Inventory by NAICS..............................................................................................................................................24
 4.3    Representative Manning Retail Imagery.................................................................................................................26
 4.4    Retail Space Per Capita Growth Continuum...........................................................................................................28

 5.1 Town of Manning 2022 Net Potential Demand by Category...........................................................................34
This page is left intentionally blank
i        PREFACE

Cushing Terrell Architecture Inc. (“Cushing Terrell”)         Reference material for this report was obtained
was commissioned by the County of Northern                    from, but not limited to: the Town of manning,
Lights (“County”) in partnership with the Town of             County of Northern Lights, Commercial Real
Manning (“Manning”) in October 2017 to conduct                Estate Brokerage Firms, International Council
a Retail Market Analysis for Manning and the                  of Shopping Centers, and Cushing Terrell
County.                                                       Architecture Inc.

The study was carried out over the period of                  Cushing Terrell does not warrant that any
October - November 2017.                                      estimates contained within the study will be
                                                              achieved over the identified time horizons, but
The objective of this study is to thoroughly                  that they have been prepared conscientiously and
document Manning’s current retail inventory.                  objectively on the basis of information obtained
The next step estimates the realistic retail Trade            during the course of this study.
Area area for which Manning serves and the
retail expenditure profile across various retail              Also, any tenant references made in the report
categories/store types as an indication of retail             are for illustrative purposes only and should not
inflow/outflow and opportunities therein that                 be taken as guarantees that they will locate in
Manning and the County could potentially                      Manning or the County, but rather that they could
pursue. The end result is to fill gaps and bolster            represent compatible “target” category types
the local retail market by retaining or attracting            to pursue either for local businesses or external
greater market share of resident and passing                  regional businesses.
motorists’ spending in the community.
                                                              This analysis was conducted by Cushing Terrell as
Retail spending (i.e. demand), Manning’s retail               an objective and independent party, and is not
inventory, and its corresponding productivity                 an agent of the Town of Manning or County of
                                                              Northern Lights.
(i.e. supply) was estimated to identify gaps in
Manning’s current provision of shops and services.
                                                              As is customary in an assignment of this type,
                                                              neither our name nor the material submitted may
This document is intended to assist Manning
                                                              be included in a prospectus, or part of any printed
and the County in promoting the community,                    material, or used in offerings or representations
working with developers and investors, as well as             in connection with the sale of securities or
attracting new retail or business opportunities.              participation interest to the public, without the
It further aims to retain existing retailers as part          expressed permission of the County of Northern
of a wider Economic Development Strategy for                  Lights, Town of Manning or Cushing Terrell
business retention and attraction and succession              Architecture Inc.
planning.
                                                              Cushing Terrell Architecture Inc.
                                                              2017

i        |   Retail Market Analysis - Town of Manning & County of Northern Lights, Alberta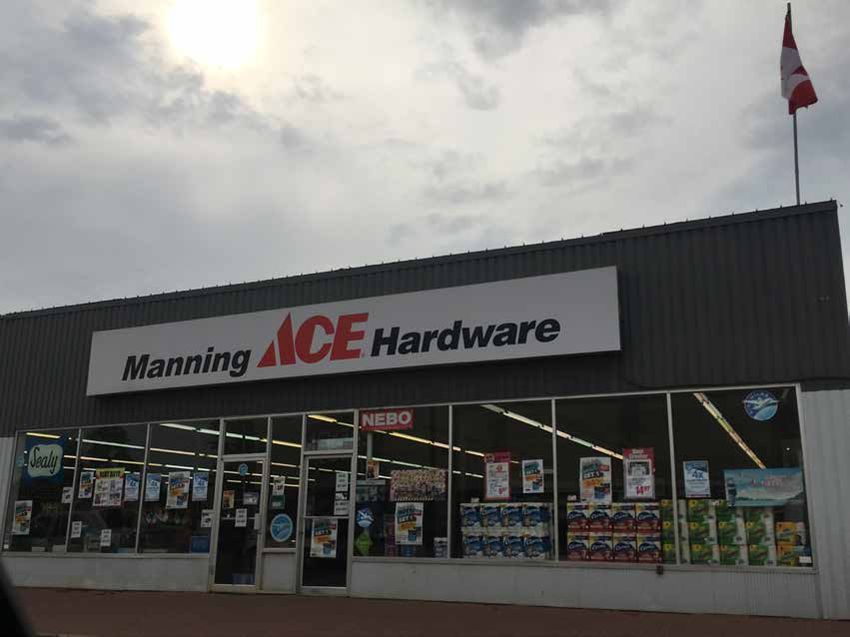
iiEXECUTIVE SUMMARY

 INTRODUCTION                                               Highway motorists are creatures of habit
 Cushing Terrell Architecture Inc. (“Cushing Terrell”)      who tend to stay in their vehicles unless the
 was commissioned by the County of Northern                 environment is convenient for them to stop;
 Lights (“County”) in partnership with the Town of          Manning has this potential.
 Manning (“Manning”) in October 2017 to conduct
 a Retail Market Analysis for Manning and the
                                                            Retail shops and services are predominantly
 County. The study was carried out over the period
 of October - November 2017.                                located in Manning and include Grocery,
                                                            Pharmacy, Home Improvement and Personal
 LOCATION CONTEXT SUMMARY                                   Services such as banks and Financial Services.
 The County of Northern Lights consists of                  The Town of Manning and County of Northern
 2,074,000 hectares of land, and includes                   Lights both recognize the role that Manning plays
 the Hamlets of Dixonville and North Star;                  along the regional highway corridor as a pit-stop
 the Town of Manning is located within the                  between the more populous communities of
 County boundaries as well and is the centre                Peace River to the South and High Level or La
 point from which the 15, 30 and 45-minute                  Crete to the North.
 drive times emanate. The main drivers of the
 economy in this County are commercial and                  Peace River is an approximate 1 hour drive under
 industrial enterprises which operate year-round,           normal driving conditions. Similarly High Level
 including the sectors of agriculture, oil & gas,           is an approximate 2 hour drive time north under
 aggregate resource extraction services, and                similar normal driving conditions.
 forestry. Nearby to the Town of Manning are
 a lumber mill, major oil & gas plants, a pulp              RETAIL TRADE AREA SUMMARY
 mill, transportation, and oilfield service related         The Retail Trade Area for Manning utilized a
 companies.                                                 combination of drive times and competitive
                                                            forces (e.g. Town of High Level, Hamlet of La
 The County encourages commercial                           Crete to the north and Towns of Grimshaw and
 development along the highway where                        Peace River to the south). Although the trade
 appropriate, and locally where commercial                  area is skewed in a north south orientation, the
 areas are already established, unless otherwise            smaller hamlets of Paddle Prairie in the north and
 approved. Highway 35 and rail connect the                  Dixonville in the south would likely be drawn to
 County to the rest of Alberta and beyond;                  High Level and Peace River respectively.
 a municipal airport is also located north of
 Manning, in the County.                                    Residents of Paddle Prairie may also be drawn to
                                                            High Level, though the ferry and ice crossing are
 The strategic Hwy 35 retail frontage that exists           factors in this decision-making. The single biggest
 today is strong, but could and should be further           draw to the south would be shopping in Peace
 exploited as one of the key differentiators in the         River given the approximate 60-minute drive time
 region capable of not just slowing motorists, but          to the regional large format, Wal-Mart anchored
 stopping them.                                             shopping node.

                             Retail Market Analysis - Town of Manning & County of Northern Lights, Alberta   |   ii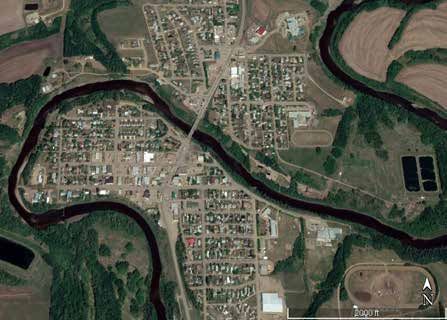
ii           EXECUTIVE SUMMARY

The Total Trade Area population is estimated                  Regardless of where residents spend their money,
for 2017 to be almost 3,800. This population                  realizing that spending will occur in Grande
is forecast to generally remain in and around                 Prairie, Peace River or High Level, the Top 5 retail
that level over the foreseeable horizon and                   spending categories for the Total Trade Area are:
approaching 4,000 by 2027.                                    1. Grocery & Specialty Foods - $8.4 Million
Even if the trade area were to expand beyond the              2. Auto/RV/Motorsport - $7.2 Million
boundaries as shown in Figure 3.1, the impact                 3. Home Furnishings, Electronics and Appliances -
would not be significant and on that basis it is                 $3.6 Million
more realistic for Manning to focus on its existing           4. Clothing & Apparel - $3.6 Million (including
trade area, but also harness its strategic location              Footwear and Jewelry)
along Hwy 35 to serve as an ideal pit stop for
passing motorists and other target users drawn                5. Alcohol & Tobacco - $2.2 Million
to the industrial components in Manning and
elsewhere in the County.                                      RETAIL SUPPLY SUMMARY
                                                              The Manning retail market has an estimated
A summary of the current age profile reveals a                streetfront floor space of approximately 173,200
                                                              sf. This floor space is comprised of business types
slightly older family profile. In total, the median
                                                              that range from Grocery to Home Improvement,
age is 41.2 years of age, with a dominant age
                                                              Restaurants, Personal Services such as Salons as
group of 50 to 54 years.                                      well as Professional Services. When excluding
                                                              businesses that are not retail related but do occupy
A summary of the current average Household                    retail street front spaces, the total inventory is an
Income in the Retail Trade Area reveals an average            estimated 132,600 sf.
Household Income in 2017 estimated at just over
$84,000 in the Manning Trade Area.                            The Top 5 retail categories in terms of overall retail
                                                              floor space in Manning are:
Average Household Incomes in the Trade Area
                                                                1. Home Improvement			                  29,000 sf
are forecast to grow over the 5-year period 2017
to 2022, to an estimated $93,000, in conjunction                2. Grocery & Specialty Foods		          19,750 sf
with an improving provincial economy. Although                  3. Auto/RV/Motorsport & Parts/Service 18,340 sf
the dominant income brackets a may be in the                    4. Restaurant F&B			                    18,000 sf
$50,000 to $80,000 levels, there is a relatively                5. Pharmacy				8,000 sf
large component of the Total Trade Area (17%)
that have an average Household Income over                    RETAIL MARKET SNAPSHOT
$125,000. Thus, the overall income profile
                                                                                                                TOTAL      173,237 sq. ft.
represents overall economic health and stability
for retail opportunities.                                                  TOTAL (Excluding Non-Retail Streetfront)        154,415 sq. ft.

                                                                TOTAL RETAIL ONLY (Retail, Personal Services & F&B)        132,665 sq. ft.
The Total Trade Area is estimated at $36.5 Million
                                                                                                               VACANT         3,000 sq. ft.
(2017 year-end estimate).
                                                                                                            % VACANT
                                                                                                                              1.7%
                                                                                  (of ALL streetfront commercial space)
                                                                                                 Retail Space Per Capita
                                                                                                                               36.1 sq.ft./capita
                                                                                  (against Trade Area Population 3,677)

iii      |   Retail Market Analysis - Town of Manning & County of Northern Lights, Alberta
ii    EXECUTIVE SUMMARY
                                           Residential Population Density
                                              1 dot = 100

                                           Manning/County NL Trade Area
                                              Manning/County NL Trade Area                     Paddle Prairie

RETAIL TRADE AREA

                                                                                                    Manning

                                                                                                 Dixonville

                                                                                                                      Peace River

                                                                                                  Grimshaw

2022 TARGETED RETAIL MARKET SHARE AND RESULTING DEMAND FORECAST

                                                                                                                     2022
                    Miscellaneous                                                                                                                   2022
                                                                                 2022                    2022
                       Spending            Merchandise Category                                                              2022               Potential Net
                                                                             Target Market           Estimated
                    Inflow Factor 1                                                                                      Potential Retail       Future Retail
                                                                             Share of Retail        Retail Sales $
                                                                                                                           Inventory             Floorspace
                                                                               Spending               (Inflow) 2
                                                                                                                                                  Demand
                         5%                    Grocery & Specialty Foods         80%                     $7,386,581                 26,860                7,110
                         10%                                    Pharmacy         92%                     $1,300,625                  4,730                  230
                         10%                           Alcohol & Tobacco         83%                     $2,102,020                  8,408                  408
                         5%                              Personal Services       35%                      $614,094                   3,509                1,334
                         0%                            Clothing & Apparel        58%                     $1,560,750                 10,405                  505
                         0%                                     Footwear         14%                        $91,963                    736                   36
                         0%                         Jewelry & Accessories         0%                             $0                      0                    0
                         0%                               Health & Beauty        49%                      $367,854                   2,102                  102
                         0%                Home Furnishings & Accessories        51%                      $772,492                   4,414                  214
                         0%                 Home Electronics & Appliances        42%                      $977,439                   6,516                  316
                         20%             Home Improvement & Gardening 4          98%                     $1,379,451                 11,036                  536
                         0%                          Books & Multimedia           0%                             $0                      0                    0
                         0%                  Sporting Goods & Recreation         62%                      $249,615                   1,997                   97
                         0%                               Toys & Hobbies         85%                      $315,303                   2,522                  122
                         5%                       Miscellaneous Specialty        129%                    $1,589,653                 12,717                  617
                         50%                              Restaurant F&B         75%                     $2,554,976                 20,440                2,440
                         30%                     Drinking Establishments         96%                      $525,505                   4,204                  204
                         0%                      Entertainment & Leisure         60%                      $735,707                   7,357                  357
                         10%                     Auto Parts & Accessories        159%                    $1,535,526                 10,237                  497
                         5%               Auto/RV/Motorsports Dealership         34%                     $2,711,606                  9,039                  439

                                                                                  68%                 $26,771,160                147,229                15,564

                                Retail Market Analysis - Town of Manning & County of Northern Lights, Alberta                               |      iv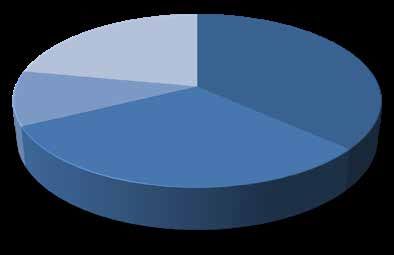
ii            EXECUTIVE SUMMARY

The estimated retail space per capita ratio for the            •   Tim Hortons            • Booster Juice
Manning retail trade area is in the range of 33                •   A&W                    • Red Apple
sf/capita if not including non-retail street front             •   McDonalds              • Cobs Bread
space.                                                         •   IHOP

At a per capita level of 33 sf, the Town of Manning            The overall message is that retail demand is not
would seem to be at a point of balance relative to             predicated on simply adding new space, but
its supported retail trade area and that demand                specifically targeting new businesses that have the
                                                               capacity to succeed while not creating a negative
will be limited, but that Manning should be
                                                               impact on existing local businesses. In retail
very targeted in its approach to obtaining the
                                                               however, sometimes competition is necessary to
most compatible retail businesses to fit within
                                                               ensure that spending is retained in the community
the community’s existing vacant spaces or land
                                                               and in many cases a new competitor can actually
fronting or visible to/from Hwy 35.
                                                               increase the overall spending.

RETAIL DEMAND SUMMARY                                          In a smaller market like Manning the key to
The demand analysis illustrates that in                        attracting businesses lies not only in presenting
merchandise categories such as Grocery &                       a good market and business case, but will likely
Conveniences, Personal Services, and Restaurants               fall under two (2) approaches; securing franchise
(most likely limited-service) could boost their                partners and succession planning.
market share to provide sufficient demand to                   For many businesses with recognized brands,
warrant additional businesses in the community                 the likelihood of attracting a corporate run store
by 2022.                                                       is limited, but the franchise model is a distinct
                                                               possibility. The optimal approach for this target is to
This opportunity is summarized as follows:                     look at a market like Grande Prairie, Peace River or
    Grocery & Convenience new demand 7,200 sf                  Edmonton to see if existing franchise holders would
    market share increase from 62% to 80%                      be interested in additional locations as part of an
                                                               overall locational network strategy, particularly in
    Restaurant F&B new demand		                 2,400 sf
                                                               the north along Hwy 35/Hwy 2.
    market share increase from 69% to 75%
    Personal Services new demand                1,300 sf       The second approach for succession planning is
    market share increase from 23% to 35%                      often overlooked in smaller or rural markets, where
                                                               a successful local business may be family run and is
                                                               of value to the community, but its future is up-in-
If Manning were to increase its overall current
                                                               the-air because no one is able to take over.
market share penetration by 8% from an estimated
60% to 68%, then the total demand by the year                  Manning may not exhibit significant demand
2022, without new population growth could be                   forecasts, but with strategic messaging,
                                                               collaborations and awareness can retain and attract
approximately 15,000 sf.
                                                               business opportunities that could utilize existing
                                                               vacancies or new land for the betterment of the
Specific potential targeted tenants, most of whom
                                                               community.
would operate a Franchise model could include:

v         |   Retail Market Analysis - Town of Manning & County of Northern Lights, Alberta
Photos courtesy of Cushing Terrell Architecture Inc., 2017
1.0
    introduction
1.1
SCOPE OF STUDY &                                              Section 4 - Retail Supply:
PROJECT BACKGROUND                                            Assesses the location and characteristics of
Cushing Terrell was commissioned by the                       Manning’s current nodes of retail activity
County in partnership with the Town of Manning                (“supply”), including developing or future
(“Manning”) to conduct a Retail Market Analysis               planned retail sites. Fieldwork assessments
for Manning and the County. The objective of                  included identifying and quantifying the entire
this study is to thoroughly document Manning’s                Manning retail inventory by retailer, merchandise
current retail inventory and define the realistic             category and NAICS industry classification.
retail Trade Area area for which it serves. The
end result is to fill gaps and bolster the local              Section 5 – Retail Demand:
retail market by retaining or attracting greater              Quantifies the Trade Area spending and sales
market share of resident and passing motorists’               productivities, resulting in “demand” associated
spending in the community.                                    with each retail category over the next 5 years for
                                                              Manning. Demand estimates are then applied
1.2                                                           against supply to estimate the magnitude of
REPORT STRUCTURE                                              inflow and outflow of retail on a category-by-
Cushing Terrell conducted on-the-ground                       category basis.
research in July 2017 to gain a firm
understanding of existing and future retail                   1.3
prospects in Manning. The purpose of this                     SOURCES OF INFORMATION
research was to establish a solid foundation                  During the course of this study, a number
and baseline for determining the depth of retail              of resources were used to quantify retail
opportunity, associated gaps in the market                    market supply and demand conditions largely
provision of shops and services, and to determine             comprising primary and secondary research.
what type of retail could fill these gaps.
To respond to the work program process, the                   The following sources of information were used
document is presented in the following sections:              in this Retail Market Analysis:
Section 1 - Introduction:                                     •     Alberta Ministry of Transportation, Highways
Introduces the study process and structure.                         1 to 986 Traffic Volume History 2003-2016
Section 2 - Location Context:                                 •     Cushing Terrell Architecture Inc. Detailed
Lays out the important regional and local context                   Retail Inventory Fieldwork, July 2017.
of the Town of Manning & County of Northern                   •     PREDA Retail Market Overview and Trade
Lights in terms of history, geographic location                     Area Profiles, 2016 (Cushing Terrell)
and traffic counts.                                           •     Pitney Bowes Demographics & Spending
                                                                    Data, 2017
Section 3 - Retail Trade Area Profile:                        •     Manning Chamber of Commerce Business
Identifies and defines the Primary and Secondary                    Directory
Retail Trade Areas and documents the population               •     Town of Manning
and expenditure profiles generated from                       •     County of Northern Lights
within these respective trade areas, against                  •     Business Inventory listings
which estimates of floor space demand can be
attributed.

1       |   Retail Market Analysis - Town of Manning & County of Northern Lights, Alberta
Retail Market Analysis - Town of Manning & County of Northern Lights, Alberta | 2
1

3   |   Retail Market Analysis - Town of Manning & County of Northern Lights, Alberta
Figure 2.1
15-30-45 MINUTE DRIVE TIME FROM JUNCTION OF MAIN ST & HWY 35

                                                                    45-MINUTE
                                                                    DRIVE TIME

                        30-MINUTE
                        DRIVE TIME

                  15-MINUTE
                  DRIVE TIME

                   15-MINUTE
                   DRIVE TIME

                                        30-MINUTE
                                        DRIVE TIME

                45-MINUTE
                DRIVE TIME

                      Retail Market Analysis - Town of Manning & County of Northern Lights, Alberta   |   4
2.0
location context
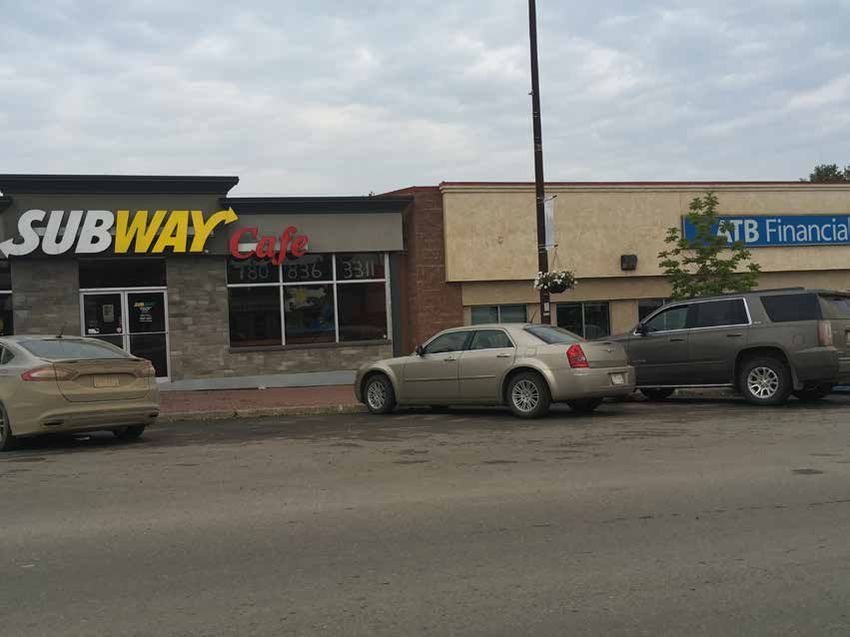
2.1 Retail shops and services are predominantly
INTRODUCTION located in Manning and include Grocery,
Location factors are an essential foundation to Pharmacy, Home Improvement and Personal
retail success, and an understanding of these Services such as banks and Financial Services.
factors can help create the necessary conditions The Town of Manning and County of Northern
for attracting and retaining retail businesses in Lights both recognize the role that Manning plays
a community. This section identifies the Town along the regional highway corridor as a pit-stop
of Manning’s regional and local characteristics between the more populous communities of
as they relate to the attraction and retention of Peace River to the South and High Level or La
retail businesses and merchandise categories. Crete to the North.
2.2 Peace River is an approximate 1 hour drive under
LOCAL & REGIONAL CONTEXT normal driving conditions. Similarly High Level
The County of Northern Lights consists of is an approximate 2 hour drive time north under
2,074,000 hectares of land, and includes similar normal driving conditions.
the Hamlets of Dixonville and North Star;
the Town of Manning is located within the 2.3
County boundaries as well and is the centre TRANSPORTATION CONTEXT
point from which the 15, 30 and 45-minute One of the most significant aspects to successful
drive times emanate. The main drivers of the commercial development relates to patterns
economy in this County are commercial and of transportation. The ability to be accessible
industrial enterprises which operate year-round, as well as visible to high volumes of traffic are
including the sectors of agriculture, oil & gas, among the most influential considerations for
aggregate resource extraction services, and retail businesses.
forestry. Nearby to the Town of Manning are
a lumber mill, major oil & gas plants, a pulp For a rural or smaller secondary market such as
mill, transportation, and oilfield service related Manning, a retail location relative to strong and
companies. accessible transportation patterns remains an
important component. This may be slightly less
The County encourages commercial essential for a local independent business.
development along the highway where
appropriate, and locally where commercial However, it is paramount for some of the more
areas are already established, unless otherwise recognized brand that it have access to as much
approved. Highway 35 and rail connect the customer base as necessary, largely because the
County to the rest of Alberta and beyond; a cost overhead of either acquiring a Franchise
municipal airport is also located just north of the License or operating as a corporate entity has a
Town of Manning, in the County. bottom line that must be adhered to.
5 | Retail Market Analysis - Town of Manning & County of Northern Lights, AlbertaFigure 2.2
TOWN OF MANNING AADT TRAFFIC COUNTS
(Source: Alberta Transportation 2016)
Hwy 35
2,060 COUNTY
COUNTY
OF NORTHERN OF NORTHERN
2 Township Rd 920 LIGHTS
LIGHTS
2,450
TOWN OF
MANNING
3,010
1 Township Rd 691 COUNTY
OF NORTHERN
COUNTY LIGHTS
OF NORTHERN 2,410
LIGHTS
Hwy 35 2016 AADT average mode
Passenger Vehicles 77.6%
Recreational Vehicles 2.2%
Bus 1.2%
Single Unit Truck 4.3%
Tractor Trailer Truck 15.0%
Retail Market Analysis - Town of Manning & County of Northern Lights, Alberta | 62
The Alberta Ministry of Transportation provides The lower speed limits through Manning along
detailed traffic counts on major highways and Hwy 35 through the centre of town are essential
junction points. The most recent 2016 data to enabling strong visibility. Vacant parcels
documented in the form of Average Annual fronting Hwy 35, particularly near the industrial
Daily Traffic (AADT) from this Provincial source is park and Nova Hotel may represent strategic infill
shown in Figure 2.2 and as follows: opportunities for higher profile tenants to whom
driving motorists are a target consumer.
1) Hwy 35 at Township Rd 691 (South side of
Manning) Overall, Manning’s regional location as well as the
North on Hwy 35 = 3,010 manner in which the retail is configured in the
South on Hwy 2 = 2,410 core of the community at the intersection of Hwy
35 and main Street provides a very strong location
Hwy 35 is the main spine of highway commercial to be a traveler pit stop and local convergence
in Manning along which the speed limit is node for commercially compatible retail uses.
reduced and retail fronts both sides of Hwy 35
with valuable frontage exposure and a “main
street” streetscape potential, which is unlike
other similar communities in Northern Alberta,
namely Grimshaw, Fairview, High Level or La
Crete.
2) Hwy 35 at Township Rd 920 (North side of
Manning)
North on Hwy 35 = 2,060
South on Hwy 35 = 2,450
Traffic counts are important considerations
for retailers and in particular branded or chain
retailers. For local businesses the current traffic
volume accessing the Main Street area and
core shopping and services district is relatively
convenient in Manning.
However it will be very important to other higher
profile tenants and/or developers to have high
visibility to/from passing motorist traffic along
Hwy 35 as they pass through Manning.
7 | Retail Market Analysis - Town of Manning & County of Northern Lights, AlbertaPhoto courtesy of Cushing Terrell Architecture Inc.
Retail Market Analysis - Town of Manning & County of Northern Lights, Alberta | 83.0
retail trade area
3.1
INTRODUCTION
In order to create a framework for evaluating retail Retail Trade Area Determinants
demand and subsequent gaps in the provision of
i. Transportation networks, including
shops and services, it is necessary to define and
streets and highways, which affect access,
identify the Trade Area from which Manning’s
drive times (Figure 3.1), commuting and
retail sales are most frequently and likely to be employment distribution patterns;
sourced and generated.
ii. Major infrastructure projects both planned
The Trade Area recognizes drive times, or under development which could affect
demographics, spending attributes and future travel patterns;
competition, which collectively portray the
iii. Overall Community development vision,
market to prospective tenants, developers and
including an understanding of key nodes’
investors. characteristics;
Identifying the Trade Area is important for iv. Local and regional competitive
understanding the total market potential environment, present and future;
available to current and future retailers. The
local and regional residential base has particular v. Proposed generative uses (retail, cultural,
demographic and spending habits that provide civic, etc.) and their relationship within the
insight as to the type of compatible retail tenants, wider market;
the amount of retail floor space supportable in
vi. Significant natural and man-made barriers
the market, and the current inflow or outflow of
(e.g. water features, highways and industrial
retail sales, and for which categories such inflow
areas);
or outflow exists.
vii. De facto barriers resulting from notable
As a first step, a Trade Area was delineated to socioeconomic differentiation;
identify the geographic region from which regular
patronage could be expected, based on a series of viii. Patterns of existing and future residential and
boundary determinants. commercial development; and
ix. Economic realities, such as provincial retail
Major considerations in defining a Retail Trade
sales taxes, if and where applicable.
Area were applied to the Town of Manning, as
the retail centrality to determine its most realistic
Trade Area, as well as to help sensitize potential
market share inputs of corresponding Trade Area
retail spending.
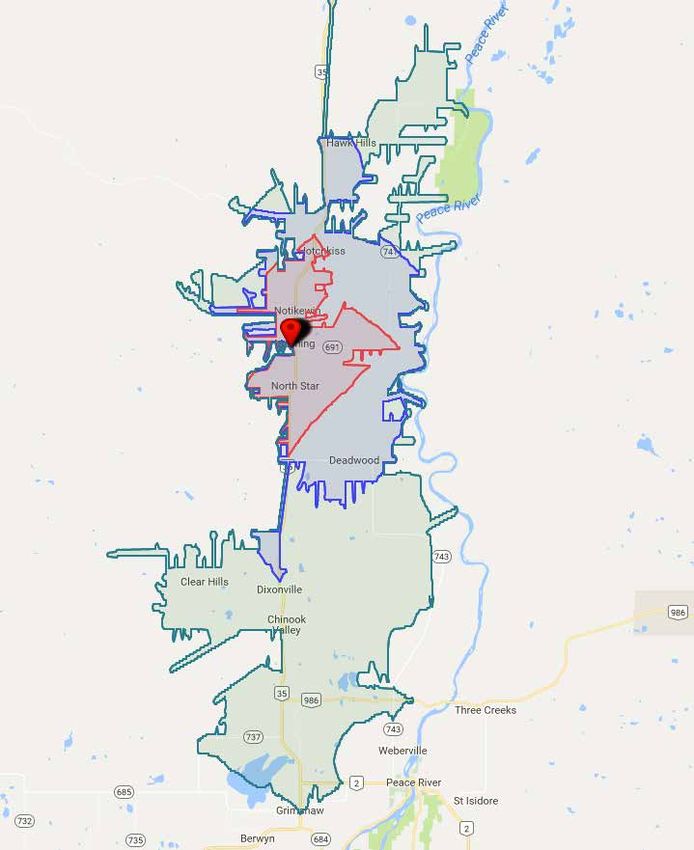
9 | Retail Market Analysis - Town of Manning & County of Northern Lights, AlbertaFigure 3.1
TOWN OF MANNING RETAIL TRADE AREA
Residential Population Density
1 dot = 100
Manning/County NL Trade Area
Manning/County NL Trade Area Paddle Prairie
Manning
Dixonville
Peace River
Grimshaw
Retail Market Analysis - Town of Manning & County of Northern Lights, Alberta | 103
For this particular study, the Retail Trade Area The Town of Manning’s most recent census data
shown in Figure 3.1 utilized a combination of from the February 2017 Statistics Canada release
drive times and competitive forces (e.g. Town of revealed an increasing population from 1,164 in
High Level, Hamlet of La Crete to the north and 2011 to 1,187 for 2017, representing an increase
Town of Peace River to the south). Although the of 2.0%. While other surrounding communities are
trade area is skewed in a north south orientation, suffering declining population, this net increase
the smaller hamlets of Paddle Prairie in the
in population although not significant provides a
north and Dixonville in the south would likely be
positive message for the Town of Manning.
drawn to High Level and Peace River respectively.
Residents of Paddle Prairie may also be drawn to
Utilizing a trade area approach as shown in
High Level, though the ferry and ice crossing are
factors in this decision-making. The single biggest Figure 3.1 and documented in Tables 3.1 to 3.4
draw to the south would be shopping in Peace provides a more accurate depiction of the Total
River given the approximate 60-minute drive time Trade Area for Manning’s retail environment
to the regional large format, Wal-Mart anchored rather than being solely dependent upon the
shopping node. smaller localized population base.
To that end, Tables 3.1 & 3.2 provide a
The resulting Trade Area for Manning comprises
a singular trade area, rather than having multiple breakdown of the Trade Area Population and
trade areas as would be common for a larger one that is much more appealing to the business
market. The rationale behind this is influenced by community.
the fact that Manning is located at overlap of two
The Total Trade Area population is estimated
larger trade areas (High Level and Peace River),
for 2017 to be almost 3,800. This population
which limits the extent of Manning’s resident
trade area, though it does not discount the nature is forecast to generally remain in and around
of passing motorists traveling along Hwy 35. that level over the foreseeable horizon and
approaching 4,000 by 2027.
The Trade Area includes the Town of Manning
and extends to the north to include Paddle Prairie Even if the trade area were to expand beyond the
(approx 60-minutes drive time) and approximately boundaries as shown in Figure 3.1, the impact
30-minutes drive time to south of the Hamlet of would not be significant and on that basis it is
Dixonville. more realistic for Manning to focus on its existing
trade area, but also harness its strategic location
3.2 along Hwy 35 to serve as an ideal pit stop for
POPULATION PROJECTIONS passing motorists and other target users drawn
Using data sources that include the most recent to the industrial components in Manning and
Statistics Canada Census release as well as Pitney elsewhere in the County.
Bowes (2017), population estimates and growth
forecasts were tabulated for each of the identified
Trade Areas.
11 | Retail Market Analysis - Town of Manning & County of Northern Lights, AlbertaTable 3.1
Town of Manning/County Northern Lights
TRADE AREA DEMOGRAPHIC SUMMARY
(Source: Pitney Bowes 2017 and Cushing Terrell Architecture Inc.)
Retail Trade Area Demographics & Spending
2017 Demographic Snapshot Manning/County NL Trade Manning (T), AB
Area
% %
2011 Census* 3,677 1,164
2017 Population estimate 3,788 1,187
2020 Population projection 3,833 1,198
% Population Change (2011-17) 3.0% 2.0%
% Population Change (2017-20) 1.2% 0.9%
2017 Population by Age 3,788 1,187
0 to 4 years 242 6% 83 7%
5 to 19 years 725 19% 214 18%
20 to 24 years 220 6% 83 7%
25 to 34 years 424 11% 190 16%
35 to 44 years 476 13% 154 13%
45 to 54 years 530 14% 119 10%
55 to 64 years 554 15% 131 11%
65 to 74 years 393 10% 119 10%
75 to 84 years 169 4% 71 6%
85 years and over 54 1% 47 4%
Median Age 41.2 37.4
2017 Families 1,163 330
Married couples 905 78% 231 70%
Without children at home 474 41% 118 36%
With children at home 432 37% 113 34%
Common-law couples 144 12% 58 18%
Without children at home 100 9% 36 11%
With children at home 44 4% 22 7%
Lone-parent families 114 10% 41 12%
Average Persons Per Family 2.8 2.8
Average Children Per Family 0.9 0.9
2017 Households 1,464 467
Persons per household 2.6 2.5
Average household income $ 84,317 $ 103,905
Median Estimated Household Income $ 60,321 $ 81,594
Retail Market Analysis - Town of Manning & County of Northern Lights, Alberta | 12Table 3.2
3 Town of Manning/County
TRADE AREA POPULATION PROJECTIONS SUMMARYNorthern
2011 TOLights
2027
(Source: Pitney Bowes 2017 and Cushing Terrell Architecture Inc.)
Retail Trade Area Demographics & Spending
2017 Estimates and Projections Manning/County NL Trade Manning (T), AB
Population Trends Area
Total Population
2011 Census* 3,677 1,164
2017 estimated 3,788 1,187
2020 projected 3,833 1,198
2022 projected 3,864 1,206
2027 projected 3,942 1,226
Change in Population (persons)
2011 to 2017 111 23
2017 to 2020 45 12
2020 to 2022 31 8
2022 to 2027 78 20
Change in Population (percent)
2011 to 2017 3.0% 2.0%
2017 to 2020 1.2% 1.0%
2020 to 2022 0.8% 0.6%
2022 to 2027 2.0% 1.6%
Rate of Change in Population
(percent per year)
2011 to 2017 0.5% 0.4%
2017 to 2020 0.4% 0.3%
2020 to 2022 0.4% 0.3%
2022 to 2027 0.4% 0.3%
* Population counts have been
adjusted by MapInfo for census
undercounts.
13 | Retail Market Analysis - Town of Manning & County of Northern Lights, AlbertaTable 3.3 Town of Manning/County Northern Lights
TRADE AREA POPULATION AGE BREAKDOWN
Retail
(Source: Pitney Bowes 2017 and Cushing Terrell Architecture Inc.) Trade Area Demographics & Spending
2017 Estimates and Projections Manning/County NL Trade Manning (T), AB
Population by Age and Sex Area
% %
2017 Estimated Population 3,788 % base 1,187 % base
0 to 4 years 227 6% 83 7%
5 to 9 years 265 7% 95 8%
10 to 14 years 227 6% 59 5%
15 to 19 years 227 6% 59 5%
20 to 24 years 227 6% 83 7%
25 to 29 years 227 6% 95 8%
30 to 34 years 227 6% 95 8%
35 to 39 years 227 6% 71 6%
40 to 44 years 265 7% 83 7%
45 to 49 years 227 6% 59 5%
50 to 54 years 303 8% 59 5%
55 to 59 years 265 7% 71 6%
60 to 64 years 265 7% 59 5%
65 to 69 years 189 5% 47 4%
70 to 74 years 189 5% 59 5%
75 to 79 years 114 3% 36 3%
80 to 84 years 76 2% 36 3%
85 years and over 38 1% 47 4%
Median Age 41.2 37.4
Dominant Age Group 50 to 54 25 to 29
Figure 3.2
TRADE AREA POPULATION AGE BREAKDOWN
(Source: Pitney Bowes 2017 and Cushing Terrell Architecture Inc.)
20%
18%
16%
14%
12%
10%
8%
6%
4%
2%
0%
0 to 14
15 to 24
years 25 to 34
years 35 to 44
years 45 to 54
years 55 to 64
years 65 to 74
years 74 + years
years
Retail Market Analysis - Town of Manning & County of Northern Lights, Alberta | 143
The Trade Area population growth dynamics Table 3.2 reveals that 30% of the Trade Area’s
for Manning do not exhibit strong projected population is currently over the age of 55 years.
growth, which suggests that focus should be on This age cohort does not represent an age
cohort that may not be the strongest spending
diligently attracting the types of retail that would
segment, though they are very supportive of local
benefit the community and target the latter businesses and local spending. They are not a
noted highway motorists. Similarly, efforts should particularly significant cohort when it comes to
be focused on trying to increase the existing restaurant spending, but they do support grocery
market penetration for sustaining existing and have a tendency to eat at home.
business vitality and for ensuring proper business
succession planning. 3.4
HOUSEHOLD INCOME PROFILE
As will be documented in the Demand Section, Household incomes are among the most direct
determinants in identifying patterns of spending
even if some small component of demand could
and potential thereof for retail, food & beverage,
be warranted, the alternative to demand is entertainment and services.
that individual businesses could garner higher
market share resulting in greater sales and thus A summary of the current average Household
business viability, rather than simply adding more Income in the Retail Trade Area as documented
space. For those very specific niche uses that in Table 3.4 and Figure 3.3, reveals an average
could fit, Manning has locations well suited to Household Income in 2017 estimated at just over
$84,000 in the Manning Trade Area. Although
accommodate them.
incomes are lower than the provincial average
of $122,000 (2017), the cost of living in Manning
The strategic Hwy 35 retail frontage that exists is much lower and thus the disposable income
today is strong, but could and should be further levels are likely very strong.
exploited as one of the key differentiators in the
region capable of not just slowing motorists, but Table 3.4 reveals that Average Household Income
stopping them. Highway motorists are creatures in the Trade Area is forecast to grow over the
of habit who tend to stay in their vehicles unless 5-year period 2017 to 2022, to an estimated
$93,000, in conjunction with an improving
the environment is convenient for them to stop;
provincial economy. Figure 3.3 illustrates that
Manning has this potential. approximately 32% of households have an
average Household Income of between $50,000
3.3 and $80,000.
AGE PROFILE
A summary of the current age profile, as Although the dominant income brackets are as
documented in Table 3.3 and Figure 3.2 reveal noted, there is a relatively large component of
a slightly older family profile. In total, the median the Total Trade Area (17%) that have an average
Household Income over $125,000. Thus, the
age is 41.2 years of age, with a dominant age
overall income profile represents overall economic
group of 50 to 54 years.
health and stability for retail opportunities.
15 | Retail Market Analysis - Town of Manning & County of Northern Lights, AlbertaTable 3.4 Town of Manning/County Northern Lights
TRADE AREA HOUSEHOLD INCOME BREAKDOWN
Retail
(Source: Pitney Bowes 2017 and Cushing Terrell TradeInc.)
Architecture Area Demographics & Spending
2017 Estimates and Projections Manning/County NL Manning (T), AB
Income Trends Trade Area
Average household income
2017 estimated $ 84,317 $ 103,905
2020 projected $ 89,477 $ 110,711
2022 projected $ 92,904 $ 115,284
Aggregate household income ($000)
2017 estimated $ 123,434 $ 48,524
2020 projected $ 130,508 $ 49,820
2022 projected $ 135,389 $ 50,609
Change in average
household income
2017 to 2020 $ 5,160 $ 6,806
2020 to 2022 $ 3,427 $ 4,573
Change in aggregate
household income ($000)
2017 to 2020 $ 7,074 $ 1,296
2020 to 2022 $ 4,881 $ 790
2017 Estimated Households % %
by Income 1,464 base 475 base
Under $5,000 28 2% 5 1%
$5,000 to 9,999 37 3% 10 2%
$10,000 to 14,999 58 4% 14 3%
$15,000 to 19,999 82 6% 14 3%
$20,000 to 29,999 124 9% 29 6%
$30,000 - 39,999 134 9% 33 7%
$40,000 - 49,999 141 10% 33 7%
$50,000 to 59,999 124 8% 33 7%
$60,000 - 79,999 193 13% 62 13%
$80,000 - 99,999 168 11% 71 15%
$100,000 - 124,999 136 9% 67 14%
$125,000 - 149,999 87 6% 43 9%
$150,000 - 174,999 52 4% 24 5%
$175,000 - 199,999 33 2% 14 3%
$200,000 - 249,999 25 2% 10 2%
$250,000 and over 42 3% 19 4%
Median Estimated
Household Income $ 60,321 $ 81,594
Note: The official Statistics Canada 2016 Median Income for the Town of Manning is listed as being $75,776. However, it
should be noted that per the Census Methodology, “for 2016, the reference period is the calendar year 2015 for all income
variables. Therefore, for the purposes of this analysis, the Pitney Bowes estimate forecasts for 2017 have been applied.
Retail Market Analysis - Town of Manning & County of Northern Lights, Alberta | 163
Figure 3.3
TRADE AREA HOUSEHOLD INCOME BREAKDOWN
(Source: Pitney Bowes 2017 and Cushing Terrell Architecture Inc.)
0.25
0.2
0.15
0.1
0.05
0
Under
$30,000 $30,000 to
$50,000 to
$50,000 $80,000 to
$80,000 $100,000 to
100,000 Over
$125,000
$125,000
3.5 Detailed information of retail spending within the
RETAIL SPENDING PROFILE Trade Area was collected from Pitney Bowes, a
leading supplier of demographic and consumer
Building upon the Trade Area demographic profile
expenditure information, using 2017 data. The
analysis, an assessment was made of the Trade
Area’s retail spending profile. This provides a more data was compiled into groups according to
refined understanding of the opportunity for where the respondent was from in order to build
retail within the Town of Manning. a spending profile for each respective Trade Area.
The key questions it seeks to answer are: Each of the major three categories of spending
• How much do Trade Area residents spend (Convenience, Comparison and Leisure) was
on Convenience retail (such as Grocery and assessed at a detailed category-by-category level
Pharmacy), on Comparison retail1 (such as then aggregated into major categories.
Fashion and Home Furnishings), and Leisure
Having established the Trade Area boundary,
(Food & Beverage and Entertainment)?
population and demographic profile, the size of
• What spending patterns or trends does the the retail market and its anticipated growth was
Trade Area expenditure profile demonstrate? projected using retail spending data from Pitney
And how is spending forecast to change over Bowes.
the coming years?
As illustrated in Table 3.5, the Total Trade Area
• What types of retail goods and services are is estimated at $36.5 Million (2017 year-end
garnering inflow of sales dollars and which estimate).
categories are exhibiting outflow of sales (or
leakage)?
17 | Retail Market Analysis - Town of Manning & County of Northern Lights, AlbertaTable 3.5
TRADE AREA RETAIL SPENDING 2017
(Source: Pitney Bowes 2017 and Cushing Terrell Architecture Inc.)
2017 ( estimate)
PTA
Retail Spending by Town of Manning (including
Merchandise Category Aggregate Town of Manning)
Retail Spending Aggregate
Retail Spending
Grocery & Specialty Foods $3,841,542 $8,366,760
Pharmacy $506,695 $1,220,976
Alcohol & Tobacco $1,065,694 $2,178,432
Personal Services $693,028 $1,589,904
Clothing & Apparel $1,127,805 $2,553,216
Footwear $293,743 $607,560
Jewelry & Accessories $166,719 $355,752
Health & Beauty $346,981 $708,576
Home Furnishings & Accessories $689,759 $1,436,184
Home Electronics & Appliances $1,046,547 $2,197,464
Home Improvement & Gardening $434,777 $1,118,496
Books & Multimedia $261,053 $541,680
Sporting Goods & Recreation $185,399 $382,104
Toys & Hobbies $183,998 $354,288
Miscellaneous Specialty $572,075 $1,115,568
Restaurant F&B $1,041,410 $2,160,864
Drinking Establishment $175,125 $402,600
Entertainment & Leisure $580,014 $1,168,272
Auto Parts & Accessories $327,367 $834,480
Auto/RV/Motorsports Dealership $2,540,947 $7,216,056
TOTAL RETAIL CATEGORIES ONLY $16,080,678 $36,509,232
$13 Figure 3.4
$14 $11
TRADE AREA RETAIL SPENDING SUMMARY 2017
Millions
(Source: Pitney Bowes 2017 and Cushing Terrell Architecture Inc.)
$12
$10 $8
$8
$6 $4
$4
$2
$0
Grocery & Conveniences Comparison Merchandise Restaurants & Auto/RV/
Entertainment Motorsports Parts and
Sales
Retail Market Analysis - Town of Manning & County of Northern Lights, Alberta | 183
Though relatively small, Manning’s retail core is As a comparison, recent studies for other
supported by its local market for conveniences Albertan communities such as the City of Grande
for which drive times are a factor, though the Prairie and City of Chestermere have Grocery &
opportunity to tap into passing motorists could
Conveniences spending share at 31% and 32%
be stronger.
respectively, while the spending on Restaurants &
The Town of Manning’s share of the Total Trade Entertainment are at 10% and 12% respectively.
Area spending is estimated at 44%. The overall
spending profile is healthy, though opportunities Regardless of where residents spend their money,
are somewhat limited because of slow growth, realizing that spending will occur in Grande
requiring an approach that should entail stronger Prairie, Peace River or High Level, the Top 5 retail
penetration of the existing market rather than spending categories for the Total Trade Area are:
focusing on new growth, just for growth’s sake.
1. Grocery & Specialty Foods - $8.4 Million
Figures 3.5 and 3.6 illustrate the retail spending
as summarized by the larger categorizations 2. Auto/RV/Motorsport - $7.2 Million
of Grocery & Conveniences, Comparison 3. Home Furnishings, Electronics and Appliances -
Merchandise (also know as Department Store $3.6 Million
Type Merchandise), Restaurants & Entertainment 4. Clothing & Apparel - $3.6 Million (including
and Auto/RV/Motorsports Parts and Sales. Footwear and Jewelry)
As shown in Figure 3.6 and as is more common in 5. Alcohol & Tobacco - $2.2 Million
rural or secondary markets, the share of spending
on Grocery and Conveniences (37%) is high
when compared to other segments,while the
spending on Restaurants & Entertainment (10%)
is comparable to other more urban markets, likely
because of the local Aurora Theatre.
Figure 3.5
Auto/RV/ TRADE AREA RETAIL SPENDING BY GENERAL CATEGORY
Motorsports Parts
and Sales
(Source: Pitney Bowes 2017 and Cushing Terrell Architecture Inc.)
22%
Grocery &
Conveniences
37%
Restaurants &
Entertainment
10%
Comparison
Merchandise
31%
19 | Retail Market Analysis - Town of Manning & County of Northern Lights, AlbertaPhoto courtesy of Cushing Terrell Architecture Inc.
Retail Market Analysis - Town of Manning & County of Northern Lights, Alberta | 204.0
retail supply
4.1 As documented in Tables 4.1 and 4.2 and Figure
INTRODUCTION 4.1 the Manning (and nearby County) retail
The dynamics of the overall retail market provide market has an estimated streetfront floor space
critical indicators as to the performance of the of approximately 173,237 sf. This floor space
retail and moreover the magnitude of demand is comprised of business types that range from
and resulting opportunity for which certain Grocery to Home Improvement, Restaurants,
market segments can be filled. Personal Services such as Salons as well as
Professional Services. When excluding businesses
This section will provide a detailed inventory that are not retail related but do occupy retail
of the tenants that comprise the current retail street front spaces, the total inventory is an
market for Manning which serves as the core estimated 132,665 sf.
centrality for retail in the County.
The inventory also distinguishes between
The purpose of the inventory evaluation is to Professional Medical, Finance/Insurance/
identify a foundation for demand and current Real Estate Services or other Non-Retail that
retail performance (also known as retail sales may occupy traditional street front spaces,
productivity) followed by identifying the potential but typically do not have a retail productivity.
types of tenants and/or merchandise categories Regardless, many of these uses even if not
for whom Manning could be compatible. traditional retail are essential to the lifeblood of
retail and are part of the overall market demand
4.2 analysis.
MANNING RETAIL MARKET
To document the retail inventory, Cushing Terrell Table 4.1
conducted on-the-ground fieldwork in which RETAIL MARKET SNAPSHOT
street front retail premises were documented in
terms of the retail store, merchandise category, TOTAL 173,237 sq. ft.
estimated unit size, vacancy as well as North TOTAL (Excluding Non-Retail Streetfront) 154,415 sq. ft.
American Industry Classification System (NAICS)
TOTAL RETAIL ONLY (Retail, Personal Services & F&B) 132,665 sq. ft.
code.
VACANT 3,000 sq. ft.
The inventory was categorized into the same
% VACANT
merchandise categories that were profiled in the 1.7%
(of ALL streetfront commercial space)
retail spending so that a direct comparison could
Retail Space Per Capita
be taken. In some cases where retail data was (against Trade Area Population 3,677)
36.1 sq.ft./capita
not available, store sizes were estimated using
leasing plans, brokerage websites, Geographic
Information Systems (GIS), and satellite mapping 4.3
measurements. RETAIL VACANCY
A review of the current vacancy and nature of the
vacancies provides additional cues for prospective
business interests in the community.
21 | Retail Market Analysis - Town of Manning & County of Northern Lights, AlbertaFigure 4.1
TOWN OF MANNING RETAIL INVENTORY BY CATEGORY
(Source: Cushing Terrell Architecture Inc.)
- 5,000 10,000 15,000 20,000 25,000
19,750
4,500
8,000
2,175
9,900
700
-
2,000
4,200
6,200
10,500
-
1,900
2,400
12,100
18,000
4,000
7,000
9,740
8,600
18,750
1,000
18,822
3,000
Retail Market Analysis - Town of Manning & County of Northern Lights, Alberta | 224
Table 4.2
TOWN OF MANNING RETAIL INVENTORY SUMMARY
Existing Existing
Merchandise Category Inventory (SF) Inventory (%)
Grocery & Specialty Foods 19,750 11.4%
Alcohol & Tobacco 4,500 2.6%
Pharmacy 8,000 4.6%
Personal Services 2,175 1.3%
Clothing & Apparel 9,900 5.7%
Footwear 700 0.4%
Jewelry & Accessories - 0.0%
Health & Beauty 2,000 1.2%
Home Electronics & Appliances 4,200 2.4%
Home Furnishings & Accessories 6,200 3.6%
Home Improvement & Gardening 10,500 6.1%
Books & Multi-Media - 0.0%
Sporting Goods & Outdoor Recreation 1,900 1.1%
Toys & Hobbies 2,400 1.4%
Specialty Retail 12,100 7.0%
Restaurant F&B 18,000 10.4%
Drinking Establishments 4,000 2.3%
Entertainment & Leisure 7,000 4.0%
Auto Parts & Accessories 9,740 5.6%
Auto/RV/Motorsports Dealership 8,600 5.0%
Finance/Insurance/Real Estate Services 18,750 10.8%
Professional Services 1,000 0.6%
NON-RETAIL Streetfront 18,822 10.9%
VACANT 3,000 1.7%
TOTAL 173,237 100.0%
23 | Retail Market Analysis - Town of Manning & County of Northern Lights, AlbertaYou can also read