Meat freshness revealed by visible to near-infrared spectroscopy and principal component analysis
←
→
Page content transcription
If your browser does not render page correctly, please read the page content below
Journal of Physics Communications

PAPER • OPEN ACCESS

Meat freshness revealed by visible to near-infrared spectroscopy and
principal component analysis
To cite this article: Motahareh Peyvasteh et al 2020 J. Phys. Commun. 4 095011

View the article online for updates and enhancements.

                              This content was downloaded from IP address 94.173.30.11 on 14/09/2020 at 10:56
J. Phys. Commun. 4 (2020) 095011                                                            https://doi.org/10.1088/2399-6528/abb322

                              PAPER

                              Meat freshness revealed by visible to near-infrared spectroscopy and
OPEN ACCESS
                              principal component analysis
RECEIVED
12 June 2020
                              Motahareh Peyvasteh1 , Alexey Popov2,6 , Alexander Bykov1                          and Igor Meglinski1,3,4,5,6
REVISED                       1
17 August 2020                    Opto-Electronics and Measurement Techniques, University of Oulu, PO Box 4500, 90014, Oulu, Finland
                              2
                                  VTT Technical Research Centre of Finland, 90590, Oulu, Finland
ACCEPTED FOR PUBLICATION      3
                                  Institute of Engineering Physics for Biomedicine (PhysBio), National Research Nuclear University ‘MEPhI’, 115409, Moscow, Russia
27 August 2020                4
                                  Interdisciplinary Laboratory of Biophotonics, National Research Tomsk State University, Tomsk, 634050, Russia
PUBLISHED                     5
                                  College of Engineering and Physical Sciences, Aston University, Birmingham, B4 7ET, United Kingdom
11 September 2020             6
                                  Authors to whom any correspondence should be addressed.
                              E-mail: alexey.popov@vtt.fi and i.meglinski@aston.ac.uk
Original content from this
work may be used under
                              Keywords: meat freshness, visible/NIR spectroscopy, absorption spectra, principal component analysis (PCA), probing depth, sampling
the terms of the Creative
Commons Attribution 4.0       volume, Monte Carlo simulation
licence.
Any further distribution of
this work must maintain
attribution to the            Abstract
author(s) and the title of    Increasing concerns about adulterated meat encouraged industry looking for new non-invasive
the work, journal citation
and DOI.                      methods for rapid accurate meat quality assessment. Main meat chromophores (myoglobin, oxy-
                              myoglobin, fat, water, collagen) are characterized by close comparable absorption in visible to near-
                              infrared (NIR) spectral region. Therefore, structural and compositional variations in meat may lead
                              to relative differences in the absorption of light. Utilizing typical fiber-optic probes and integrating
                              sphere, a degradation of pork samples freshness was observed at room temperature referring to the
                              relative changes in absorbance of main meat chromophores. The application of principal component
                              analysis (PCA) used for examination of measured absorbance spectra revealed more detailed sub-
                              stages of freshness, which are not observed by the conventional analysis of the reflectance spectra.
                              The results show a great potential of the combined application of optical-NIR spectroscopy with
                              complementary use of PCA approach for assessing meat quality and monitoring relative absorbance
                              alternation of oxymyoglobin and myoglobin in visible, and fat, water, collagen in NIR spectral ranges.

                              1. Introduction

                              In recent years, there has been an increasing demand for animal-based protein in the livestock sector and
                              specifically for pork as the most widely consumed type of meat in the world [1]. Along with this, annually spoiled
                              meat and meat products comprise considerable amount [2]. The increasing concerns about contaminated and
                              adulterated meat and the associated health risks have encouraged the meat industry to come up with a new non-
                              invasive method suitable for rapid and accurate meat quality assessment [3].
                                  Presently, there are a number of methods available for evaluation of various quantities of meat quality,
                              including chemical and microbiological analysis [3], ultrasound techniques, and microscopy approaches [4].
                              Compared to afore-mentioned techniques, photonics-based meat screening modalities are highly promising
                              because of their non-contact, fast, real-time, ability of online monitoring, economic and environment-friendly
                              features [5]. Infrared spectroscopy, Raman spectroscopy, Hyperspectral Imaging (HIS) and Fluorescence
                              spectroscopy are most frequently used optical techniques in meat quality assessment [4, 6–8]. In the current
                              study we utilize conventional optical/near-infrared (NIR) spectroscopy, that is used extensively for non-
                              invasive in vivo characterization of human skin and other biological tissues [9]. Typically, portable and cost-
                              effective light sources (e.g. tungsten lamps) and detectors (e.g. silicon diode arrays) are used in the visible and
                              NIR (750–1800 nm) spectral range [10, 11].
                                  At the consumer level meat quality and freshness can be defined in terms of tenderness, color, juiciness and
                              flavor. In a scientific context these parameters required to be classified as the chemical, microbiological, sensory

                              © 2020 The Author(s). Published by IOP Publishing Ltd
J. Phys. Commun. 4 (2020) 095011 M Peyvasteh et al
Table 1. Meat parameters assessed with different spectroscopic techniques.
Parameter Spectroscopy technique Type of meat References
Taste Near-infrared (NIR) Reflectance beef [18]
Color Visible Reflectance beef [19]
Fat NIR Transmittance ground beef [20]
pH Visible/NIR Reflectance beef [21]
Tenderness Visible/NIR Reflectance beef [22]
Moisture Visible/NIR pork [23]
Protein and dry content NIR Reflectance beef [24]
Texture NIR Reflectance beef [18]
Sensory characteristics NIR Reflectance beef [25]
Structural properties Visible and NIR Reflectance beef and lamb [22]
Spoilage parameters NIR pork [26]
Contamination Hyperspectral Imaging System Visible/NIR poultry [27]
and technological attributes [12]. In fact, the meat freshness can be assessed by various factors, such as the
presence of microorganisms, bacteria, and gases [13] considering the slaughter day of the animal and the period
of cooling/freezing [14].
The quality of meat products can be assessed by these following factors:
■ nutritional content including fat, protein, vitamins and minerals (mainly iron),
■ safety,
■ functional characteristics such as sensory properties of taste and appearance including color characteristics
and surface texture which can be traditionally assessed, both by consumers and experts [4, 14].
Lipid oxidation, protein degradation and the loss of other valuable molecules are the consequences of
freshness deterioration of meat during storage [2]. Temperature is another important parameter that influences
meat safety [15]. Specifically, for pork, the quality of fresh product varies greatly and is traditionally classified
into different categories based on color, a determining factor for customers to evaluate freshness [5, 10]. In the
visible region of spectra, the myoglobin (Mb)—a dominant chromophore—is primarily responsible for the
visual appearance of meat [16, 17].
The capabilities of the existing spectroscopic methods which have been applied to detect different meat
freshness identifiers are listed in table 1 [18–28].
Previous studies clearly show that NIR spectroscopy (800–2500 nm) is sensitive to the presence of fat (C–H),
water (O–H), and proteins (N–H) chemical bonds [29, 30]. Visible-light spectroscopy (400–800 nm) is widely
used for detecting color and collagen content, that is often performed with polarized light [4]. Therefore, it can
replace currently used the costly and time-consuming chemical analysis of meat composition and quality [5, 31].
Meat color is mainly referred to the amount of Mb that comprises several types:
■ Carboxymyoglobin (COMb) with a bright cherry-red color;
■ Oxymyoglobin (OxyMb) as a result of Oxygen reaction with Mb after exposure of fresh-cut meat to air within
30–60 min resulting in a cherry-red color typical for fresh meat found in shops;
■ Deoxymyoglobin (DeoxyMb) with a purplish-red color, a characteristic of recently sliced fresh meat;
■ Metmyoglobin (MetMb) appears brownish-red in color resulting from oxidation of the three other myoglobin
forms to a ferric state and is associated with meat discoloration [32, 33].
Pigments such as hemoglobin and cytochrome also contribute to meat color, but only to a lesser extent
compared to Mb. Furthermore, if an animal is slaughtered via cutting off the throat, then most of its blood is
naturally pumped out of the animal’s body, thus significantly, remaining blood contents will reduce. This
ensures higher quality of meat.
Keeping a raw pork sample at room temperature, as performed in the frame of the current study, the forms
of Mb interconvert and degrade through oxygenation, oxidation and reduction reactions, influencing the meat
color. The succeeding changes can be detected non-destructively and sensitively by analyzing reflectance within
the visible spectral range [16, 17].
2J. Phys. Commun. 4 (2020) 095011 M Peyvasteh et al
Figure 1. Optical density spectra of main chromophores of muscle tissues, including: (a) myoglobin, oxymyoglobin (400–700 nm);
(b) water, myoglobin, oxymyoglobin, collagen, fat (700–1100 nm); (c) water, collagen, fat (1100–2400 nm). Adapted from [45–47].
Table 2. Chromophores in various types of meat observed at different wavelengths with different spectroscopic-based methods.
Chromophores Type of meat Wavelength (nm) Method, References
chicken 970, 1908 Near infrared reflectance spectroscopy (NIRS), [29]
Water (O–H bonds) lamb 890 NIRS, [41]
ham 980, 1450 NIRS using a fiber optic probe, [34]
beef 970 NIRS, [11]
980 NIRS, [35]
1450, 1940 NIRS, [25]
760, 970, 1440 Time series hyperspectral imaging (TS-HIS), [36]
pork 960, 1440, 1450 NIRS, [37]
980, 1456 NIRS, [38]
Fat (C–H bonds) 902, 1052, 1378–1386, 1656, 1695 NIRS, [29]
880 NIRS, [39]
chicken 930, 1040 NIRS, [11]
1195 Time series hyperspectral imaging (TS-HSI), [36]
beef 1200 NIRS, [21]
1200, 1400 NIRS, [20]
1715, 1750 NIRS, [11]
Protein (N–H bonds) beef 1500 NIRS, [25]
lamb 540, 580 Visible spectroscopy, [5]
Myoglobin 1525 NIRS, [29]
chicken 425–550 NIRS, [40]
Deoxymyoglobin beef 430 Visible/NIR spectroscopy, [42]
530 Visible spectroscopy, [21]
chicken 540, 580 Visible spectroscopy, [5]
Metmyoglobin 475 Visible/NIR spectroscopy, [42]
beef 780 Visible spectroscopy, [21]
chicken 440–445, 485–500, 560 Visible/NIR spectroscopy, [43]
Oxymyoglobin lamb 424, 550 Visible/NIR spectroscopy, [44]
580 Visible spectroscopy, [5]
pork 540, 580 Visible spectroscopy, [5]
Sulfmyoglobin chicken 635 Visible/NIR spectroscopy, [42]
Table 2 presents the major meat chromophores, including water, fat, protein, Mb and its four forms, as well
as their referred absorbance wavelengths for various types of meat obtained with different spectroscopic-based
techniques [12–14, 26–41].
Figure 1 demonstrates optical density of main chromophores of muscle tissue including myoglobin,
oxymyoglobin, water, collagen and fat [45–47]. As one can see, in the visible part of spectrum (up to 900 nm) a
domination of absorption of oxy- and deoxy- myoglobin is observed (see figure 1(a)), whereas in the NIR range
(950–1050 nm) water becomes the most prominent contributor (see figure 1(b)). While, in the NIR part of
spectrum (1050–1100 nm, see figure 1(b) and 1300–1650 nm, see figure 1(c)) the spectra of water, fat and
collagen are comparable. Therefore, in these parts of the spectrum, the structural and compositional variations
within these natural compounds lead to relative changes.
In current paper, we consider if the relative spectral changes of absorbance in visible and NIR parts of the
spectrum, measured by typical fiber-optic probes or an integrating sphere, can be associated with the freshness
stages of meat samples. As a complementary analysis, we applied principal component analysis (PCA) method
3J. Phys. Commun. 4 (2020) 095011 M Peyvasteh et al
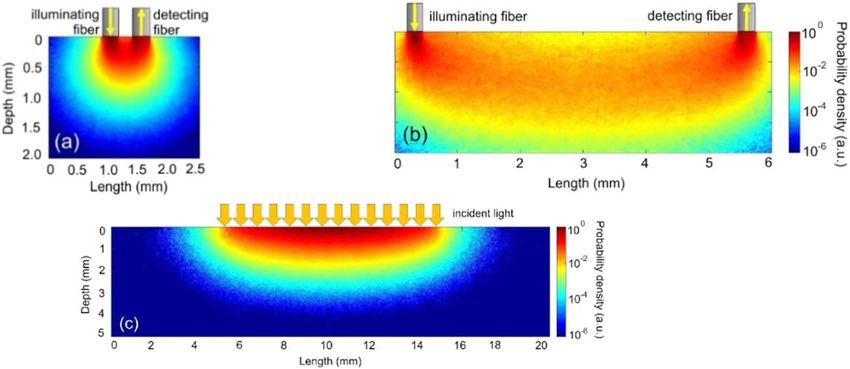
Figure 2. Schematic presentation of the experimental setup with an integrating sphere and a closer view of multiple reflections effects
occurring in the integrating sphere (a) and an array of optical fibers, shown in a closer view in contact with the meat sample as well as
banana-shape trajectories of photons emitted by 1st fiber and collected by 11-th fiber and a schematic of the fibers distance (b).
[48] on the absorbance dataset to find sub-stages of freshness decay which might be not revealed in spectroscopic
analysis. In brief, the novelty of this work includes the type of sample, which is unprocessed, the storage
condition during the measurements (at room temperature) and the short time duration of the measurements
(on average 6 h) to investigate early changes in absorbance spectra of different chromophores.
2. Materials and methods
2.1. Spectroscopic setup
Two different detecting configurations capable to sense meat samples with different probing depths are
utilized. In the first (table-top) configuration the OL 400-LCS lamp source (Optronic Laboratories, USA), a
monochromator (OL series 750-M), an integrating sphere reflectance attachment (OL 740-70), highly sensitive
detectors (OL series 750) and a controller (OL 750-C) connected to a computer, as shown in figure 2(a), are used.
The detectors operated within two wavelength ranges: 400–1100 nm (Si detector) and 1100–1800 nm (Ge
detector). The attached integrating sphere enables acquisition of scattered light from the sample through
measuring spectral diffuse reflectance over a very broad wavelength region (200–2500 nm) (see the closeup view
in figure 2(a)) to properly account for sample absorption. The inner material of the integrating sphere is PTFE,
with high (99%) reflectance all over the wavelength range used in the experiments. The spot of light on the
surface of the meat sample provided by this setup was 10 mm in diameter.
In another configuration, presented in figure 2(b), a standard portable spectrophotometer operated within
the 400–1100 nm spectral range, is utilized. The spectrophotometer is equipped with a fiber- optic probe (for
illumination and detection of light) Since the distance between the centers of the fibers is 530 μm, the distance
between the 1st (illuminating) and 11th (collecting) fiber would be 5.3 mm while the minimal source-detector
fiber separation is 0.53 mm (see the closeup view in figure 2(b)). This experimental setup comprises a light
source Illuminator EK-1 Fiber Optic Light Source LE.5210-110 (EUROMEX, The Netherlands) with a halogen
lamp and a compact CCS200 spectrometer (Thorlabs, USA), both connected to the fiber-optic probe.
For each configuration, porcine muscle meat samples were purchased from the local supermarkets on the
first day after butchery. Three samples for visible and two samples for NIR spectra with integrating sphere
configuration and thirteen samples with optical fibers configuration for each measurement were placed in a
plastic Petri dish (5 cm in diameter, 1 cm high) with a rectangular hole to provide direct access of light to the
sample. For all of the measurements, the samples were covered by plastic foil in order to delay moisture
4J. Phys. Commun. 4 (2020) 095011 M Peyvasteh et al
Table 3. Optical properties of meat (muscle tissue).
λ, nm μa, mm−1 μs, mm−1 g n
632.8 0.059 17.9 0.858 1.381
evaporation from the surface and prevent drying. Humidity in the laboratory room was controlled (at 80% level)
and remained constant during all the measurements. Controlling relative humidity of the air during meat
aging process needed to be controlled since high humidity will ease the spoilage bacteria growth and cause an
unpleasant sticky surface while low humidity restricts bacterial growth but increases water evaporation causing
dryness and less juiciness of meat. However, since in this work, we are measuring the early stages of meat loss of
freshness for a small area of the sample and evaporation of water from the sample surface was suppressed by
covering the meat surface with plastic films, the small changes of humidity cannot affect the results strongly [49].
By adjustment of the integration time and calibration, reflectance spectra (R) were obtained and converted
()
1
to absorbance spectra A = log R [20]. The reflectance spectra were recorded every half an hour during on
average six hours at room temperature (23 °C). The Savitzky–Golay fitting algorithm was applied to remove
random variations in the measured spectra. This technique clearly improves the visual appearance of the spectra
[50]. Finally, the area between isosbestic points within the absorption bands responsible for the associated meat
chromophores has been integrated and termed as ‘integrated absorbance’ and then, plotted their values over
time. Eventually, we introduced a new term called ‘degradation kinetics’ for each of the meat chromophores,
defined by the dependence of the ‘integrated absorbance’ over time to track their changes during freshness
decay.
2.2. Monte Carlo simulations
Monte Carlo (MC) simulations are a well-established and effective approach to model light propagation in
turbid media such as biological tissues [51] which can keep the track of photon transportation [52]. MC
simulation consists of a sequential generation of trajectories of so-called photon packets from the source (the
entrance to the medium) to the detector (the area where the photon leaves the medium [53].
Here, we used a free online simulation platform [54] implementing the MC method to estimate a sampling
volume [53, 55] and a probing depth in each measurement configuration. The optical parameters used in the
simulations corresponded to muscle tissue at 632.8 nm [52, 56] (for the illustrative purpose) are shown in table 3
[57]. Although the specific light distribution pattern depends on the wavelength, qualitatively the discussed
difference between the configurations (integrating sphere and fiber-optic) will remain.
The integrating sphere configuration comprised a collimated light beam (size: 10 mm) normally incident on
a rectangular meat sample (20×20×5 mm3). Light reflected from the sample (from the surface and deeper
regions) was collected from all directions within a 20 mm size area coincident with the incident beam. The fiber-
optic configuration (see figure 2(b), inset) with 300 μm source and detecting fibers for two separation distances
was also simulated. In this configuration, the sample size was either 2.5×2×2 mm3 (source-detector
distance: 0.53 mm) or 6×2×2 mm3 (source-detector distance: 5.3 mm).
2.3. Principal component analysis (PCA)
To identify the most important directions of variability in a multivariate data matrix and to present the results in
a graphical plot, multivariate statistical methods such as principal component analysis (PCA) can be applied
[48]. Principal Components Analysis (PCA) is a data analysis tool which is mostly used to reduce the
dimensionality (number of variables) of many interrelated variables, while retaining as much of the information
(variation) as possible [58]. The calculated factors or pc’s that are an uncorrelated set of variables are ordered in a
way that the first few keep most of the variation present in all of the original variables.
There are a wide variety of PCA applications in different fields to classify large scattered datasets. Specifically,
it has been an effective promising method utilized in meat quality assessment [58–64] such as beef
characterization [48], Classification of Beef and Pork Aroma [59], classification of hairtail fish and pork
freshness [60] or freshness assessment of cooked beef during storage [61]. Here, we performed PCA on the whole
processed and smoothed absorbance dataset for each measurement time points for both configurations to detect
and discriminate sub-stages of freshness levels correlated to chromophores changes over time which might be
not recognizable in spectroscopic analysis.
5J. Phys. Commun. 4 (2020) 095011 M Peyvasteh et al
Figure 3. Absorbance spectra in the pork sample measured in the integrating sphere configuration (a)–(c) at 0 (solid), 4 (dash) and
6 (dot) hours after keeping the sample at room temperature (23 °C). The absorbance peaks indicate presence of (a) oxymyoglobin
(540 nm and 570 nm, (b) fat (1200 nm, and (c) water (1450 nm) and proteins (1525 nm) [10, 29, 47]. Degradation kinetics of
(d) oxymyoglobin, (e) fat and (f) water (1450; square/black) and proteins (1520 nm; circle/red) measured in the integrating sphere
configuration. The dashed vertical lines in (e) and (f) indicate the transition time between the fresh and non-fresh pork sample.
3. Results and discussion
3.1. Spectroscopic measurements
The absorbance spectra showed main peaks associated with different meat chromophores (oxymyoglobin,
water, fat, and protein) in the pork samples and furthermore, the height decrease of those curves related to later
times of measurement was easily observable. In addition, there was a noticeable decrease of the magnitudes of
absorbance in both visible and NIR spectral regions caused by changes in the chemical composition in pork
during freshness decay.
Figure 3 shows absorbance spectra for the integrating sphere configuration over 6 h. The curves refer to
data obtained 0 (solid), 3 (dash), and 6 (dot) hours after keeping the sample at room temperature. The local
absorbance peaks in the visible range (see figure 3(a)) at around 540 nm and 575 nm wavelengths are attributed
to oxymyoglobin content in the sample responsible for the meat color [40]. In the NIR region (see figures 3(b)
and (c)) the main peaks in the absorbance spectra appear between 1100 nm and 1600. The peak around 1200 nm
in figure 3(b) arises from the second overtone of C–H stretching vibrations associated mainly with fat in the
samples [10]. The absorbance peak around 1450 nm (see figure 3(c)) is related to the first O–H overtone that
arises from water and water-bonded groups [10]. These results indicate that water is the major domain
component, which affects the mean spectrum of the pork samples. The local peak around 1525 nm (see
figure 3(c)) is attributed to the N–H bond that arises from protein content [29].
Then, we integrated the area between isosbestic points under the absorbance spectra (termed ‘integrated
absorbance’) within absorption bands responsible for the associated meat chromophores: oxymyoglobin
(515–600 nm for the integrating sphere setup), fat (1175–1290 nm), water (1414–1490 nm), proteins
(1490–1567 nm) and plotted them over time. Eventually, we introduced a new term called ‘degradation kinetics’
for each of the meat chromophores, defined by the dependence of the ‘integrated absorbance’ over time.
Decrease of the absorbance caused by water loss and degradation of oxymyoglobin affects negatively sample
freshness. Changes of absorbance over time for the integrating sphere configuration are shown in the visible (see
figure 3(d)) and NIR (see figures 3(e) and(f)) spectral ranges for the indicated specific wavelengths attributed to
the meat components. It was observed that for the both visible and NIR spectral regions, integrated absorbance
for different wavelengths experienced a decreasing trend showing meat chromophores degradation, which
could affect pork freshness [5, 10]. Specifically, degradation of oxymyoglobin indicating color changes started
from the beginning (see figure 3(d)), while in the NIR region (see figures 3(e) and (f)), integrated absorbance
decreased slower starting from approximately 2.5 h, that could be interpreted as a beginning stage of freshness
deterioration process. As we can see in figure 3(e), the integrated absorbance for fat did not show a sharp
6J. Phys. Commun. 4 (2020) 095011 M Peyvasteh et al
Figure 4. (a) Evolution of absorbance spectra in a pork sample measured in the fiber-optic configuration at 0 (solid), 3 (dash), and
6 (dot) hours after keeping the sample at room temperature (23 °C). The 540 nm and 575 nm absorbance peaks indicate presence of
oxymyoglobin. The shadowed area was used for calculating integrated absorbance and (b) Kinetics of oxymyoglobin degradation. The
dashed vertical line in (b) indicates the transition time between the fresh and non-fresh pork sample.
reduction in contrast to the water and proteins curves. This is caused by fat degradation occurring at a slower
rate than these other considered components.
Similar experiments were performed in the fiber-optic configuration. Figure 4(a) shows significant peaks
associated with oxymyoglobin absorbance measured at three different time points (0, 3, and 6 h after keeping the
sample at room temperature) and the integrated absorbance selected region within 527–587 nm.
The decreasing trend for the integrated absorbance over time was detectable in this case as well (see
figure 4(b)), although the data points deviated more from the fitting curve and the drop in the absorbance
happened after about 4.5 h. Comparison of the curves in figures 3(d) and 4(b) (both referred to oxymyoglobin
changes over time) reveals the difference between the decreasing trends. Since the pork samples were covered
with a plastic film from all sides and were under stable and similar physiological conditions, we assume that in
both configurations freshness decay started at about the same time. The explanation of the observed discrepancy
is elucidated further on.
3.2. Monte Carlo simulations
MC simulations were capable to elucidate the reasons of different degradation kinetics of oxymyoglobin and
other chromophores. The difference between the two setups from optical point of view is the sensing depth: in
the case of the integrating sphere setup, it was shallower due to higher contribution of the surface and subsurface
reflected photons. In the second (fiber-optic) configuration, the probing depth was managed through changing
the source-detector separation, i.e. by choosing the proper detecting fiber (since the illuminating fiber was kept
the same). Results of the MC simulations (figure 5) illustrate this aspect. These results clarify the difference
observed in figures 3(d) and 4(b). Despite detecting the same substance (oxymyoglobin), the indicated plots
showed completely different trends: in the case of integrating sphere (see figure 3(d)), the degradation happened
immediately from the beginning, while in the case of fiber-optic setup (see figure 4(b)) the degradation was
significantly (4.5 h) delayed. Therefore, the delay was caused by larger depths achieved by detected photons in
the latter case.
3.3. Principal component analysis (PCA)
Multivariate statistical analysis is frequently applied to spectral data due to its potential to deal with large
complex co-linear information, reducing this original data to a lower dimension without overlooking useful
information. Thus, PCA was applied to the processed and smoothed absorbance dataset obtained from the
samples to correlate scattering alignments of data respect to each component axis with different freshness stages
of meat.
Figure 6 displays the corresponding scores plot of the raw pork samples and their spectra measured with two
configurations and different spectral ranges (Vis/NIR) for the first and the second principal components.
Figure 6(a) shows the scores plot of the visible spectra measured with the integrating sphere (see figure 3(a)) with
86.4% and 9.3% of the total variance in the dataset. Four distinct separations can be observed to classify different
level of freshness according to PC 1 and PC 2. PC 1 makes the clear distinction between stages of freshness with
negative values for fresh sample and positive values for non-fresh sample. Furthermore, PC 2 provides
information about aging and spoilage revealing the separation between the fresh sample (0 h; green) and the
non-fresh sample (5.5 h and 6 h; red cluster). Clearly, compared to the simply spectral analysis (see figure 3(d)),
7J. Phys. Commun. 4 (2020) 095011 M Peyvasteh et al
Figure 5. Spatial distributions of the optical detected signal in the pork sample (a), (b) for the fiber-optic and (c) the integrating sphere
configurations assessed by MC simulations. The distance between the illuminating and the detecting fibers is 0.53 mm (a) and
5.3 mm (b).
Figure 6. Representation of the score plots of PCA conducted on the spectral data for a pork sample measured with the integrating
sphere configuration in visible (a) and NIR range (b), and with the fiber-optic configuration in visible range (c) which in each of them,
the clustered represented as: fresh (green/solid cluster), less fresh (yellow/dash cluster), almost non-fresh (orange/dash dot cluster)
and non-fresh (red/dot cluster).
PCA method provides complementary information and distinguishes the level of freshness between totally fresh
sample in the beginning of the measurement (0 h; green) and less fresh sample (0.5 h–2 h; yellow cluster) in
addition to another classification between 2.5 h–5 h (orange cluster) and 5.5 h–6 h (red cluster) for non-fresh
sample.
For of the NIR spectra measured with the integrating sphere (see figure 6(b)), the first three principal
components were responsible for 98.7% of variability of the data; the first, second and third principal
components variability were 72.6%, 23.1% and 3%, respectively. Similar to visible spectra, PC 1 is the separator
reference axis with negative values for fresh sample and positive value for non-fresh sample. According to the
plot, the transition to non-fresh stage happens after 3.5 h which is the same as spectral analysis for fat absorption
(see figure 3(e)), while for water and protein, spectral changes are detected earlier and after around 2.5 h (see
figure 3(f)). The stages of freshness have been divided as the following:
■ 0 h–1 h; fresh (green/solid cluster);
■ 1.5 h–3.5 h; less fresh (yellow/dash luster);
■ 4 h–4.5 h; almost non-fresh (orange/dash dot cluster);
■ 5 h–8 h; totally non-fresh (red/dot cluster).
Figure 6(c) shows the scores plot for of the visible spectra measured with the optical fibers configuration (see
figure 4(b)) with 47.9% and 16.8% of the total variance in the dataset which clearly caused by more scattered data
compared to two previous spectra and therefore, leads to difficulty in distinction between freshness sub-stages.
8J. Phys. Commun. 4 (2020) 095011 M Peyvasteh et al
Here again, classification between stages of freshness is defined by PC 1 with negative values correlated to fresh
sample (green cluster) and positive values for less fresh and non-fresh samples (orange and red clusters). But
similar to spectral analysis in figure 4(b), the beginning of decay happens after 4.5 h although the presence of data
referred to 3.5 h and 4 h in red cluster is questionable.
Briefly, for all the measurements in both visible and NIR ranges, discrimination between fresh and non-fresh
pork samples is clearly observed according to the changes in absorbance of different chromophores through
using PC method applied to the absorbance spectra. The PCA results presented here are just based on the
experimental data but as the next stage of the work, simulation will be added [8, 61, 65–67].
4. Conclusion
The study presents a methodology to detect earlier stages of pork freshness loss at room temperature with the
aim of decreasing the costs of meat quality monitoring. According to the obtained results, it is possible to observe
the decreasing trend in the light absorbance for different pork chromophores in both visible and NIR spectral
ranges showing loss of freshness over time. The compact fiber-optic linear array allows for retrieval of freshness
decay depth simply by changing the detecting fiber (keeping the illuminating fiber the same). We believe this
configuration can serve as a future base for development of a portable low-cost meat freshness sensor. The PCA
method was used as a complementary analysis tool to classify the different stages of freshness and it succeeded to
reveal sub-stages, which were not detectable by conventional reflectance spectroscopy. Further research with
other types of meat of different age could help to build a comprehensive model of meat and its composition
depending on freshness.
Acknowledgments
This work received funding from the I4FUTURE, European Union’s Horizon 2020 research and innovation
program under the Marie Sklodowska-Curie (grant agreement No 713606) and partially from the Academy of
Finland (grants: 314369, 325097), the ATTRACT project funded by the EC under Grant Agreement 777222,
MEPhI Academic Excellence Project (Contract No. 02.a03.21.0005), and National Research Tomsk State
University Academic D.I. Mendeleev Fund Program.
Disclosures
The authors declare no conflicts of interest.
ORCID iDs
Motahareh Peyvasteh https://orcid.org/0000-0001-7543-8320
Alexey Popov https://orcid.org/0000-0002-1417-6715
Alexander Bykov https://orcid.org/0000-0002-6228-6775
Igor Meglinski https://orcid.org/0000-0002-7613-8191
References
[1] WHO/FAO 2003 Diet, Nutrition and the Prevention of Chronic Diseases 916 1–148
[2] Dave D and Ghaly A E 2011 Meat spoilage mechanisms and preservation techniques: a critical review Am. J. Agri. Biol. Sci. 6 486–510
[3] Kamruzzaman M, Makino Y and Oshita S 2015 Non-invasive analytical technology for the detection of contamination, adulteration,
and authenticity of meat, poultry, and fish: a review Anal. Chim. Acta 853 19–29
[4] Damez J L and Clerjon S 2008 Meat quality assessment using biophysical methods related to meat structure Meat Sci. 80 132–49
[5] Alander J T, Bochko V, Martinkauppi B, Saranwong S and Mantere T 2013 A review of optical nondestructive visual and near-infrared
methods for food quality and safety Int. J. Spectrosc. 2013 1–36
[6] Furtado E J G et al 2019 Prediction of pH and color in pork meat using VIS-NIR near-infrared spectroscopy (NIRS) Food Sci. Technol.
39 88–92
[7] Kandpal L M, Lee J, Bae J, Lohumi S and Cho B K 2019 Development of a low-cost multi-waveband LED illumination imaging
technique for rapid evaluation of fresh meat quality Appl. Sci. 9 912
[8] Xu Y, Chen Q, Liu Y, Sun X, Huang Q, Ouyang Q and Zhao J 2018 A novel hyperspectral microscopic imaging system for evaluating
fresh degree of pork Korean J. Food Sci. An 38 362–75
[9] Matcher S J 2016 Signal quantification and localization in tissue near-infrared spectroscopy Handbook of Optical Biomedical Diagnostics
ed V V Tuchin (Bellingham, Washington: SPIE PRESS) p 1410
[10] ElMasry G and Nakauchi S 2016 Prediction of meat spectral patterns based on optical properties and concentrations of the major
constituents Food Sci. Nutr. 4 269–83
9J. Phys. Commun. 4 (2020) 095011 M Peyvasteh et al
[11] Grau Meló R, Sánchez Salmerón A J, Girón Hernández L J, Ivorra Martínez E, Fuentes López A and Barat Baviera J 2010 Non-
destructive assessment of freshness in packaged sliced chicken breasts using SW-NIR spectroscopy Food Res. Int. 44 331–7
[12] Johnson J, Atkin D, Lee K, Sell M and Chandra S 2019 Determining meat freshness using electrochemistry: are we ready for the fast and
furious? Meat Sci. 150 40–6
[13] Eom K H, Hyun K H, Lin S and Kim J W 2014 The meat freshness monitoring system using the smart RFID tag Int. J. Distrib. Sens.
Netw. 10 1–9
[14] Mladenov M, Penchev S and Deyanov M 2014 Optical methods for food quality and safety assessment—a review ICCST, 1 44–56
[15] Nychas G J E, Skandamis P N, Tassou C C and Koutsoumanis K P 2008 Meat spoilage during distribution Meat Sci. 78 77–89
[16] Liu Y and Chen Y R 2001 Analysis of visible reflectance spectra of stored, cooked and diseased chicken meats Meat Sci. 58 395–401
[17] Mancini R A and Hunt M C 2005 Current research in meat color Meat Sci. 71 100–21
[18] Byrne C E, Downey G, Troy D J and Buckley D J 1998 Non-destructive prediction of selected quality attributes of beef by near-infrared
reflectance spectroscopy between 750 and 1098 nm Meat Sci. 49 399–409
[19] van den Oord A H A and Wesdorp J J 1971 Colour rating and pigment composition of beef: relation between colour measurement by
reflectance spectrophotometry, subjective colour evaluation, and the relative concentration of oxymyoglobin and ferric myoglobin in
chilled retail-packed beef Int. J. Food Sci. Tech. 6 15–20
[20] Sierra V, Aldai N, Castro P, Osoro K, Coto-Montes A and Oliván M 2008 Prediction of the fatty acid composition of beef by near
infrared transmittance spectroscopy Meat Sci. 78 248–55
[21] Andrés S, Silva A, Soares-Pereira A L, Martins C, Bruno-Soares A M and Murray I 2008 The use of visible and near infrared reflectance
spectroscopy to predict beef M. longissimus thoracis et lumborum quality attributes Meat Sci. 78 217–24
[22] Shackelford S D, Wheeler T L and Koohmaraie M 2005 On-line classification of US Select beef carcasses for longissimus tenderness
using visible and near-infrared reflectance spectroscopy Meat Sci. 69 409–15
[23] Chan D E, Walker P N and Mills E W 2002 Prediction of pork quality characteristics using visible and near-infrared spectroscopy
T. ASAE 45 1519
[24] Prieto N, Andrés S, Giráldez F J, Mantecón A R and Lavín P 2006 Potential use of near infrared reflectance spectroscopy (NIRS) for the
estimation of chemical composition of oxen meat samples Meat Sci. 74 487–96
[25] Prieto N, Ross D W, Navajas E A, Nute G R, Richardson R I, Hyslop J J, Simm G and Roehe R 2009 On-line application of visible and
near infrared reflectance spectroscopy to predict chemical-physical and sensory characteristics of beef quality Meat Sci. 83 96–103
[26] Horváth K, Seregély Z, Andrássy É, Dalmadi I and Farkas J 2008 A preliminary study using near infrared spectroscopy to evaluate
freshness and detect spoilage in sliced pork meat Acta Aliment. 37 93–102
[27] Windham W R, Smith D P, Park B, Lawrence K C and Feldner P W 2003 Algorithm development with visible/near-infrared spectra for
detection of poultry feces and ingesta T. ASABE 46 1733–8
[28] Downey G and Beauchêne D 1997 Discrimination between fresh and frozen-then-thawed beef m. longissimus dorsi by combined
visible-near infrared reflectance spectroscopy: a feasibility study Meat Sci. 45 353–63
[29] Barbin D F, Kaminishikawahara C M, Soares A L, Mizubuti I Y, Grespan M, Shimokomaki M and Hirooka E Y 2015 Prediction of
chicken quality attributes by near infrared spectroscopy Food Chem. 168 554–60
[30] Cen H and He Y 2007 Theory and application of near infrared reflectance spectroscopy in determination of food quality Trends Food
Sci. Technol. 18 72–83
[31] Prevolnik M, Čandek-Potokar M and Škorjanc D 2004 Ability of NIR spectroscopy to predict meat chemical composition and
quality—a review Czech J. Anim. Sci. 49 500–10
[32] Chao K, Liu Y, Chen Y R, Thayer D W and Hruschka W R 2002 Characterization of spectral variations of irradiated chicken breasts with
2D-correlation spectroscopy Appl. Eng. Agric. 18 745–50
[33] Suman S P and Joseph P 2013 Myoglobin chemistry and meat color Annu. Rev. Food Sci. T. 4 79–99
[34] García-Rey R M, García-Olmo J, De Pedro E, Quiles-Zafra R and Luque De Castro M D 2005 Prediction of texture and colour of dry-
cured ham by visible and near infrared spectroscopy using a fiber optic probe Meat Sci. 70 357–63
[35] Cozzolino D, Mattos D D and Martins D V 2002 Visible/near infrared reflectance spectroscopy for predicting composition and tracing
system of production of beef muscle Anim. Sci. 74 477–84
[36] Wu D, Wang S, Wang N, Nie P, He Y, Sun D W and Yao J 2013 Application of time series hyperspectral imaging (TS-HSI) for
determining water distribution within beef and spectral kinetic analysis during dehydration Food Bioprocess Technol. 6 2943–58
[37] Hoving-Bolink A H, Vedder H W, Merks J W M, De Klein W J H, Reimert H G M, Frankhuizen R, Van Den Broek W H A M and
Lambooij E 2005 Perspective of NIRS measurements early post mortem for prediction of pork quality Meat Sci. 69 417–23
[38] Cozzolino D, Barlocco N, Vadell A, Ballesteros F and Gallieta G 2003 The use of visible and near-infrared reflectance spectroscopy to
predict colour on both intact and homogenised pork muscle LWT - Food Sci. Technol 36 195–202
[39] Huang H, Liu L and Ngadi M O 2014 Recent developments in hyperspectral imaging for assessment of food quality and safety J. Sens. 14
7248–76
[40] Ripoll G, Albertí P, Panea B, Olleta J L and Sañudo C 2008 Near-infrared reflectance spectroscopy for predicting chemical,
instrumental and sensory quality of beef Meat Sci. 80 697–702
[41] Andrés S, Murray I, Navajas E A, Fisher A V, Lambe N R and Bünger L 2007 Prediction of sensory characteristics of lamb meat samples
by near infrared reflectance spectroscopy Meat Sci. 76 509–16
[42] Liu Y, Lyon B G, Windham W R, Realini C E, Pringle T D D and Duckett S 2003 Prediction of color, texture, and sensory characteristics
of beef steaks by visible and near infrared reflectance spectroscopy. A feasibility study Meat Sci. 65 1107–15
[43] Liu Y, Barton F E, Lyon B G, Windham W R and Lyon C E 2004 Two-dimensional correlation analysis of visible/near-infrared spectral
intensity variations of chicken breasts with various chilled and frozen storages J. Agric. Food Chem. 52 505–10
[44] Cozzolino D, Murray I, Scaife J R and Paterson R 2000 Study of dissected lamb muscles by visible and near infrared reflectance
spectroscopy for composition assessment Anim. Sci. 70 417–23
[45] Alfano R and Lingyan S 2018 Evolution of the Supercontinuum Light Source 52 76–81
[46] Sekar S K V, Bargigia I, Mora A D, Taroni P, Ruggeri A, Tosi A, Pifferi A and Farina A 2017 Diffuse optical characterization of collagen
absorption from 500 to 1700 nm J. Biomed. Opt. 22 15006
[47] Tang J, Faustman C and Hoagland T A 2004 Krzywicki revisited: equations for spectrophotometric determination of myoglobin redox
forms in aqueous meat extracts J. Food Sci. 69 C717–20
[48] Destefanis G, Barge M T, Brugiapaglia A and Tassone S 2000 The use of principal component analysis (PCA) to characterize beef Meat
Sci. 56 255–9
[49] Dashdorj D, Tripathi V K, Cho S, Kim Y and Hwang I 2016 Dry aging of beef; review J. Anim. Sci. Technol. 58 1–11
10J. Phys. Commun. 4 (2020) 095011 M Peyvasteh et al
[50] Nicolaï B M, Beullens K, Bobelyn E, Peirs A, Saeys W, Theron K I and Lammertyn J 2007 Nondestructive measurement of fruit and
vegetable quality by means of NIR spectroscopy: a review Postharvest Biol. Technol. 46 99–118
[51] Wangpraseurt D, Jacques S L, Petrie T and Kühl M 2016 Monte Carlo modeling of photon propagation reveals highly scattering coral
tissue Front. Plant Sci. 7 1–10
[52] Meglinski I and Matcher S J 2000 The application of the Monte Carlo technique for estimation of the detector depth sensitivity for the
skin oxygenation measurements Monte Carlo Methods Appl. 6 15–26
[53] Dremin V, Zherebtsov E, Bykov A, Popov A, Doronin A and Meglinski I 2019 Influence of blood pulsation on diagnostic volume in
pulse oximetry and photoplethysmography measurements Appl. Opt. 58 9398–405
[54] Doronin A and Meglinski I 2012 Peer-to-peer Monte Carlo simulation of photon migration in topical applications of biomedical optics
J. Biomed. Opt. 17 0905041
[55] Meglinsky I V and Matcher S J 2001 Modelling the sampling volume for skin blood oxygenation measurements Med. Biol. Eng. Comput.
39 44–50
[56] Meglinski I, Bashkatov A N, Genina E A, Churmakov D Y and Tuchin V V 2002 Study of the possibility of increasing the probing depth
by the method of reflection confocal microscopy upon immersion clearing of near-surface human skin layers Quantum Electron. 32
875–82
[57] Bashkatov A N, Genina E A and Tuchin V V 2011 Optical properties of skin, subcutaneous, and muscle tissues: a review J. Innov. Opt.
Heal. Sci. 4 9–38
[58] Syms C 2018 Principal components analysis Encyclopedia of Ecology (3) (Oxford: Elsevier) pp 566–73
[59] Tazi I, Isnaini N L, Mutmainnah M and Ainur A 2019 Principal component analysis (PCA) method for classification of beef and pork
aroma based on electronic nose IJHAR 1 5–8
[60] Tian X Y, Cai Q and Zhang Y M 2012 Rapid classification of hairtail fish and pork freshness using an electronic nose based on the PCA
method J. Sens. 12 260–77
[61] Yang D, He D, Lu A, Ren D and Wang J 2017 Detection of the freshness state of cooked beef during storage using hyperspectral imaging
Appl. Spectrosc. 71 2286–301
[62] Alamprese C, Casale M, Sinelli N, Lanteri S and Casiraghi E 2013 Detection of minced beef adulteration with turkey meat by UV–vis,
NIR and MIR spectroscopy LWT - Food Sci. Technol. 53 225–32
[63] Michalczuk M, Marzec A, Damaziak K, Zdanowska-Sąsiadek Ż, Bogdańska K, Slósarz J, Niemiec J and De Smet S 2018 Application of
the support sensory system and principal component analysis to compare meat of chickens of two genotypes CyTA - J. Food 16 667–71
[64] Šnirc M, Kral M, Ošťádalová M, Golian J and Tremlová B 2017 Application of principal component analysis method for
characterization chemical, technological, and textural parameters of farmed and pastured red deer Int. J. Food Prop. 20 754–61
[65] Schmutzler M, Beganovic A, Böhler G and Huck C W 2015 Methods for detection of pork adulteration in veal product based on FT-
NIR spectroscopy for laboratory, industrial and on-site analysis Food Control 57 258–67
[66] Trinderup C H 2015 Multispectral Imaging of Meat Quality - Color and Texture Technical University of Denmark
[67] Chen H, Zhang M, Bhandari B and Yang C 2019 Development of a novel colorimetric food package label for monitoring lean pork
freshness LWT - Food Sci. Technol. 99 43–9
11You can also read