High Resolution Micro-Computed Tomography Reveals a Network of Collagen Channels in the Body Region of the Knee Meniscus
←
→
Page content transcription
If your browser does not render page correctly, please read the page content below
BIOMEDICAL
Annals of Biomedical Engineering (Ó 2021)                                                                         ENGINEERING
https://doi.org/10.1007/s10439-021-02763-6                                                                        SOCIETY

Original Article

      High Resolution Micro-Computed Tomography Reveals a Network
       of Collagen Channels in the Body Region of the Knee Meniscus
                 GRETA AGUSTONI,1,2 JARED MARITZ,2 JAMES KENNEDY,2 FRANCESCO P. BONOMO,3
                           STÉPHANE P. A. BORDAS,4,5,6 and OLGA BARRERA 2,7,8
1
Department of Health Science and Technologies, ETH, Zurich, Switzerland; 2University of Oxford, Oxford, UK; 3Università
    degli Studi di Palermo, Palermo, Italy; 4Institute of Computational Engineering Sciences, University of Luxembourg,
 Luxembourg, Luxembourg; 5Institute of Research and Development, Duy Tan University, K7/25 Quang Trung, Danang,
 Vietnam; 6Cardiff University, School of Engineering, Cardiff, UK; 7School of Engineering, Computing and Mathematics,
Oxford Brookes University, Wheatley Campus, Oxford OX33 1HX, UK; and 8Department of Medical Research, China Medical
                             University Hospital, China Medical University, Taichung, Taiwan
                                                (Received 4 January 2021; accepted 1 March 2021)

                                        Associate Editor Arash Kheradvar oversaw the review of this article.

Abstract—The meniscus is an integral part of the human                                            INTRODUCTION
knee, preventing joint degradation by distributing load from
the femoral condyles to the tibial plateau. Recent qualitative                  The meniscus is a type of tough fibro-cartilage soft
studies suggested that the meniscus is constituted by an                     tissue that conforms to the surfaces of the tibia and the
intricate net of collagen channels inside which the fluid flows
                                                                             femur. There are two menisci: lateral and medial
during loading. The aim of this study is to describe in detail
the structure in which this fluid flows by quantifying the                     meniscus, each one rest between the thigh bone (femur)
orientation and morphology of the collagen channels of the                   and shin bone (tibia).2 They play a critical role in load
meniscal tissue. A 7 mm cylindrical sample, extracted                        transmission to the articular cartilage, structural sta-
vertically from the central part of a lateral porcine meniscus               bility and shock absorption in the knee joint by helping
was freeze-dried and scanned using the highest-to-date
                                                                             to protect the articulation from the stresses originated
resolution Microscopic Computed Tomography. The orien-
tation of the collagen channels, their size and distribution                 during physical activities.21
was calculated. Comparisons with confocal multi-photon                          Due to an aging and more active population, the
microscopy imaging performed on portions of fresh tissue                     number of meniscus-related operations has markedly
have shown that the freeze-dried procedure adopted here                      increased in the last decade.20 The meniscus has vari-
ensures that the native architecture of the tissue is main-
                                                                             able levels of perfusion. The outer third is well perfused
tained. Sections of the probe at different heights were
examined to determine differences in composition and                         and heals well when damaged, however the inner third,
structure along the sample from the superficial to the internal               which is not vascularised, does not heal. Repair
layers. Results reveal a different arrangement of the collagen               strategies, like sutures, staples and anchors, allow
channels in the superficial layers with respect to the internal               preservation of the meniscal tissue, however healing of
layers with the internal layers showing a more ordered
                                                                             the tissue is more likely to occur when the tear is lo-
structure of the channels oriented at 30 with respect to the
vertical, a porosity of 66.28% and the mean size of the                      cated in the vascularised area.26 On the other hand,
channels of 22.14 lm.                                                        degenerative tears tend to start in the inside circum-
                                                                             ference of the meniscus which is avascular. In this case
Keywords—Keywords: Meniscus, Microstructure, Porosity,                       tears are usually treated by partial meniscectomy. It
Collagen, Micro-CT.                                                          has been noticed that the loss of the meniscus leads to
                                                                             joint degeneration and osteoarthritis as contact stresses
                                                                             on the tibial plateau increase proportionally with the
                                                                             amount of meniscus tissue removed. Hence replacing
   Address correspondence to Olga Barrera, School of Engineering,            the resected meniscal tissue by an artificial implant is
Computing and Mathematics, Oxford Brookes University, Wheatley
Campus, Oxford OX33 1HX, UK. Electronic mail: olga.barrera@
                                                                             necessary in order to avoid the articular cartilage
ndorms.ox.ac.uk                                                              degeneration.18 Unfortunately, the clinical and func-

                                                                                                                        Ó 2021 The Author(s)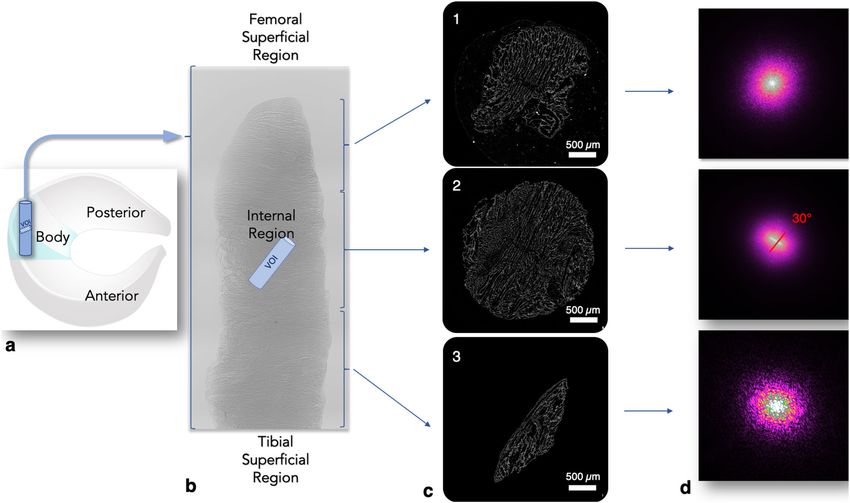
AGUSTONI et al.
tional outcomes for these devices are not ideal. It is MATERIALS AND METHODS
thought that this is primarily due to their inability to
replicate the function of the native meniscus. There- Sample Preparation
fore, mimicking the native biomechanical and struc- One sample of 33.7 mg (Fig. 1a) was extracted from
ture characteristics of the menisci seems to be the key the central area (body), along the vertical axis of a
factor in meniscus replacement functioning. lateral porcine meniscus using a biopsy punch. After-
The meniscus is mainly composed by a fluid phase wards the sample was immediately frozen at 80 C
(60–70% is water) and a porous solid phase which for 12 h and subsequently freeze-dried by setting the
consists predominantly of collagen type 1 for 15–25%.2 parameters shown in the Table 1 in a Benchtop Freeze
Petersen and Tillmann24 observed a different arrange- Dryer (FreeZone Triad Cascade, Labconco) at a vac-
ment of collagen fibers in the cross-section of the uum pressure of 0.120 mbar. The resulting weight and
meniscus. The first one, the superficial layer is constitute dimensions were 10.2 mg, 2 mm diameter and 7 mm
by randomly oriented thin fibrils with about 30 nm height.
diameter. The second layer beneath the surface is made
of lamella-like collagen fibril bundles and the more
internal layers exhibit collagen fibers running along the Micro-Computed Tomography
circumferential direction which are believed to be A micro-Computed Tomography (lCT) scanner
responsible of the load bearing capacity of the tissue. A (Skyscan 1272, Bruker Kontich, Belgium) has been
more detailed study on the internal layers of the menis- used to run the lCT analysis. One base (the tibial side)
cus has shown additional details on the collagen fibers in of the sample was fixed at the base of the instrument
the radial directions in the internal regions of the tissue. rotating support by laying a layer of wax. The images
Radial tie collagen fibers have been discovered to divide were acquired by setting a rotation step of 0.3 with a
the cross section of the meniscus into honeycomb-like pixel size of 600 nm. An X-ray beam with an energy
compartments which have been observed to contain level of 40 and an intensity of 250 mA was used. In
collagen fibrils (diameter of 5 lm).27 However these re- order to image the whole sample in high resolution
sults are limited by the imaging techniques used and the mode the functions ’oversize’ and ’batch Scanning’
related sample preparation which inevitably introduce were used. These functions allow to scan the whole
artefacts such as fixation, mechanical and chemical object by dividing it into sub-objects and then recon-
peeling and dehydration. struct the sample. In this case the micro CT of the full
Recently a number of advanced imaging techniques cylinder has been achieved by combining 5 scans of
have been used in order to characterize meniscal sub-cylinders. The obtained dataset after the acquisi-
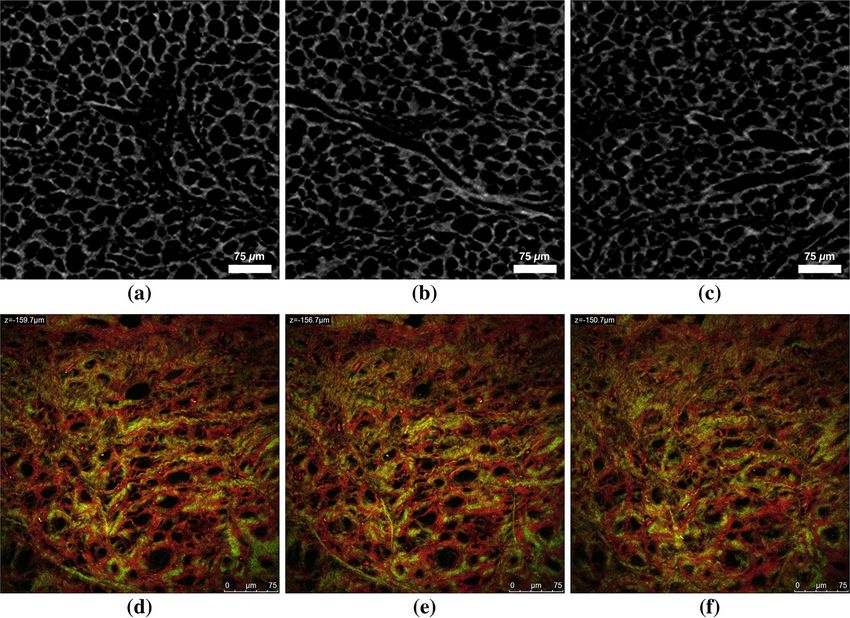
properties as diffusivity,14,31 biochemical composition1 tion step consisted of images shown in Figs. 2a–2c in
and structural deterioration of tissues.15 16-bit tiff format (1640 2452 pixels). In Figs. 2a–2c a
The three dimensional structure of the ‘‘honey- porous structure is visible, each of these pores present
comb-like’’ compartments have been recently observed on the image represent a channel in 3D. It is interesting
in fresh and untreated human meniscal samples.32 The to note that multi-photon microscopy investigations
authors detected ‘‘honeycomb-like’’ compartment of on fresh and non treated samples32 showed architec-
size varying from micro (25 to 100 lm) to macro (600 tural quantitative results in terms of mean porosity
lm to 1 mm). Each honeycomb compartment is dis- comparable to the freeze dried tissue as reported in
covered to be filled by pores. The 3D reconstruction of Figs. 2d–2f.
the pores show essentially collagen channels. The micro-CT scans of the vertical cylinder shown
The aim of this paper is twofold. Firstly, to confirm in Fig. 1b account to 11,000 2D images. 3D recon-
by to-date highest resolution Micro Computed structions and subvolume extraction have been per-
Tomography the collagen architecture of the different formed with 3D.SUITE software part of the Skyscan
layers of the body of the meniscus. Secondly, to system. 3D.SUITE software has been used to extract a
quantitatively describe for the first time the three VOI (i.e. a smaller cylinder) in the radial direction
dimensional meniscal porous architecture including the from the middle region of the vertical cylinder. The
statistical distributions of dimensions, frequency and VOI dataset consists of 1002 2D images.
tortuosity of the collagen channels. An overview of the
study is shown in Fig. 1. A cylindrical sample from the
body of a porcine meniscus was extracted and scanned. Fast Fourier Transform Analysis of the Collagen
Subsequently a Volume Of Interest (VOI, Fig. 1b) in Channels
the direction of the orientation of the collagen channels The Fast Fourier Transform (FFT) is a useful image
(30 ) has been studied in order to quantify the porous processing tool to analyse characteristic feature of the
microstructure of the internal layers.
BIOMEDICAL
ENGINEERING
SOCIETY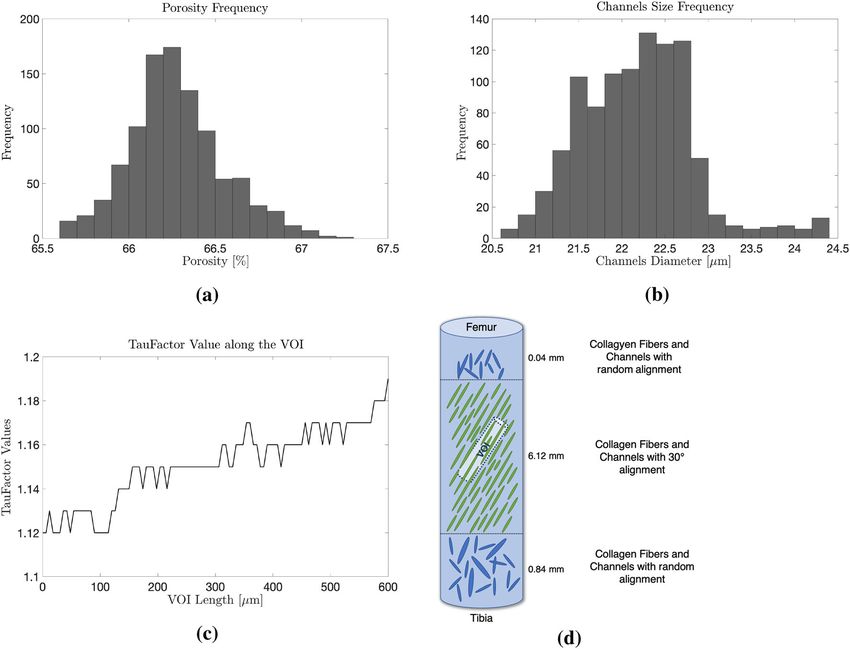
High Resolution Micro-Computed Tomography Reveals a Network of Collagen Channels

FIGURE 1. (a) Schematic representation of the meniscus, the extracted and scanned cylindrical sample. (b) 3D reconstruction of
the cylinder and the orientation and position of the VOI extracted within the internal region; (c) examples of micro-CT scan images
of the architecture of the three regions: (1) femoral superficial region, (2) the internal region and (3) the tibial superficial region; and
(d) FFT spectrums of (1)–(3) showing that the collagen channels have no specific orientation in the superficial regions and they
oriented at 30 in the internal region.

           TABLE 1. Freeze-dry process settings.                                                   RESULTS

Time (h)                                 Shelf’s temperature ( C)                Collagen Channels Orientation Analysis
0                                          35                               Fast Fourier Transform (FFT) Analysis of 11,000
1                                          10                            micro-CT images of the whole cylinder in Fig. 1b has
1.5                                      0                               been carried out. The collagen fibers are seen to be
1                                        10
1                                        20
                                                                         hollow cylinders i.e. channels. These channels appear
1                                        37                              to follow different paths in the superficial and internal
0.5                                      STOP                            layers. Figure 1c shows an example of images of the
                                                                         three different regions. The quantification of collagen
                                                                         fibers orientation is perpendicular to the direction of
                                                                         where FFT maxima aligns (FFT spectrums of the
spatial domain of an image.25 A 2D image is converted                    internal region in Fig. 1d).11 The superficial region
from its spatial domain into the Fourier Domain and                      from the tibia, shows no channels alignment for the
decomposed into its sine and cosine components. Each                     first 0.84 mm of the sample. The channels seem to
point in the Fourier Domain represents a particular                      follow random orientations. The second region (the
frequency which is contained in the spatial domain of                    internal region) shows a consistent alignment of the
the 2D image. With the conversion into the Fourier                       collagen fibers with an orientation of 30 respect to the
Domain, it is possible to find the dominant frequencies                   vertical (see FFT spectrum in the Fig. 1). The region
of the image which influence its geometric structure in                   facing the femur, shows as the first region next to the
its spatial domain.11 Gwyddion software (open source)                    tibia no fibers alignment but for a lesser extent, it
has been used to carry out 2D FFT Analysis of micro                      covers only 0.04 mm of the probe. A perpendicular cut
CT images and to obtain the related Fourier spectrum.                    (radial direction) of the internal region is represented
The procedure is described in Reference 32.                              in Fig. 1b (VOI). The architecture of the VOI has been

                                                                                                                               BIOMEDICAL
                                                                                                                               ENGINEERING
                                                                                                                               SOCIETY
AGUSTONI et al.
FIGURE 2. (a)–(c) Micro-CT scans extracted from the VOI (Fig. 1b); and (d)–(f) multiphoton Microscopy Images of a similar region
of the VOI. In order to carry out multiphoton microscopy, samples were imaged at 1024 1024 pixel resolution using a Leica TCS
SP5 laser scanning microscope with a 40 oil objective (Leica Microsystems, Germany) with a scanning frequency of 400 Hz.
Images stack were acquired with steps ranging from 0.5 to 1.7 lm, along the z axis. The two-photon excitation (Spectra-Physics
Mai-Tai Ti:Sa ultra-fast laser) was set at 880 nm. The SHG signal was detected in the range of 390–460 nm (green channel) and
tissue autofluorescence was detected in the range of 485–650 nm (red channel).
imaged with two advanced imaging techniques (micro- mean diameter measured (standard deviation of 13.05).
CT and multiphoton microscopy) as shown in Fig. 2. Figure 3b displays the amount of pores having the
The quantification of a number of parameters of this same diameter which have been identified along the
porous region (VOI) is discussed in detail in the next VOI. It shows that the majority of the pores has a
section. diameter between 21.96 and 22.76 lm.
Porosity Analysis of the VOI Tortuosity Analysis of the VOI
1002 Micro-CT images obtained from the VOI were A tortuosity analysis is performed to understand the
processed and analysed using a MATLAB Code (see path of the channels seen in the 3D reconstruction of
‘‘Appendix’’). With the MATLAB script it was possi- the VOI. The MATLAB Application ‘‘TauFactor’’
ble to calculate different parameters such as porosity enabled us to carry out the tortuosity analysis. An
and its variation along the VOI, pores’ diameter and its average value of TF = 1.15 has been measured along
frequency throughout the VOI. Firstly we measured the VOI. Figure 3d shows the values of TF along its
the mean porosity of the VOI which accounts to whole length. In the first micrometer of the VOI a
66.28% (standard deviation of 0.27). Figure 3a shows lower TF value has been calculated, which indicate a
the porosity frequency defined as the amount of micro- less convoluted geometry of the channels. In the rest of
CT images of the VOI showing the same values-range the VOI greater values of TF are calculated, repre-
of porosity, ranging from 65.6% (lowest value mea- senting a more tortuous flow path than in its first 300
sured) to 67.2% (highest value measured). Secondly we lm.
measured the pore size and the frequency of the pores
having the same diameter. 22.14 lm represents the
BIOMEDICAL
ENGINEERING
SOCIETYHigh Resolution Micro-Computed Tomography Reveals a Network of Collagen Channels
FIGURE 3. Results of the porosity analysis of the VOI. (a) Porosity Frequency of the VOI (Frequency defined as the amount of
micro-CT images of the VOI); (b) Channels Size Frequency along the VOI (Frequency defined as the amount of channels having the
same diameter); (c) Results of the Tortuosity Analysis using ‘‘TauFactor’’—TF Values along the VOI length; and (d) structure of the
vertical cylincer and collagen fibers orientation.
DISCUSSION electrospinning method to produce meniscal nanofi-
brous scaffolds. A FFT analysis enabled them to
By using the Gwyddion software was possible to analyse the spatial changes in fiber alignment present
execute FFT transforms of the micro CT images in the scaffold. These studies confirmed that the use of
obtaining their respective FFT spectrums. The latter FFT in determining structure pattern orientation is a
confirmed our expectations because the channels’ ori- very reliable and well-known technique to quantify this
entation is also directly visible from the micro-CT characteristic. There are no studies that used high-
images (Fig. 1c). Fast Fourier Transform has been resolution micro-CT scans as imaging technique com-
already used in various studies to analyse and describe bined with a FFT analysis to quantify collagen or soft
collagen fibers’ orientation or just fibers’ alignment of tissue pattern orientation. The majority of the works
many materials, the majority of the works are based on that applied FFT to the analysis of structure orienta-
skin samples. In the work of Wu et al.33 a quantitative tion have mostly used multiphoton microscopy.32,33
analysis on collagen morphology of aged skin has been One of the first studies on the macroscopic structure of
carried out. By using FFT they were able to under- the meniscus is the one of Bullough et al. Its results
stand the texture of skin based on its collagen orien- describe that along the circumferential direction, col-
tation’ index and bundle packing. De Campos Vidal lagen fibers are arranged to resist the tension and the
and Mello6 focused on porcine chordae tendinae with fibers along the radial direction act as tie fibers in order
the aim to understand the orientation and undulations to avoid a longitudinal splitting of the meniscal tissue.4
of collagen fibers. They carried out a FFT Analysis of Petersen et al. brought some novelties regarding the
the collagen structure, technique that enabled them to arrangement of the radial collagen fibers.24 They de-
identify an helical structure present in the chordae scribe 10 lm bundles arranged collagen fibrils in the
tendinae. Furthermore, Fisher et al.9 developed a novel radial direction which associate laterally to form a
BIOMEDICAL
ENGINEERING
SOCIETYAGUSTONI et al.
honeycomb network within the body region of the different gray-scale intensities.29 If the difference in the
meniscus.24 Although the important findings of these absorptive properties of two optically different struc-
studies, the techniques of preparation of the samples tures is not sufficient, they will appear to be the same in
used such as fixation, dehydration and chemical peel- a micro-CT generated scan.29 Furthermore, by using
ing can alter the tissue structure limiting the quantifi- X-radiations results in a potential risks to the research
cation of the results.10 Therefore, the use of non- operating staff.13 However, the application of micro-
invasive micro-CT systems for the analysis of the CT within material sciences is gaining popularity.17
sample is a proved method for the quantification of The majority of human-related studies use micro-CT in
tissues properties. The circumferential arrangement of the quantification of bone density and architecture and
the collagen fibers presented by Bullough et al.4 and in the vascular research. X-ray computed tomography
Petersen and Tillmann24 has been confirmed by Vetri is also a very well-known technique to measure
et al.32 Otherwise regarding the radial section, Vetri porosity in materials, a lot of works can be found in
et al. brought novel results showing that collagen the domain of concretes, stones and metal implants
bundles form the side walls of highly porous honey- analysis such as References 7,16,23,28. This paper rep-
comb-like structures developing in space as tiny resents the only work using micro-CT as imaging
channels.32 Although multiple studies attempted to technique to analyse the microstructure of the menis-
elucidate the structure of the meniscus in both cir- cus. This imaging method enabled us to obtain high-
cumferential and radial directions, there is no evidence resolution images in gray-scale intensities in which the
of the meniscal composition, in particular of the col- channels can be well distinguished from the collagen
lagen fibers arrangement, in the vertical direction apart structure around them, an example is in Fig. 4a.
this paper. The results presented in this work show a Micro-CT technique is not ideal to image soft tissue
preferred orientation of the collagen fibers in the in physiological condition (i.e. wet) as there is no en-
internal region of the vertical sample. Upon FFT ough contrast between the liquid and solid phase. This
analysis we can divide the sample into three sections is the reason behind the choice of freeze drying the
having different collagen orientation. Our results meniscal sample. The MATLAB Script used to execute
complete the description of the collagen pattern in the the porosity analysis has been written upon the char-
meniscal tissue, meaning that along the defined direc- acteristics of the micro-CT images at disposition.
tions (circumferential, radial and vertical) the collagen Depending on color, contrast, size of the objects dis-
fibers are arranged into a particular design. The played and parameters to calculate, the code has been
channels structure with an orientation of 30 is mostly adjusted to our scans. There are no Scripts fit for all
present in the middle of the micro CT image and ex- images, every set of images has to be processed in an
tends itself for the whole diameter of the sample. At its optimized way upon its imaging characteristics. The
right and left side, a porous structure similar to the one process of finding the suited coding sequences to ob-
described and quantified in the next section can be tain meaningful results was the main focus for the first
identified. part of this study. Although a margin of error is pre-
High-resolution micro computed tomography uses sent in this process because during image processing
X-radiations to penetrate any kind of material in order operations a tiny amount of the image information get
to provide detailed microstructural information.29 lost, we still manage to obtain results that are able to
Technique that belongs to the non-destructive test explain the real porous structure of the meniscus.
methods allowing to display internal structure images Tortuosity Factor (TF) allows the quantification of
in a non-destructive manner with a very high resolu- the apparent decrease in diffusive transport which re-
tion. Furthermore, it is also capable of eliminating sults from the convolutions of the flow path through a
laborious sample preparation, is less susceptible to porous material.5,8 Tortuosity factor and tortuosity
artifacts and is cost-effective. Micro-CT systems are represent two different parameters but they both
optimized to provide very good spatial resolution in characterize the geometry of the porous media. Tor-
order to obtain an image that is very close to the his- tuosity (s) equals the ratio of the actual length of the
tological microscopy of the material analysed.13 The flow path divided by the length of a straight line in the
data provided can be presented in two and three direction of flow.12,19 TF and tortuosity both increase
dimensions enabling the observation and measurement proportionally with more tortuous pathways. If the
for different purposes.29 Despite its many advantages, cross-sectional area of the flow stays constant, tortu-
micro-CT carries also some limitations, such as the osity factor is equal to the square of tortuosity.30 If the
inability to differentiate between structures with a flow path is direct, TF and tortuosity tend to a value of
similar atomic density. The radiograph records the 1 which corresponds to their minimal value. Values
absorption of X-rays by a three-dimensional material greater than 1 represents a more tortuous geometry of
and project them onto a two-dimensional image with the sample which decrease the velocity of the diffusive
BIOMEDICAL
ENGINEERING
SOCIETYHigh Resolution Micro-Computed Tomography Reveals a Network of Collagen Channels
FIGURE 4. (a) Native VOI micro-CT scan, bar = 200 lm; and (b) Processed VOI micro-CT scan, bar = 200 lm.
transport.3,5 ‘‘TauFactor’’ is a MATLAB application currently part of an ongoing study. The summary of
which allows to calculate the decrease in diffusive the work and findings is given below:
transport caused by the convoluted geometry of the
media. It quantifies the tortuosity factor of intercon- A vertical sample from the lateral central meniscal
nected porous phases in a three-dimensional volume body was taken and analysed to discover a porous
along three mutually perpendicular axes.5 In our study, structure containing fluid channels.
the tortuosity analysis has been carried out in the These channels are orientated with a 30 inclina-
direction of the channels’ flow present in the VOI tion to the vertical in the internal region, but are
(radial direction). The micro-CT study of Backeberg randomly aligned close to the tibial and femoral
et al. used the TauFactor Application to quantify the surfaces.
tortuosity of permeable pathways in clay-rich mud Channels had a mean size of 22.14 lm and show an
stones. They obtained much higher values of tortuosity almost straight path in the radial direction.
factor (TF 1000) representing a more convoluted The thickness of the tibial superficial layer in which
geometry of their samples.3 Furthermore, the samples the channels have no specific orientation is greater
having a lower value of tortuosity factor, are the one than the femoral one. Further analysis on the
having a higher percentage of porous phase volume. internal region found a porosity of 66.28% in the
The values obtained from our tortuosity analysis sug- radial direction.
gest an almost direct flow path through the VOI in
comparison to the values calculated in the study of
Backeberg et al.3 In relation to their results, the high
APPENDIX
porosity percentage described in our porosity analysis
suggest a possible link to the very low convoluted Porosity Analysis and Collagen Channels Size
geometry of the VOI. The focus of this work is the Distribution of the VOI
body region of the meniscal tissue. The body region is
divided into three areas: red (vascular), red–white A MATLAB code (see ‘‘Appendix’’) has been
(partially vascular) and white (avascular). The ana- written in order to execute image processing operations
lyzed sample was extracted from the vascular region for extracting quantitative information of the charac-
which is the area mostly affected by the contact teristic features of the microstructure: i.e. porosity
between the femur/tibia cartilage. A complete study of along the 3D domain, pore size distribution and their
the whole meniscal body architecture would include frequency. A detail of the original image of micro CT
the analysis of samples extracted from the red–white scan and the processed image to perform the quanti-
and white region. As the tissue becomes thinner when tative analysis is shown in Fig. 4.
approaching the white region a different porosity and The first operation we used to processed the micro-
collagen channel size/frequency are expected. This is CT scans of the VOI is image binarization. Process
that enables to convert a gray-scale image into a black-
BIOMEDICAL
ENGINEERING
SOCIETYAGUSTONI et al.
and-white one (binary image) reducing the data con- standard deviation has been calculated for all the 1002
tained in the image.22 The process is also known as micro CT images.
image thresholding which is a form of segmentation in
which the image is divided into its constituent
objects.22 Like others image processing operations,
image binarization is not trivial and is dependent on ACKNOWLEDGMENTS
information-content of the image.22 The result of the
O.B. would like to acknowledge the European Un-
binarization of the micro-CT scans is presented in
ion’s Horizon 2020-EU.1.3.2.: Nurturing excellence by
Fig. 4b. The transformation to binary images was
means of cross-border and cross-sector mobility under
necessary because porosity is defined as the amount of
the Marie Skłodowska-Curie Individual Fellowship
black pixels (pores) over the total amount of pixels in a
MSCA-IF-2017, MetaBioMec, Grant Agreement ID
binary image. By using this definition porosity for ev-
796405. S.P.A. BORDAS received funding from the
ery micro-CT scan has been calculated. Subsequently
European Union’s Horizon 2020 research and inno-
the binary images have been inverted, the pores be-
vation programme under grant agreement No 811099
came white. The white portion of the image is the one
TWINNING Project DRIVEN for the University of
containing the major data and with this operation was
Luxembourg.
possible to introduce a structuring element decompo-
sition to recognize the pores. The function ‘‘strel
(‘disk’, 6)’’ creates an approximated flat-disk shaped
structuring element with a radius of 6 pixels which CONFLICT OF INTEREST
enables to recognize the presence of circular objects The authors declare no competing interests.
(pores) within the image. By using the function ‘‘im-
open’’, a morphological opening on the binary image
OPEN ACCESS
with the previously defined structuring element was
performed. This operation consist of an erosion fol- This article is licensed under a Creative Commons
lowed directly by a dilation, both using the same Attribution 4.0 International License, which permits
structuring element. To eliminate the white or black use, sharing, adaptation, distribution and reproduction
snowflakes present in the image, the function ‘‘imfill’’ in any medium or format, as long as you give appro-
has been used. This operation is capable to fill holes priate credit to the original author(s) and the source,
defined as a set of background pixels that cannot be provide a link to the Creative Commons licence, and
reached by filling in the background from the edge of indicate if changes were made. The images or other
the image. By doing so was possible to obtain homo- third party material in this article are included in the
geneous white pores. At this stage was possible to article’s Creative Commons licence, unless indicated
calculate the radius of every pore by setting a round- otherwise in a credit line to the material. If material is
ness limit of 0.8. Circular structures with a roundness not included in the article’s Creative Commons licence
above 0.8 were considered in the process of calculation. and your intended use is not permitted by statutory
1 Corresponds to a perfect disk. regulation or exceeds the permitted use, you will need
Porosity analysis the images were binarised using to obtain permission directly from the copyright
the ‘‘imbinarize’’ function. Porosity of each image was holder. To view a copy of this licence, visit http://crea
calculated by counting the amount of black pixels and tivecommons.org/licenses/by/4.0/.
dividing it by the total amount of pixels present in the
image.
Pore size and their distribution the inverted binarised REFERENCES
images, pores displayed in white, has been used to
calculate the pore size distribution. A disk structuring 1
Ala-Myllymäki, J., T. Paakkonen, A. Joukainen, H. Krö-
element with a radius of 6 pixels is defined and used ger, P. Lehenkari, J. Töyräs, and I. O. Afara. Near-infrared
with a morphological filters to remove black snow- spectroscopy for mapping of human meniscus biochemical
flakes with a radius smaller than 6 pixels present in the constituents. Ann. Biomed. Eng. 49:469–476, 2021. https://d
oi.org/10.1007/s10439-020-02578-x.
white pores (‘‘imfill’’ MATLAB function). To define 2
Fox, A. J. S., A. Bedi, and S. A. Rodeo. The basic science
the boundaries of the pores, the function ‘‘bwbound- of human knee menisci: structure, composition, and func-
aries’’ has been used to trace the pores’ borders on the tion. Sports Health 4(4):340–351, 2012.
3
inverse binary images. A MATLAB structure with Backeberg, N. R., et al. Quantifying the anisotropy and
measure properties of each image has been created tortuosity of permeable pathways in clay-rich mudstones
using models based on X-ray tomography. Sci. Rep.
using the function ‘‘regionsprops’’. From this structure 7(1):1–12, 2017.
dimensions such as mean pore diameter and mean
BIOMEDICAL
ENGINEERING
SOCIETYHigh Resolution Micro-Computed Tomography Reveals a Network of Collagen Channels
4 20
Bullough, P. G., L. Munuera, J. Murphy, and A. M. McDermott, I.D., and A.A. Amis. The consequences of
Weinstein. The strength of the menisci of the knee as it meniscectomy. J. Bone Jt Surg. Br. Vol. 88(12):1549–1556,
relates to their fine structure. J. Bone Jt Surg. Br. Vol. 2006.
21
52(3):564–570, 1970. Messner, K., and J. Gao. The menisci of the knee joint
5
Cooper, S. J., A. Bertei, P. R. Shearing, J. A. Kilner, and Anatomical and functional characteristics, and a rationale
N. P. Brandon. TauFactor: an open-source application for for clinical treatment. J Anat 193(2):161–178, 1998.
22
calculating tortuosity factors from tomographic data. Otsu, N. A threshold selection method from gray-level
SoftwareX 5:203–210, 2016. histograms. IEEE Trans Syst. Man Cybern. 9(1):62–66,
6
de Campos Vidal, B., and M. L. S. Mello. Structural 1979.
23
organization of collagen fibers in chordae tendinae as Otsuki, B., M. Takemoto, S. Fujibayashi, M. Neo, T.
assessed by optical anisotropic properties and Fast Fourier Kokubo, and T. Nakamura. Pore throat size and connec-
transform. J. Struct. Biol. 167(2):166–175, 2009. tivity determine bone and tissue ingrowth into porous im-
7
Du Plessis, A., B. J. Olawuyi, W. P. Boshoff, and S. G. Le plants: three-dimensional micro-CT based structural
Roux. Simple and fast porosity analysis of concrete using analyses of porous bioactive titanium implants. Biomate-
X-ray computed tomography. Mater. Struct. 49(1–2):553– rials 27(35):5892–5900, 2006.
24
562, 2016. Petersen, W., and B. Tillmann. Collagenous fibril texture of
8
Epstein, N. On tortuosity and the tortuosity factor in flow the human knee joint menisci. Anat. Embryol. 197(4):317–
and diffusion through porous media. Chem. Eng. Sci. 324, 1998.
25
44(3):777–779, 1989. Rao, R.A.R., M.R. Mehta, and K.C. Toussaint. Fourier
9
Fisher, M. B., E. A. Henning, N. Söegaard, J. L. Esterhai, transform-second-harmonic generation imaging of biolog-
and R. L. Mauck. Organized nanofibrous scaffolds that ical tissues. Opt. Express 17(17):14534–14542, 2009.
26
mimic the macroscopic and microscopic architecture of the Rath, E., and J.C. Richmond. The menisci: basic science
knee meniscus. Acta biomater. 9(1):4496–4504, 2013. and advances in treatment. Br. J. Sports Med. 34(4):252–
10
Georgiadis, M., R. Müller, and P. Schneider. Techniques to 257, 2000.
27
assess bone ultrastructure organization: orientation and Rattner, J.B., et al. New understanding of the complex
arrangement of mineralized collagen fibrils. J. R. Soc. structure of knee menisci: implications for injury risk and
Interface 13(119):20160088, 2016. repair potential for athletes. Scand. J. Med. Sci. Sports
11
Goodman, J. W.. Introduction to Fourier Optics. Green- 21(4):543–553, 2011.
28
wood Village, CO: Roberts and Company Publishers, 2005. Salvo, L., et al. X-ray micro-tomography an attractive
12
Guo, P. Dependency of tortuosity and permeability of characterisation technique in materials science. Nucl. In-
porous media on directional distribution of pore voids. strum. Methods Phys. Res. B 200:273–286, 2003.
29
Transp. Porous Media 95(2):285–303, 2012. Shen, H., S. Nutt, and D. Hull. Direct observation and
13
Holdsworth, D. W., and M. M. Thornton. Micro-CT in measurement of fiber architecture in short fiber–polymer
small animal and specimen imaging. Trends Biotechnol. composite foam through micro-CT imaging. Compos. Sci.
20(8):S34–S39, 2002. Technol. 64(13–14):2113–2120, 2004.
14 30
Honkanen, J.T.J., M.J. Turunen, J.D. Freedman, S. Saar- Tjaden, B., S. J. Cooper, D. J. L. Brett, D. Kramer, and P.
akkala, M.W. Grinstaff, J.H. Ylärinne, J.S. Jurvelin, and J. R. Shearing. On the origin and application of the Brugge-
Töyräs. Cationic contrast agent diffusion differs between man correlation for analysing transport phenomena in
cartilage and meniscus. Ann. Biomed. Eng. 44:2913–2921, electrochemical systems. Curr. Opin. Chem. Eng. 12:44–51,
2016. https://doi.org/10.1007/s10439-016-1629-z. 2016.
15 31
Lin , K.H., and S.Y. Tang. The quantitative structural and Travascio, F., W. Zhao, and W.Y. Gu. Characterization of
compositional analyses of degenerating intervertebral discs anisotropic diffusion tensor of solute in tissue by video-
using magnetic resonance imaging and contrast-enhanced FRAP imaging technique. Ann. Biomed. Eng. 37:813, 2009.
micro-computed tomography. Ann. Biomed. Eng. 45:2626– https://doi.org/10.1007/s10439-009-9655-8.
32
2634, 2017. https://doi.org/10.1007/s10439-017-1891-8. Vetri, V., et al. Advanced microscopy analysis of the micro-
16
Lu, S., E. N. Landis, and D. T. Keane. X-ray microtomo- nanoscale architecture of human menisci. Sci. Rep. 9(1):1–
graphic studies of pore structure and permeability in Port- 13, 2019.
33
land cement concrete. Mater. Struct. 39(6):611–620, 2006. Wu, S., H. Li, H. Yang, X. Zhang, Z. Li, and S. Xu.
17
Maire, E., and P. J. Withers. Quantitative X-ray tomog- Quantitative analysis on collagen morphology in aging skin
raphy. Int. Mater. Rev. 59(1):1–43, 2014. based on multiphoton microscopy. J. Biomed. Opt.
18
Makris, E.A., P. Hadidi, and K.A. Athanasiou. The knee 16(4):040502, 2011.
meniscus: structure–function, pathophysiology, current re-
pair techniques, and prospects for regeneration. Biomate- Publisher’s Note Springer Nature remains neutral with re-
rials 32(30):7411–7431, 2011 . gard to jurisdictional claims in published maps and institu-
19
Matyka, M., A. Khalili, and Z. Koza. Tortuosity–porosity
tional affiliations.
relation in porous media flow. Phys. Rev. E 78(2):026306, 2008.
BIOMEDICAL
ENGINEERING
SOCIETYYou can also read