Metabolome and Microbiota Analysis Reveals the Conducive Effect of Pediococcus acidilactici BCC-1 and Xylan Oligosaccharides on Broiler Chickens ...
←
→
Page content transcription
If your browser does not render page correctly, please read the page content below

ORIGINAL RESEARCH
                                                                                                                                                 published: 28 May 2021
                                                                                                                                        doi: 10.3389/fmicb.2021.683905

                                             Metabolome and Microbiota Analysis
                                             Reveals the Conducive Effect of
                                             Pediococcus acidilactici BCC-1 and
                                             Xylan Oligosaccharides on Broiler
                                             Chickens
                                             Yuqin Wu 1 , Zhao Lei 1 , Youli Wang 1 , Dafei Yin 1 , Samuel E. Aggrey 2 , Yuming Guo 1 and
                                             Jianmin Yuan 1*
                                             1
                                              State Key Laboratory of Animal Nutrition, College of Animal Science and Technology, China Agricultural University, Beijing,
                                             China, 2 NutriGenomics Laboratory, Department of Poultry Science, University of Georgia, Athens, GA, United States

                                             Xylan oligosaccharides (XOS) can promote proliferation of Pediococcus acidilactic
                                             BCC-1, which benefits gut health and growth performance of broilers. The study
                                             aimed to investigate the effect of Pediococcus acidilactic BCC-1 (referred to BBC)
                                             and XOS on the gut metabolome and microbiota of broilers. The feed conversion
                                             ratio of BBC group, XOS group and combined XOS and BBC groups was lower
                            Edited by:       than the control group (P < 0.05). Combined XOS and BBC supplementation (MIX
                       Michael Gänzle,
         University of Alberta, Canada
                                             group) elevated butyrate content of the cecum (P < 0.05) and improved ileum
                     Reviewed by:
                                             morphology by enhancing the ratio of the villus to crypt depth (P < 0.05). The 16S
                 Richard Ducatelle,          rDNA results indicated that both XOS and BBC induced high abundance of butyric
           Ghent University, Belgium
                                             acid bacteria. XOS treatment elevated Clostridium XIVa and the BBC group enriched
                           Shiyu Tao,
     Huazhong Agricultural University,       Anaerotruncus and Faecalibacterium. In contrast, MIX group induced higher relative
                               China         abundance of Clostridiaceae XIVa, Clostridiaceae XIVb and Lachnospiraceae. Besides,
                  *Correspondence:           MIX group showed lower abundance of pathogenic bacteria such as Campylobacter.
                        Jianmin Yuan
                    yuanjm@cau.edu
                                             Metabolome analysis showed that all the 3 treatment groups (XOS, BBC and MIX)
                                             showed lower concentrations of sorbitol and both XOS and BBC group had higher
                   Specialty section:        concentrations of pyridoxine levels than CT group. Besides, XOS and BBC groups
         This article was submitted to
                    Food Microbiology,
                                             enhanced the content of hydroxyphenyl derivatives 4-hydroxyphenylpyruvate 1 and 3-
               a section of the journal      (3-hydroxyphenyl) propionic acid, respectively (P < 0.05). Notably, MIX group enhanced
             Frontiers in Microbiology
                                             both 4-hydroxyphenylpyruvate 1 and 3-(3-hydroxyphenyl) propionic acid (P < 0.05).
           Received: 22 March 2021
                                             Thus, XOS and BBC may have a synergistic role to improve the performance of broilers
            Accepted: 03 May 2021
            Published: 28 May 2021           by modulating gut microbiota and metabolome.
                             Citation:       Keywords: Pediococcus acidilactici, Xylan oligosaccharides, metabolome, microbiota, broiler
          Wu Y, Lei Z, Wang Y, Yin D,
 Aggrey SE, Guo Y and Yuan J (2021)
 Metabolome and Microbiota Analysis
         Reveals the Conducive Effect
                                            INTRODUCTION
   of Pediococcus acidilactici BCC-1
and Xylan Oligosaccharides on Broiler
                                            It is now clear that the gut microbiota and its metabolic activities have essential effects on health
                            Chickens.       and performance of broiler chickens (Calik and Ergun, 2015). Probiotics are beneficial to the host
         Front. Microbiol. 12:683905.       by improving the balance of the gut microbiota (Pender et al., 2017). Dietary supplementation with
    doi: 10.3389/fmicb.2021.683905          probiotic Pediococcus (P.) acidilactici was shown to enhance gut health and growth performance of

Frontiers in Microbiology | www.frontiersin.org                                     1                                              May 2021 | Volume 12 | Article 683905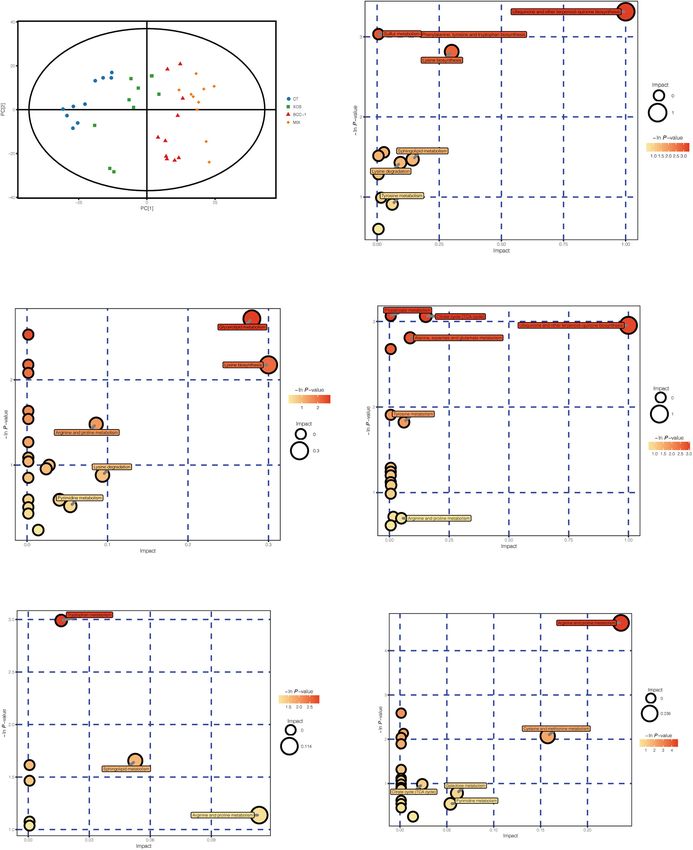
Wu et al.                                                                                                     Pediococcus and Oligosaccharides on Broilers

broilers (Taheri et al., 2010; Jazi et al., 2018). Besides, P. acidilactici       MATERIALS AND METHODS
can improve gut morphology by increasing the villus height
in duodenum and ileum as well (Taheri et al., 2010). The                          Materials
metabolism of P. acidilactici bacteria produced lactic acid and                   XOS (extracted from corncob, 95% purity, DP of 2-7 and
secreted bacteriocins, which inhibited the growth of pathogenic                   containing 95.6% XOS, 2.4% xylose, 1.4% glucose, 0.5%
bacteria such as coliforms and Salmonella (Taheri et al., 2010;                   arabinose, and 0.1% raffinose) was obtained from Shandong
Jazi et al., 2018). Broiler chickens fed a diet supplemented with                 LongLive Biotechnology (DeZhou, Shandong, China).
P. acidilactici had lower coliforms numbers in the ileum than                     P. acidilactici BCC-1 was isolated from the cecum of 36-day-old
that of their control counterparts (Taheri et al., 2010). Therefore,              broiler without feeding any antibiotics (Lei et al., 2018).
dietary supplementation with P. acidilactici effectively protected
birds against the adverse growth effects associated with pathogens
(Lee et al., 2007).                                                               Experiment Design and Bird
   Probiotics activity have been shown to be augmented by                         Management
consuming prebiotics (Gibson et al., 2004). Although xylan                        This study was conducted in an experimental chicken farm of the
oligosaccharides (XOS) cannot be degraded by gut digestive                        College of Animal Science and Technology, China Agricultural
enzymes, it can produce short-chain fatty acids (SCFA) by                         University. A total of 480 one-day-old male Arbor Acres plus
gut microbial fermentation (Kabel et al., 2002). XOS can be                       chicks were randomly divided into 4 treatment groups. There
utilized by Bifidobacterium spp. and Lactobacillus spp. (Moura                    were 8 replicates per treatment and 15 chicks per replicate. The
et al., 2007) resulting in greater production of lactate, butyrate                treatments include 1) control group (CT): basal diet without
and increased Bifidobacterium and Lactobacillus populations                       XOS or P. acidilactici BCC-1; 2) XOS: basal diet plus 0.15%
(De Maesschalck et al., 2015; Pourabedin et al., 2015; Moniz                      XOS; 3) BBC: basal diet plus 109 cfu/kg P. acidilactici BCC-1;
et al., 2016; Yuan et al., 2018). In addition, XOS can                            4) MIX: basal diet plus 0.15% XOS and 109 cfu/kg P. acidilactici
improve feed conversion ratio (De Maesschalck et al., 2015;                       BCC-1. The feed was formulated to meet the standards of
Ribeiro et al., 2018) and increase ileum villus length (De                        nutrient requirements (National Research Council [NRC], 1994)
Maesschalck et al., 2015). Though XOS can be used by                              without antibiotics. The composition of the basal diet and
probiotic strains such as Lactobacillus spp. and Bifidobacterium                  nutritional levels are shown in Table 1. Chickens were raised
spp., it is not degraded by enteric pathogens such as                             from 1 to 21 days of age, and feed and water were provided
Staphylococcus aureus, Clostridium difficile, Salmonella enterica,                ad libitum. The light regimen was 23L:1D. The birds were raised
and Campylobacter jejuni (Moura et al., 2007; Kondepudi                           at 32◦ C for the first week and then decreased by 3◦ C per week
et al., 2012). Besides, dietary XOS also stimulated immune                        until 26◦ C.
response against infection and reduced Salmonella colonization
(Pourabedin et al., 2016). Therefore, XOS modulates animal
                                                                                  Sample Collection
performance enhancement by improving feed digestion, feed
                                                                                  On 21-day old, after 5 h of starvation, 1 bird per replicate was
intake and triggering the shift of the microbiome to a more
                                                                                  randomly selected for sampling. The birds were anesthetized by
favorable composition (Ribeiro et al., 2018). Our previous
                                                                                  an injection of sodium pentobarbital (30 mg/kg body weight)
study also found supplemental combination of xylanase and
                                                                                  in the wing vein followed by jugular exsanguination. Two more
wheat arabinoxylan-specific debranching enzymes enhanced
                                                                                  birds are randomly selected in each group for metabolome
XOS level in the intestine, which consequently benefited
                                                                                  analysis (n = 10). The cecal content of each broiler was
growth performance and gut health in broiler chickens
                                                                                  collected and put into liquid nitrogen immediately, then stored
(Lei et al., 2016).
                                                                                  at −80◦ C until further analysis. Samples of each intestinal tract
   It has been demonstrated through in vitro studies that XOS
                                                                                  including duodenum, jejunum and ileum were taken for the
could promote the proliferation of P. acidilactici BCC-1, which
                                                                                  determination of gut morphology. Digesta samples for viscosity
harbors genes with carbohydrate transport and metabolism
                                                                                  analysis were collected from the jejunum. Chyme samples for
functions (Lei et al., 2018). However, the mechanism through
                                                                                  pH determination were collected from the distal part of the
which P. acidilactici BCC-1 improves growth performance
                                                                                  ileum and cecum. The digesta viscosity was determined by
and gut health is yet to be elucidated. Developments in
                                                                                  using an Obarma’s viscosimeter as described by previous study
omic science have led to significant improvements in the
                                                                                  (Lei et al., 2016).
understanding of the biological mechanisms that underlie
phenotypes (Aggrey et al., 2019). The metabolome can identify
several host tissue and microbiota molecules alluding to                          Intestinal Morphology of Broilers
plausible interaction between the host and its microbiome                         Intestinal samples including duodenum, jejunum and ileum were
(Marcobal et al., 2013; Aggrey et al., 2019). Thus, our                           fixed with paraformaldehyde. After staining, various intestinal
study aimed to investigate whether dietary supplementation                        morphological indexes including muscular layer thickness, villus
of P. acidilactic BCC-1 and XOS has a synergistic role                            height, crypt depth and the ratio of villus height to crypt depth
in broilers’ gut health and growth performance, and it if                         (V/C) were determined. For the measurement of each intestinal
associated with the alternations of cecal microbiota and                          segment, cross-sections of 10 villi and 10 crypts were measured
microbial metabolism.                                                             per tissue sample.

Frontiers in Microbiology | www.frontiersin.org                               2                                      May 2021 | Volume 12 | Article 683905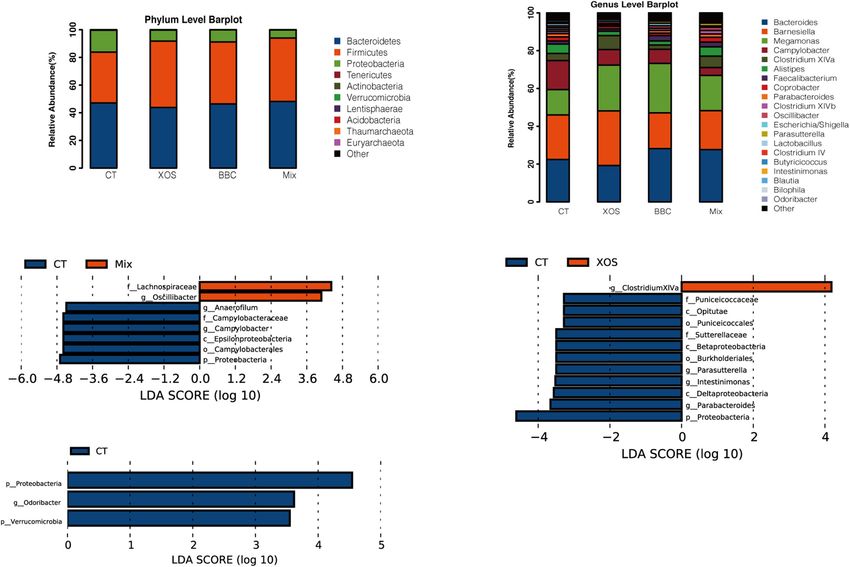
Wu et al.                                                                                                                      Pediococcus and Oligosaccharides on Broilers

TABLE 1 | Composition and nutrient levels of diets (%).                                     (LECO Corp, St. Joseph, MI, United States) was used for
                                                                                            GC/TOFMS analysis. The DB-5MS capillary column was applied
Item                                                                       Content
                                                                                            in this system (30 m × 250 µm inner diameter, 0.25 µm film
Ingredients                                                                                 thickness (J&W Scientific, Folsom, CA, United States). Analyte
Wheat                                                                        64.53          injection volume was one µL with splitless mode. The carrier
Soybean meal                                                                 28.52          gas was helium, the purge flow at the front inlet was 3 mL/min,
Soybean oil                                                                   2.89          and the gas flow rate through the column was 1 mL/min. The
Dicalcium phosphate                                                           1.97          initial temperature was kept at 80◦ C for 1 min, then raised to
Limestone                                                                     0.93          290◦ C at a rate of 10◦ C/min, then held at 290◦ C for 12 min.
Sodium chloride                                                               0.35          The temperatures in injection, transfer line, and ion source were
Choline chloride (50%)                                                        0.25          280, 295, and 220◦ C, respectively. In the electron impact mode,
L-Lys HCl                                                                     0.17          the energy was −70 eV. After a 7 min delay in the solvent, mass
Trace minerala                                                                0.20          spectrometry data were acquired at a rate of 12 spectra per second
DL-methionine (Met)                                                           0.14          in full-scan mode with the m/z range of 50–600.
Ethoxyquin                                                                    0.03
Vitamin premixb                                                               0.03          Metabolome Data Analysis
Total                                                                       100.00          Chroma TOF 4.3X software and LECO-Fiehn Rtx5 database
Calculated composition                                                                      (LECO Corp, St. Joseph, MI, United States) were used to extract
ME, Mcal/kg                                                                   2.90
                                                                                            raw peaks, filter and calibrate data baselines, align peak, analyze
CP                                                                           21.50
                                                                                            deconvolution, identify peak and integrate the peak area (Kind
Available Phosphorus (P)                                                      0.45
                                                                                            et al., 2009). Peaks were identified by retention time index (RI),
Calcium (Ca)                                                                  1.00
                                                                                            with a RI tolerance of 5000. The obtained three-dimensional
Lysine                                                                        1.10
                                                                                            data including the peak number, sample name, and normalized
Met + Cysteine (Cys)                                                          0.93
                                                                                            peak area were processed by SIMCA14.1 software package
Threonine                                                                     0.82
                                                                                            (V14.1, MKS Data Analytics Solutions, Umea, Sweden) for
a The trace minerals supplied the following per kilogram of feed: copper, 8 mg; zinc,       principal component analysis (PCA) and orthogonal projections
75 mg; iron, 80 mg; manganese, 100 mg; selenium, 0.15 mg; and iodine, 0.35 mg.              to latent structures-discriminate analysis (OPLS-DA). In OPLS-
b The vitamin premix supplied the following per kilogram of complete feed: vitamin A,

12 500 IU; vitamin D3 , 2500 IU; vitamin K3 , 2.65 mg; vitamin B1 , 2 mg; vitaminB2 ,
                                                                                            DA model, the first principal component of variable importance
6 mg; vitamin B12 , 0.025 mg; vitamin E, 30 IU; biotin, 0.0325 mg; folic acid,              in the projection (VIP) values exceeding 1.0 are most relevant
1.25 mg; pantothenic acid, 12 mg; and niacin, 50 mg.                                        and were first selected as changed metabolites. The remaining
                                                                                            variables were then assessed by Student’s t-test (P-value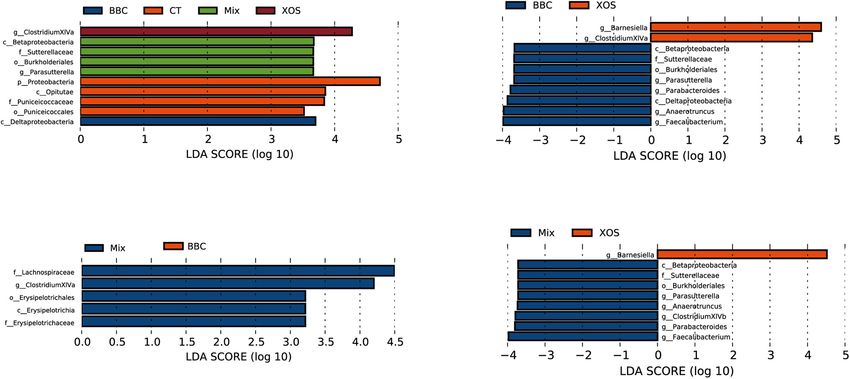
Wu et al.                                                                                                                   Pediococcus and Oligosaccharides on Broilers

(Masella et al., 2012). The USEARCH (v7.0.1090) in QIIME                                 viscosity of jejunum than the CT group (P < 0.05). However,
software was applied to cluster the quality-filtered sequences                           there was no statistical difference in ileum pH (Table 3). XOS
into 97% operational taxonomic units (OTUs). Each OTU was                                supplementation had no effect on jejunum chyme viscosity, but
classified by the Ribosomal Database Project (RDP) algorithm                             significantly decreased the pH value of cecum (P < 0.05).
trained on the Greengenes database.4 The alpha diversity was
determined by the software package QIIME.5                                               Contents of Lactic Acid and SCFA in
                                                                                         Cecum Chyme
16S rDNA Analysis                                                                        The MIX treatment significantly increased the content of butyric
The Wilcoxon rank sum test was used to assess alpha diversity                            acid in cecal chyme (P < 0.05). However, the addition of XOS and
among the four treatment groups. Venn diagrams were built                                BBC had no effect on the content of each kind of SCFA (except
by Venn Diagram package in R v3.1.0. Principal component                                 butyric acid) and total acid production of the cecum (Table 4).
analysis (PCA) was applied to evaluate the relationships
between samples based on the composition of the microbiota                               Intestinal Morphology
(Sanders et al., 2015). A linear discriminant analysis (LDA)
                                                                                         In the duodenum, the XOS group had a higher villus height
effective size (LEfSe) was used to further compare the relative
                                                                                         than BBC group (P < 0.05). In the ileum, MIX group showed a
abundance profiles of bacteria between two groups (Segata
                                                                                         significant higher V/C ratio than CT, XOS and BBC group. Also,
et al., 2011). Taxonomic units with a log LDA score >2
                                                                                         the MIX group had a higher ileum villus height than the BBC
were determined to be significant differences in abundance.
                                                                                         group. Besides, the muscular layer thickness in the MIX group
Phylogenetic identification of communities by reconstruction of
                                                                                         was lower than CT and BBC group (Table 5).
unobserved states (PICRUSt) was applied to predict function
composing of metagenomic communities based on 16S rDNA
(Langille et al., 2013). The metagenomic reads were submitted to
                                                                                         Microbiota of Cecum Chyme
                                                                                         In PCA analysis, there is a clear separation among the four
the NCBI-SRA database under accession number PRJNA592830.
                                                                                         groups. Broilers fed a diet with both XOS and P. acidilactici
                                                                                         BCC-1 (MIX) had lower alpha diversity than the control group.
RESULTS                                                                                  Furthermore, the MIX group showed a higher alpha diversity
                                                                                         than either XOS or BBC groups (Figure 1). Compared with the
Growth Performance                                                                       CT group, all 3 treatment groups (XOS, BBC and MIX) showed
The effect of XOS and P. acidilactici BCC-1 supplementation on                           a higher abundance of Firmicutes and lower Proteobacteria at
the growth performance of broilers is shown in Table 2. The feed                         phylum level (Figure 2A). At genus level, all 3 treatment groups
conversion ratio of BBC group, XOS group and MIX group was                               showed higher abundance of Megamonas and lower abundance
lower than that of the control group (P < 0.05). However, there                          of Campylobacter (Figure 2B).
was no significant difference among groups in body weight gain                              The LEfSe analysis showed MIX group enriched
and feed intake.                                                                         Lachnospiraceae and Oscillibacter while CT group enriched
                                                                                         multiple pathogenic bacteria including Campylobacter and
Chyme Viscosity of Jejunum and pH                                                        Proteobacteria (Figure 2C). The XOS group enriched butyric
                                                                                         bacteria Clostridiaceae XIVa whereas pathogenic bacteria
Value of Ileum and Cecum
                                                                                         Proteobacteria enriched in CT group (Figure 2D). Compared
The cecum pH in XOS, BBC and MIX group were lower than
                                                                                         with BBC group, the CT group enriched Proteobacteria as
CT group. Also, BBC and MIX had a lower value of chyme
                                                                                         well (Figure 2E).
4
    http://greengenes.lbl.gov                                                               When compared among all groups, enrichment species
5
    http://qiime.org                                                                     in XOS group and BBC treatment groups were Clostridium

TABLE 2 | The effect of XOS and Pediococcus acidilactici BCC-1                           TABLE 3 | The effect of XOS and Pediococcus acidilactici BCC-1
supplementation on growth performance of broilers from 1–21 d.                           supplementation on pH value and chyme viscosity of broilers on d 21.

Treatment1                 BWG (g)                FI (g)                FCR              Treatment1      pH of ileum      pH of cecum       Chyme viscosity of jejunum

CT                     621.03 ± 13.68        975.73 ± 23.94         1.57 ±   0.02b       CT              5.87 ± 0.07      5.83 ±   0.18b             1.51 ± 0.02b
XOS                    621.63 ± 13.68        946.57 ± 12.04         1.53 ±   0.01a       XOS             6.27 ± 0.22      5.18 ±   0.12a             1.52 ± 0.01b
BBC                    628.56 ± 28.92        959.18 ± 14.33         1.53 ±   0.01a       BBC             6.11 ± 0.1       5.12 ±   0.1a              1.43 ± 0.02a
MIX                    649.18 ± 14.55        982.60 ± 20.52         1.51 ± 0.02a         MIX             6.11 ± 0.16      5.22 ± 0.12a               1.38 ± 0.03a
P-value                     0.151                 0.166                 0.028            P value            0.284             0.004                    0.002
a,b Means in the same row without common superscripts are significantly different        a,b Means in the same row without common superscripts are significantly different
(P < 0.05).                                                                              (P < 0.05).
1 CT: Basal diet (0% XOS and 0 cfu/kg P. acidilactici BCC-1); XOS: Basal diet plus       1 CT: Basal diet (0% XOS and 0 cfu/kg P. acidilactici BCC-1); XOS: Basal diet plus

0.15% XOS; BBC: Basal diet plus 109 cfu/kg P. acidilactici BCC-1; MIX: Basal diet        0.15% XOS; BBC: Basal diet plus 109 cfu/kg P. acidilactici BCC-1; MIX: Basal diet
plus 0.15% XOS and 109 cfu/kg P. acidilactici BCC-1.                                     plus 0.15% XOS and 109 cfu/kg P. acidilactici BCC-1.

Frontiers in Microbiology | www.frontiersin.org                                      4                                               May 2021 | Volume 12 | Article 683905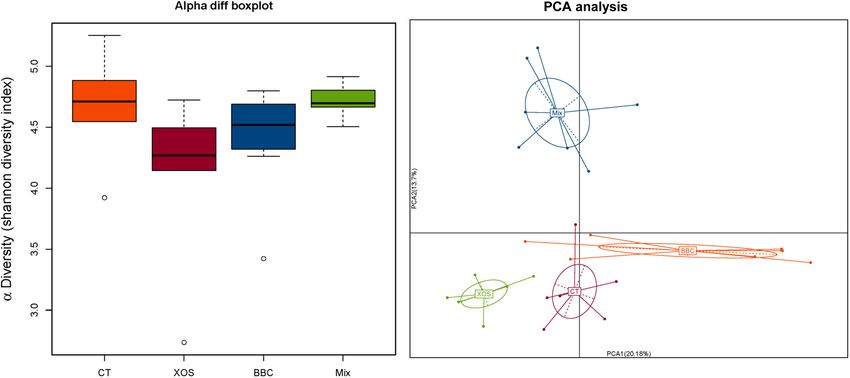
Wu et al.                                                                                                               Pediococcus and Oligosaccharides on Broilers

TABLE 4 | The effect of XOS and Pediococcus acidilactici BCC-1 supplementation on the production of lactic acid and SCFA in cecum chyme of broilers
on d 21 (mmol/g).

Treatment1         Lactic acid         Methanoic acid         Acetic acid          Propionic acid          Butyric acid        Pentanoic acid        Total content

CT               468.92 ± 118.8        72.19 ± 13.22       2555.67 ± 296.45       1850.01 ± 275.10      783.10 ±   123.08a     118.45 ± 19.28       5905.03 ± 477.62
XOS              887.99 ± 425.24       63.37 ± 9.52        2538.54 ± 178.08       2000.15 ± 210.76      714.71 ± 62.56a        111.42 ± 18.08       6390.53 ± 412.11
BBC              947.19 ± 292.64       37.69 ± 13.76       2712.74 ± 131.63       2341.76 ± 161.38      946.21 ± 75.78ab       101.17 ± 8.42        7145.26 ± 339.36
MIX              138.63 ± 64.75        55.46 ± 10.26       3217.53 ± 175.41       1926.60 ± 222.96     1103.85 ± 111.87b       132.67 ± 19.40       6669.99 ± 184.04
P value                0.176                 0.231               0.091                  0.440                  0.033                 0.631               0.161

        in the same row without common superscripts are significantly different (P < 0.05).
a,b Means
1 CT:
    Basal diet (0% XOS and 0 cfu/kg P. acidilactici BCC-1); XOS: Basal diet plus 0.15% XOS; BBC: Basal diet plus 109 cfu/kg P. acidilactici BCC-1; MIX: Basal diet plus
0.15% XOS and 109 cfu/kg P. acidilactici BCC-1.

XIVa and Deltaproteobacteria, respectively. The enrichment                                There were 12 metabolites that were significantly different
bacteria in the MIX group were β-Proteobacteria, Sutterellaceae,                      between XOS and CT treatment groups (Supplementary
Burkholderia and Parasutterella. In contrast, the Proteobacteria,                     Appendix Table 1). Compared with the CT group, XOS groups
Opitutae, Puniceicoccaceae and Puniceicoccales were enriched in                       showed higher concentrations of 4-hydroxyphenylpyruvate 1,
the control group (Figure 3A).                                                        O-acetylserine 1, pyridoxine and glycine-proline while has lower
   Compared with the BBC group, the XOS treatment                                     contents of sorbitol, gluconic acid and salicylaldehyde. In
enriched Barnesiella and Clostridium XIVa. In contrast, β-                            contrast, BBC group has higher concentrations of myo-inositol,
Proteobacteria, Sutterellaceae, Burkholderiales, Parasutterella,                      purine riboside, 2-hydroxy-3-isopropylbutanedioic acid, 3-(3-
Parabacteroides,       Deltaproteobacteria,       Anaerotruncus                       hydroxyphenyl) propionic acid, O-acetylserine 1 and pyridoxine
and Faecalibacterium were enriched in the BBC group                                   whereas has lower levels of succinic acid, citramalic acid, 3,4-
(Figure 3B). The MIX group enriched Lachnospiraceae,                                  dihydroxybenzoic acid, xanthine and various carbohydrates such
Clostridiaceae    XIVa,     Erysipelotrichales,   Erysipelotrichia                    as sorbitol, xylose 1, D-arabitol and lyxose 1when compared to
and Erysipelotrichaceae when compared with BBC group                                  the CT group (Supplementary Appendix Table 2). Interestingly,
(Figure 3C). Compared with the XOS treated group, the MIX                             both the XOS and BBC groups showed higher concentrations of
group enriched Anaerotruncus, Parabacteroides, Clostridium                            O-acetylserine 1 and pyridoxine while had lower concentrations
XIVb, Sutterellaceae, Burkholderiales, Parasutterella, β-                             of sorbitol, salicylaldehyde, palmitoleic acid and gluconic acid 1
Proteobacteria and Fusobacterium. In contrast, Barnesiella,                           when compared with the CT group.
Streptococcus and Streptococcaceae were enriched in the XOS                               There were 32 metabolites there were significantly different
group (Figure 3D).                                                                    between the MIX and CT treatment groups (Table 6). The
   Compared with the control group, microbial functional                              concentrations of allo-insoitol and 4-hydroxyphenylpyruvate
genes in XOS group were enriched in the pathways including                            1 in the MIX group was massively higher than in the CT
transporters, ABC transporters, amino sugar and nucleotide                            group. Some other higher metabolites include elaidic acid, 3-(4-
sugar metabolism, galactose metabolism, pentose phosphate                             hydroxyphenyl) propionic acid, 3-(3-hydroxyphenyl) propionic
pathway and pentose and glucuronate interconversions                                  acid and inosine. MIX group has lower concentrations of
(Supplementary Figure 1A). Genes related to galactose                                 pentadeconic acid, succinic acid, citramalic acid, salicylaldehyde
metabolism and amino sugar and nucleotide sugar metabolism                            and multiple carbohydrates including sorbitol, xylose 1,
were enriched in BBC group as well. BBC group enriched genes                          cellobiose 1, fucose 1, D-arabitol and lyxose 1 than the CT group.
involved in glycine, serine and threonine metabolism, vitamin                         It should be pointed out that all the treatment groups (XOS, BBC
B6 metabolism, cysteine and methionine metabolism, arginine                           and MIX) have lower concentrations of sorbitol, palmitoleic acid
and proline metabolism and fructose and mannose metabolism                            and salicylaldhyde than control group.
pathways (Supplementary Figure 1B). For MIX group, genes                                  Compared to the XOS group, the MIX group showed
were mapped on carbohydrate metabolism, transcription                                 higher concentrations of 5-hydroxyindole-3-acetic acid (over 3
and xenobiotics biodegradation and metabolism pathways                                million-fold higher), 2-butyne-1,4 diol, 2-butyne-1,4-diol and
(Supplementary Figure 1C).                                                            DL-p-hydroxyphenyllactic acid while has lower level of 3,4-
                                                                                      dihydroxybenzoic acid and pentadecanoic acid (Supplementary
                                                                                      Appendix Table 3). Supplementary Appendix Table 4 shows
Metabolites Composition of Cecum                                                      the comparison between the BBC and MIX treatment groups.
Chyme                                                                                 MIX group has almost 3 million folds higher level of gluconic
The samples from each treatment group are well-differentiated                         acid was than BBC group. Other notable metabolites that
and all samples are within the 95% confidence interval                                were significantly higher in the MIX group were xanthine,
(Hotelling’s T-squared ellipse), indicating a clear difference in                     pantothenic acid and urea. Compared with BBC group,
cecal chyme among the 4 treatment groups (Figure 4A). We have                         MIX group has lower concentrations of pentadecanoic acid
detected a total of 550 effective peaks and flited by quality control                 and multiple carbohydrates such as fucose 1, sophorose 2
to retain 498 metabolites.                                                            and isomaltose 2.

Frontiers in Microbiology | www.frontiersin.org                                   5                                             May 2021 | Volume 12 | Article 683905
Wu et al. Pediococcus and Oligosaccharides on Broilers
Basal diet (0% XOS and 0 cfu/kg P. acidilactici BCC-1); XOS: Basal diet plus 0.15% XOS; BBC: Basal diet plus 109 cfu/kg P. acidilactici BCC-1; MIX: Basal diet plus 0.15% XOS and 109 cfu/kg P. acidilactici BCC-1.
From the pathway enrichment analysis, ubiquinone and other
thickness
Muscular
729.21 ±
697.63 ±
713.62 ±
670.66 ±
terpenoid-quinone biosynthesis, phenylalanine, tyrosine and
13.96ab
14.34b
13.16a
0.015
layer
6.97b
(µm)
tryptophan biosynthesis, sulfur metabolism, lysine biosynthesis,
sphingolipid metabolism, lysine degradation and tyrosine
metabolism were enriched in the XOS treatment group
compared with the CT group (Figure 4B). The pathways
V/C ratio
4.38 ±
4.39 ±
4.50 ±
4.96 ±
0.028
0.16b
0.16a
0.12a
0.11a
enriched in the BBC group compared with CT group include
lysine biosynthesis, arginine and proline metabolism, lysine
degradation and pyrimidine metabolism (Figure 4C). The major
ileum
pathways enriched in the MIX group compared with the CT
Crypt depth
235.19 ±
231.87 ±
216.73 ±
214.25 ±
group are ubiquinone and other terpenoid-quinone biosynthesis,
0.055
(µm)
7.71
6.94
4.18
4.84
propanoate metabolism, citrate cycle, alanine, aspartate and
glutamate metabolism, tyrosine metabolism and arginine and
proline metabolism (Figure 4D). The major enriched pathways
Villus height
between the XOS and MIX group were tryptophan metabolism,
1013.26 ±
1011.92 ±
1056.50 ±
970.59 ±
17.92ab
20.22ab
24.02b
17.85a
0.047
(µm)
sphingolipid metabolism and arginine and proline metabolism
(Figure 4E) and that between MIX and BBC groups were arginine
and proline metabolism, cysteine and methionine metabolism,
galactose metabolism and pyrimidine metabolism (Figure 4F).
thickness
Muscular
684.91 ±
708.35 ±
732.70 ±
682.81 ±
15.81
16.40
22.22
12.96
0.156
layer
(µm)
DISCUSSION
In the current study, the FCR in the XOS, BBC and MIX groups
V/C ratio
TABLE 5 | The effect of XOS and Pediococcus acidilactici BCC-1 supplementation on intestinal morphology of broilers on d 21.
4.81 ±
4.78 ±
4.73 ±
4.76 ±
0.986
0.11
0.17
0.15
0.19
were lower than the control group, indicating that the dietary
supplementations improved feed efficiency. The concomitant
Jejunum
reduction in cecal pH and decreased jejunal chyme viscosity
after XOS and BBC supplementation points to improved gut
Crypt depth
218.56 ±
217.98 ±
207.75 ±
216.50 ±
fermentation. Our previous study has shown that P. acidilactici
0.570
(µm)
4.46
8.37
5.62
5.79
BCC-1 proliferated when given with XOS (Lei et al., 2016).
Therefore, BBC and XOS may play a synergistic role. In the
current study, the MIX treatment increased the content of
Villus height
butyric acid and improved gut morphology by increasing the
1048.22 ±
1035.35 ±
1023.25 ±
977.13 ±
in the same row without common superscripts are significantly different (P < 0.05).
24.94
34.59
22.20
31.10
0.323
(µm)
V/C ratio of ileum. The muscular layer thickness of ileum
was significantly lower than CT as well. A previous study
found wetting diets based on cereal grains caused decreased
viscosity of gut contents, which accompanied by the reduced
thickness
Muscular
705.92 ±
686.45 ±
713.42 ±
751.72 ±
thickness of the muscular layer of these segments (Yasar and
14.17
11.71
39.51
27.53
0.334
layer
(µm)
Forbes, 1999). In current study, we also found MIX group
showed lower viscosity of jejunum. Thus, reduced muscular
layer thickness in MIX group may due to the lower viscosity
of gut contents.
V/C ratio
4.68 ±
4.66 ±
4.57 ±
4.74 ±
0.888
0.11
0.14
0.18
0.16
P. acidilactici BCC-1 belongs to genus Pediococcus, but our
microbiota data haven’t found Pediococcus in our BBC or MIX
duodenum
group. The previous study showed that Pediococcus only be
detectable in chicks (3–4 days old) through 16S sequencing
Crypt depth
209.50 ±
226.93 ±
204.84 ±
216.99 ±
(Ocejo et al., 2019). Thus, the abundance of Pediococcus in our 21-
0.056
(µm)
3.67
6.21
6.35
7.03
day old chicken may lower than detection threshold. But the PCA
analysis indicates XOS or BBC treatment dramatically altered
gut microbiome. Compared with CT group, all 3 treatment
Villus height
1053.00 ±
1023.27 ±
groups (XOS, BBC and MIX) showed lower Proteobacteria and
975.21 ±
928.03 ±
10.75ab
33.99ab
28.80b
24.61a
0.006
(µm)
MIX also had lower Campylobacter. The phylum Proteobacteria
contains many pathogens, including Escherichia, Salmonella and
Helicobacter (Wu et al., 2020). Campylobacter is the leading
Treatment
causative agent of human bacterial enteritis and over 50% of
a,b Means
P value
poultry meat worldwide is contaminated with Campylobacter
BBC
XOS
1 CT:
MIX
CT
(Suzuki and Yamamoto, 2009). Thus, BBC and XOS treatment
Frontiers in Microbiology | www.frontiersin.org 6 May 2021 | Volume 12 | Article 683905Wu et al. Pediococcus and Oligosaccharides on Broilers FIGURE 1 | The α diversity (A) and Principal Component Analysis (PCA) (B) of cecal microbiota among four groups. CT group, control group with basal diet; XOS group, basal diet plus 0.15% XOS; BBC group, basal diet plus 109 cfu/kg P. acidilactici BCC-1; MIX group, basal diet plus 0.15% XOS and 109 cfu/kg P. acidilactici BCC-1. FIGURE 2 | Relative abundance of the dominant bacterial communities at phylum (A) and genus (B) level and log-transformed linear discriminant analysis (LDA) scores of the significant biomarkers of MIX vs CT group (C), XOS vs CT group (D) and BBC vs CT group (E). Frontiers in Microbiology | www.frontiersin.org 7 May 2021 | Volume 12 | Article 683905
Wu et al.                                                                                                         Pediococcus and Oligosaccharides on Broilers

  FIGURE 3 | LDA scores of the significant biomarkers among four groups (A), BBC vs XOS group (B), MIX vs BBC group (C) and MIX vs XOS group (D).

could improve poultry health and food safety by reducing the                      and fructose and mannose, which may favor the nutrients
abundance of intestinal pathogenic bacteria.                                      utilization of broilers.
   Compared with the BBC group, the XOS treatment enriched                           The MIX group enriched Lachnospiraceae and Clostridiaceae
Barnesiella and Clostridium XIVa. Clostridium XIVa contains a                     XIVa when compared with BBC group. Compared with the
gene encoding butyryl CoA-acetyl CoA transferase and butyryl                      XOS treated group, the MIX group enriched Anaerotruncus,
CoA-lactate transferase that can convert acetic acid and lactic                   Parabacteroides and Clostridium XIVb. Members of the
acid to butyric acid (Van den Abbeele et al., 2013). In a                         Lachnospiraceae are able to utilize lactate and acetate to produce
mice study, supplementation of prebiotic milk oligosaccharides                    butyrate via the butyryl-CoA or acetate CoA transferase
increased the abundance of Barnesiella, which could render                        pathways or the butyrate kinase pathway (Flint et al., 2015).
the intestinal milieu less prone to inflammation (Weiss et al.,                   In addition to producing butyrate, Lachnospiraceae also plays
2014). Also, Barnesiella bacteria can eliminate and protect against               a role in the biosynthesis of vitamin B12 and may exert a
intestinal antibiotic-resistant pathogenic bacteria in hospitalized               protective role in suppressing Clostridium difficile colonization
patients (Ubeda et al., 2013). Therefore, increased abundance of                  in the gastrointestinal tract (Reeves et al., 2012). The microbial
Clostridium XIVa and Barnesiella may favor the SCFA production                    functional genes in the MIX group were involved in carbohydrate
and enhance the anti-inflammatory capability of broilers. In                      metabolism which could improve gut health and increase the
microbial functional analysis, genes involved in transporters,                    biosynthesis of nutrients.
ABC transporters were enriched in the XOS group. ABC                                 Both the XOS and BBC groups showed higher O-acetylserine
transporters play crucial roles in the uptake of XOS (Ejby et al.,                1 and pyridoxine levels than the control group. Pyridoxine is
2013). Therefore, the increased genes related to ABC transporters                 the cofactor cysteine metabolism and treatment with pyridoxine
may favor bacteria to utilize prebiotic XOS.                                      combined with folic acid normalized the serum homocysteine
   In     contrast,     Parabacteroides,    Anaerotruncus      and                levels of hyperhomocysteinaemia patients (Buchel et al., 2005).
Faecalibacterium were enriched in the BBC group.                                  Pyridoxine can also protect against cell injuries through its direct
Parabacteroides supplementation enhanced intestinal barrier                       antioxidant activity (Roh et al., 2018). The gut microbiota is
integrity of mice (Koh et al., 2019) and attenuated experimental                  an essential source of B-vitamins and increase in pyridoxine
murine colitis through modulation of immunity (Kverka                             in XOS and BBC groups may provide essential nutrient for
et al., 2011). Both Anaerotruncus and Faecalibacterium are                        the growth of broilers. Additionally, microbial functional genes
butyrate-producing bacteria (Wang et al., 2018). Besides,                         showed both amino sugar and nucleotide sugar metabolism
Faecalibacterium is a critical player in the maintenance of                       and galactose metabolism were enriched in the XOS and BBC
intestinal and systemic host health (Rios-Covian et al., 2015).                   groups. The amino sugar and nucleotide sugar metabolism
Thus, BBC supplementation potentially enhanced the gut barrier                    product such as N-acetyl-D-glucosamine stabilizes the intestinal
function and anti-inflammatory capability of broilers. Moreover,                  mucosal barrier by recovering intestinal epithelial cells and
microbial genes in BBC group were mapped onto glycine, serine                     reducing gut permeability (Zhao et al., 2011). Both BBC and
and threonine metabolism, vitamin B6 metabolism, cysteine                         XOS group decreased concentrations of carbohydrate sorbitol. It
and methionine metabolism, arginine and proline metabolism                        indicates BBC and XOS may accelerate microbial fermentation.

Frontiers in Microbiology | www.frontiersin.org                               8                                          May 2021 | Volume 12 | Article 683905
Wu et al.                                                                                                            Pediococcus and Oligosaccharides on Broilers

  FIGURE 4 | Score scatter plot for PCA model of four groups (A) and differential metabolites enriched metabolism pathways of XOS vs CT (B), BBC vs CT (C), MIX
  vs CT (D), MIX vs XOS (E) and MIX vs BBC (F).

Frontiers in Microbiology | www.frontiersin.org                                 9                                            May 2021 | Volume 12 | Article 683905
Wu et al.                                                                                                               Pediococcus and Oligosaccharides on Broilers

It has been reported that sorbitol supplementation results in                               acid metabolism and simultaneously curtail the growth of
selective enrichment of Lactobacillus and increased butyrate                                Lactobacillus.
levels in rat intestine (Sarmiento-Rubiano et al., 2007). Therefore,                            The BBC group enriched 2-hydroxy-3-isopropylbutanedioic
supplementation with XOS could potentially improve amino                                    acid, (2R,3S)-2-hydroxy-3-isopropylbutanedioic acid and 3-(3-
                                                                                            hydroxyphenyl) propionic acid and myo-inositol. Similarly,
                                                                                            the MIX group enriched allo-inositol and 3-(3-hydroxyphenyl)
TABLE 6 | Differential metabolites in MIX and CT group.                                     propionic acid as well. Inositol is a growth factor for animals
                                                                                            and microorganisms. It is able to form glucuronic acid
Metabolites                               VIP         P value         Fold change
                                                                                            via inositol oxidase, which is involved in the host sugar
Allo-inositol                             1.71         0.044              25.03             metabolism process and is further degraded to SCFA (Croze
4-Hydroxyphenylpyruvate 1                 1.61         0.016              15.31             and Soulage, 2013). The 3-(3-hydroxyphenyl)-propionic acid can
Elaidic acid                              1.29         0.001               4.80             be produced by Clostridium bacteria (Rechner et al., 2004).
3-(4-hydroxyphenyl) propionic acid        2.09        0.0005               3.94             Recently study found this microbial metabolite has a strong
3-(3-hydroxyphenyl) propionic acid        2.01        0.0009               3.25
                                                                                            antioxidative capacity and can prevent Cd-induced biotoxicity
2-Hydroxyvaleric acid                     1.91         0.015               2.55
                                                                                            (Cheng et al., 2021). The concentrations of 3-hydroxy-3-
N-Carbamylglutamate 4                     1.17         0.025               2.34
Alpha-Aminoadipic acid                    2.03        0.0001               2.30
                                                                                            methylglutaric acid, succinic acid and multiple carbohydrates
Indole-3-acetamide 2                      1.92        0.0004               2.28             including sorbitol, xylose 1, D-arabitol and lyxose 1 in the BBC
Inosine                                   1.30         0.031               2.18             and MIX group were lower than CT group. The 3-hydroxy-
Levoglucosan                              1.75         0.021               0.29             3-methylglutaric acid promotes lipid and protein oxidative
Cellobiose 1                              1.12         0.048               0.27             damage, reduces antioxidant defenses and impairs energy
Fucose 1                                  1.67         0.007               0.24             production in rats (Leipnitz et al., 2008; da Rosa et al., 2016).
Trans-4-hydroxy-L-proline 2               1.25         0.002               0.22             Gut microbiota-produced succinic acid has been shown to
3-Methylglutaric Acid                     1.80         0.002               0.17             depress the proliferation rate of the epithelial cells in the
N-Acetyl-beta-D-mannosamine 3             1.25         0.010               0.09
                                                                                            colon, as well as reducing the crypt size (Inagaki et al.,
Stearic acid                              2.47        0.0005              0.039
                                                                                            2007). Succinate has been shown to accumulate in the large
4-Hydroxyphenylacetic acid                2.26        0.0002              0.036
Xylose 1                                  2.17         0.029            3.09E-07
                                                                                            intestine of pigs with antibiotic-associated diarrhea (Tsukahara
Oleic acid                                2.27         0.023            2.24E-07            and Ushida, 2002). Therefore, decreased concentrations of 3-
Sorbitol                                  1.72         0.017            2.10E-07            hydroxy-3-methylglutaric acid and succinate tend to prevent
Salicylaldehyde                           1.72         0.030            1.88E-07            inflammation and maintain the gut health of broilers. Our
Palmitoleic acid                          2.42         0.005            1.67E-07            previous study has been demonstrated P. acidilactici BCC-
2-Deoxyerythritol                         2.04         0.003            1.40E-07            1 can effectively use xylose as an energy source (Lei et al.,
Cis-Phytol                                2.73        0.0002            1.13E-07            2018) and other study found some Pediococcus acidilactici
D-Arabitol                                2.50         0.012            8.23E-08            strains could utilize D-arabitol (Wang et al., 2019). Also,
Lyxose 1                                  1.86         0.028            6.96E-08
                                                                                            some Pediococcus species such as Pediococcus parvulus can
3-Hydroxy-3-methylglutaric acid           2.24         0.035            4.77E-08
                                                                                            effectively use sorbitol (Pérez-Ramos et al., 2017). Thus,
3,4-Dihydroxybenzoic acid                 2.49       5.32E-05           4.69E-08
Citramalic acid                           1.88         0.009            3.23E-08
                                                                                            BBC and MIX group may promote microbial carbohydrates
Succinic acid                             1.81         0.030            1.48E-08            fermentation. Compared with BBC group, MIX group has lower
Pentadecanoic acid                        2.54        0.0006            8.68E-09            carbohydrates of fucose 1, sophorose 2 and isomaltose 2. It
                                                                                            suggests combined supplementation of both XOS and BBC
VIP, Variable Importance in Projection; P value calculated by Student’s t test; Fold
Change >2 or ≤0.3. If Fold change >1, it means that this metabolite is higher in            may have synergistic effect to further improve the microbial
the MIX group than that in the CT group; Vice versa.                                        fermentation of carbohydrate.

  FIGURE 5 | Graphic abstract of the influence of XOS and BBC treatment on cecal microbiota and metabolome of broilers.

Frontiers in Microbiology | www.frontiersin.org                                        10                                      May 2021 | Volume 12 | Article 683905
Wu et al. Pediococcus and Oligosaccharides on Broilers
The metabolite 4-hydroxyphenylpyruvate 1, a precursor of ETHICS STATEMENT
tyrosine (Klein et al., 2016) was enriched largely in the XOS
and MIX group. Concomitantly, metabolome results showed The animal study was reviewed and approved by the animal
both XOS and MIX group enriched in tyrosine metabolism experiments involved in this study were approved by the
pathway. The exact role of 4-hydroxyphenylpyruvate 1 is China Agriculture University Animal Care and Use Committee
not well-known, but recently clinical study found baseline in Beijing, China.
plasma levels 4-hydroxyphenylpyruvate were associated with a
beneficial response on fecal microbiota transplantation (de Groot
et al., 2020). The 4-hydroxyphenylpyruvate can be reduced to
p-hydroxyphenyllactic acid by several beneficial bacteria such
AUTHOR CONTRIBUTIONS
as Lactobacillus (González et al., 2017). In our study, the level JY and ZL designed this research. YWu, ZL, YWa, and DY
of DL-p-hydroxyphenyllactic acid in MIX group was 7.4-fold conducted the experiments. YWu, ZL, and YWa analyzed the
higher than XOS group. It indicates BBC may have the ability data and wrote the draft of the manuscript. JY, SA, and YG
to transform 4-hydroxyphenylpyruvate to hydroxyphenyllactic checked and revised the manuscript. All authors contributed to
acid. The p-hydroxyphenyllactic acid has already been identified the article and approved the submitted version.
as an antioxidant compound by a radical-scavenging assay
(Suzuki et al., 2013). Thus, compared with the sole addition of
XOS, combined supplementation of both XOS and BBC may have
synergistic effect to improve antioxidative ability of broilers. FUNDING
This research was supported by the National Natural Science
CONCLUSION Foundation of China (No, 31572424).
In summary, both XOS and BBC can improve the feed
efficiency of broilers. Microbiota and metabolome analysis
showed combined supplementation of XOS and BBC decreased ACKNOWLEDGMENTS
pathogenic bacteria, increased butyrate bacteria and promotes
carbohydrate fermentation. Thus, XOS and BBC may have a We thank Biotree Biotech Co., Ltd. (Shanghai, China) for
synergistic role and combined supplementation of XOS and BBC assistance with metabonomic analysis.
may gain advantages of both XOS and BBC, which improve
the performance of broilers by modulating gut microbiota and
metabolome (Figure 5). SUPPLEMENTARY MATERIAL
The Supplementary Material for this article can be found
DATA AVAILABILITY STATEMENT online at: https://www.frontiersin.org/articles/10.3389/fmicb.
The datasets presented in this study can be found in online 2021.683905/full#supplementary-material
repositories. The names of the repository/repositories and Supplementary Figure 1 | LEfSe (Linear discriminant analysis effect size) analysis
accession number(s) can be found below: https://www.ncbi.nlm. of functional pathways of broiler cecum between XOS and control groups (A);
nih.gov/, PRJNA592830. between BBC and control groups (B); between MIX and control groups (C).
REFERENCES Croze, M. L., and Soulage, C. O. (2013). Potential role and therapeutic interests
of myo-inositol in metabolic diseases. Biochimie 95, 1811–1827. doi: 10.1016/j.
Aggrey, S. E., Milfort, M. C., Fuller, A. L., Yuan, J., and Rekaya, R. (2019). biochi.2013.05.011
Effect of host genotype and Eimeria acervulina infection on the metabolome da Rosa, M. S., Seminotti, B., Ribeiro, C. A., Parmeggiani, B., Grings, M., Wajner,
of meat-type chickens. PLoS One 14:e0223417. doi: 10.1371/journal.pone.022 M., et al. (2016). 3-Hydroxy-3-methylglutaric and 3-methylglutaric acids impair
3417 redox status and energy production and transfer in rat heart: relevance for
Buchel, O., Roskams, T., Van Damme, B., Nevens, F., Pirenne, J., and Fevery, J. the pathophysiology of cardiac dysfunction in 3-hydroxy-3-methylglutaryl-
(2005). Nodular regenerative hyperplasia, portal vein thrombosis, and avascular coenzyme A lyase deficiency. Free Radic. Res. 50, 997–1010. doi: 10.1080/
hip necrosis due to hyperhomocysteinaemia. Gut 54, 1021–1023. doi: 10.1136/ 10715762.2016.1214952
gut.2004.055921 de Groot, P., Scheithauer, T., Bakker, G. J., Prodan, A., Levin, E., Khan,
Calik, A., and Ergun, A. (2015). Effect of lactulose supplementation on growth M. T., et al. (2020). Donor metabolic characteristics drive effects of faecal
performance, intestinal histomorphology, cecal microbial population, and microbiota transplantation on recipient insulin sensitivity, energy expenditure
short-chain fatty acid composition of broiler chickens. Poult. Sci. 94, 2173–2182. and intestinal transit time. Gut 69, 502–512. doi: 10.1136/gutjnl-2019-318320
doi: 10.3382/ps/pev182 De Maesschalck, C., Eeckhaut, V., Maertens, L., De Lange, L., Marchal, L., Nezer,
Cheng, D., Song, Q., Ding, Y., Yu, Q., Liu, Y., Tian, X., et al. (2021). Comparative C., et al. (2015). Effects of xylo-oligosaccharides on broiler chicken performance
study on the protective effect of chlorogenic acid and 3-(3-Hydroxyphenyl) and microbiota. Appl. Environ. Microbiol. 81, 5880–5888. doi: 10.1128/aem.
propionic acid against cadmium-induced erythrocyte cytotoxicity: in vitro and 01616-15
in vivo evaluation. J. Agric. Food Chem. 69, 3859–3870. doi: 10.1021/acs.jafc. Ejby, M., Fredslund, F., Vujicic-Zagar, A., Svensson, B., Slotboom, D. J., and Abou
0c04735 Hachem, M. (2013). Structural basis for arabinoxylo-oligosaccharide capture by
Frontiers in Microbiology | www.frontiersin.org 11 May 2021 | Volume 12 | Article 683905Wu et al. Pediococcus and Oligosaccharides on Broilers
the probiotic Bifidobacterium animalis subsp. lactis Bl-04. Mol. Microbiol. 90, Masella, A. P., Bartram, A. K., Truszkowski, J. M., Brown, D. G., and Neufeld,
1100–1112. doi: 10.1111/mmi.12419 J. D. (2012). PANDAseq: paired-end assembler for illumina sequences. BMC
Flint, H. J., Duncan, S. H., Scott, K. P., and Louis, P. (2015). Links between diet, Bioinformatics 13:31. doi: 10.1186/1471-2105-13-31
gut microbiota composition and gut metabolism. Proc. Nutr. Soc. 74, 13–22. Moniz, P., Ho, A. L., Duarte, L. C., Kolida, S., Rastall, R. A., Pereira, H., et al.
doi: 10.1017/s0029665114001463 (2016). Assessment of the bifidogenic effect of substituted xylo-oligosaccharides
Gibson, G. R., Probert, H. M., Loo, J. V., Rastall, R. A., and Roberfroid, M. B. (2004). obtained from corn straw. Carbohydr. Polym. 136, 466–473. doi: 10.1016/j.
Dietary modulation of the human colonic microbiota: updating the concept of carbpol.2015.09.046
prebiotics. Nutr. Res. Rev. 17, 259–275. doi: 10.1079/nrr200479 Moura, P., Barata, R., Carvalheiro, F., Gírio, F., Loureiro-Dias, M. C., and Esteves,
González, A., Gálvez, N., Martín, J., Reyes, F., Pérez-Victoria, I., and Dominguez- M. P. (2007). In vitro fermentation of xylo-oligosaccharides from corn cobs
Vera, J. M. (2017). Identification of the key excreted molecule by Lactobacillus autohydrolysis by Bifidobacterium and Lactobacillus strains. LWT Food Sci.
fermentum related to host iron absorption. Food Chem. 228, 374–380. doi: Technol. 40, 963–972. doi: 10.1016/j.lwt.2006.07.013
10.1016/j.foodchem.2017.02.008 National Research Council [NRC] (1994). Nutrient Requirements of Poultry: Ninth
Inagaki, A., Ichikawa, H., and Sakata, T. (2007). Inhibitory effect of succinic acid Revised Edition, 1994. Washington, DC: National Academies Press.
on epithelial cell proliferation of colonic mucosa in rats. J. Nutr. Sci. Vitaminol. Ocejo, M., Oporto, B., and Hurtado, A. (2019). 16S rRNA amplicon sequencing
53, 377–379. doi: 10.3177/jnsv.53.377 characterization of caecal microbiome composition of broilers and free-range
Jazi, V., Foroozandeh, A. D., Toghyani, M., Dastar, B., Rezaie Koochaksaraie, slow-growing chickens throughout their productive lifespan. Sci. Rep. 9, 1–14.
R., and Toghyani, M. (2018). Effects of Pediococcus acidilactici, mannan- Pender, C. M., Kim, S., Potter, T. D., Ritzi, M. M., Young, M., and Dalloul, R. A.
oligosaccharide, butyric acid and their combination on growth performance (2017). In ovo supplementation of probiotics and its effects on performance and
and intestinal health in young broiler chickens challenged with Salmonella immune-related gene expression in broiler chicks. Poult. Sci. 96, 1052–1062.
Typhimurium. Poult. Sci. 97, 2034–2043. doi: 10.3382/ps/pey035 doi: 10.3382/ps/pew381
Kabel, M. A., Kortenoeven, L., Schols, H. A., and Voragen, A. G. J. (2002). In vitro Pérez-Ramos, A., Werning, M. L., Prieto, A., Russo, P., Spano, G., Mohedano,
fermentability of differently substituted xylo-oligosaccharides. J. Agric. Food M. L., et al. (2017). Characterization of the sorbitol utilization cluster of the
Chem. 50, 6205–6210. doi: 10.1021/jf020220r probiotic Pediococcus parvulus 2.6: genetic, functional and complementation
Kind, T., Wohlgemuth, G., Lee, D. Y., Lu, Y., Palazoglu, M., Shahbaz, S., et al. studies in heterologous hosts. Front. Microbiol. 8:2393. doi: 10.3389/fmicb.2017.
(2009). FiehnLib: mass spectral and retention index libraries for metabolomics 02393
based on quadrupole and time-of-flight gas chromatography/mass Pourabedin, M., Chen, Q., Yang, M., and Zhao, X. (2016). Mannan- and
spectrometry. Anal. Chem. 81, 10038–10048. doi: 10.1021/ac9019522 xylooligosaccharides modulate caecal microbiota and expression of
Klein, A., Schrader, L., Gil, R., Manzano-Marín, A., Flórez, L., Wheeler, D., inflammatory-related cytokines and reduce caecal Salmonella Enteritidis
et al. (2016). A novel intracellular mutualistic bacterium in the invasive ant colonisation in young chickens. FEMS Microbiol. Ecol. 93:fiw226.
Cardiocondyla obscurior. ISME J. 10, 376–388. doi: 10.1038/ismej.2015.119 doi: 10.1093/femsec/fiw226
Koh, G. Y., Kane, A., Wu, X., Mason, J., and Crott, J. (2019). Parabacteroides Pourabedin, M., Guan, L., and Zhao, X. (2015). Xylo-oligosaccharides and
distasonis attenuates tumorigenesis, modulates inflammatory markers, and virginiamycin differentially modulate gut microbial composition in chickens.
promotes intestinal barrier integrity in azoxymethane-treated mice (OR04-02- Microbiome 3:15.
19). Curr. Dev. Nutr. 3(Suppl._1):nzz030.OR04-02-19. Rechner, A. R., Smith, M. A., Kuhnle, G., Gibson, G. R., Debnam, E. S., Srai,
Kondepudi, K. K., Ambalam, P., Nilsson, I., Wadstr, T., and Ljungh, A. (2012). S. K. S., et al. (2004). Colonic metabolism of dietary polyphenols: influence
Prebiotic-non-digestible oligosaccharides preference of probiotic bifidobacteria of structure on microbial fermentation products. Free Radic. Biol. Med. 36,
and antimicrobial activity against Clostridium difficile. Anaerobe 18, 489–497. 212–225. doi: 10.1016/j.freeradbiomed.2003.09.022
doi: 10.1016/j.anaerobe.2012.08.005 Reeves, A. E., Koenigsknecht, M. J., Bergin, I. L., and Young, V. B. (2012).
Kverka, M., Zakostelska, Z., Klimesova, K., Sokol, D., Hudcovic, T., Hrncir, T., et al. Suppression of Clostridium difficile in the gastrointestinal tracts of germfree
(2011). Oral administration of Parabacteroides distasonis antigens attenuates mice inoculated with a murine isolate from the family Lachnospiraceae. Infect.
experimental murine colitis through modulation of immunity and microbiota Immun. 80, 3786–3794. doi: 10.1128/iai.00647-12
composition. Clin. Exp. Immunol. 163, 250–259. doi: 10.1111/j.1365-2249. Ribeiro, T., Cardoso, V., Ferreira, L., Lordelo, M., Coelho, E., Moreira, A.,
2010.04286.x et al. (2018). Xylo-oligosaccharides display a prebiotic activity when used to
Langille, M. G., Zaneveld, J., Caporaso, J. G., McDonald, D., Knights, D., Reyes, supplement wheat or corn-based diets for broilers. Poult. Sci. 97, 4330–4341.
J. A., et al. (2013). Predictive functional profiling of microbial communities doi: 10.3382/ps/pey336
using 16S rRNA marker gene sequences. Nat. Biotechnol. 31, 814–821. doi: Rios-Covian, D., Gueimonde, M., Duncan, S. H., Flint, H. J., and de Los Reyes-
10.1038/nbt.2676 Gavilan, C. G. (2015). Enhanced butyrate formation by cross-feeding between
Lee, S., Lillehoj, H., Dalloul, R., Park, D., Hong, Y., and Lin, J. (2007). Influence Faecalibacterium prausnitzii and Bifidobacterium adolescentis. FEMS Microbiol.
of Pediococcus-based probiotic on coccidiosis in broiler chickens. Poult. Sci. 86, Lett. 362:fnv176.
63–66. doi: 10.1093/ps/86.1.63 Roh, T., De, U., Lim, S. K., Kim, M. K., Choi, S. M., Lim, D. S., et al. (2018).
Lei, Z., Shao, Y., Yin, X., Yin, D., Guo, Y., and Yuan, J. (2016). Combination Detoxifying effect of pyridoxine on acetaminophen-induced hepatotoxicity via
of xylanase and debranching enzymes specific to wheat arabinoxylan improve suppressing oxidative stress injury. Food Chem. Toxicol. 114, 11–22. doi: 10.
the growth performance and gut health of broilers. J. Agric. Food Chem. 64, 1016/j.fct.2018.02.017
4932–4942. doi: 10.1021/acs.jafc.6b01272 Sanders, J. G., Beichman, A. C., Roman, J., Scott, J. J., Emerson, D., McCarthy, J. J.,
Lei, Z., Wu, Y., Nie, W., Yin, D., Yin, X., Guo, Y., et al. (2018). Transcriptomic et al. (2015). Baleen whales host a unique gut microbiome with similarities to
analysis of xylan oligosaccharide utilization systems in Pediococcus acidilactici both carnivores and herbivores. Nat. Commun. 6:8285.
strain BCC-1. J. Agric. Food Chem. 66, 4725–4733. doi: 10.1021/acs.jafc. Sarmiento-Rubiano, L. A., Zuniga, M., Perez-Martinez, G., and Yebra, M. J.
8b00210 (2007). Dietary supplementation with sorbitol results in selective enrichment of
Leipnitz, G., Seminotti, B., Haubrich, J., Dalcin, M. B., Dalcin, K. B., Solano, A., lactobacilli in rat intestine. Res. Microbiol. 158, 694–701. doi: 10.1016/j.resmic.
et al. (2008). Evidence that 3-hydroxy-3-methylglutaric acid promotes lipid and 2007.07.007
protein oxidative damage and reduces the nonenzymatic antioxidant defenses Segata, N., Izard, J., Waldron, L., Gevers, D., Miropolsky, L., Garrett, W. S.,
in rat cerebral cortex. J. Neurosci. Res. 86, 683–693. doi: 10.1002/jnr.21527 et al. (2011). Metagenomic biomarker discovery and explanation. Genome Biol.
Marcobal, A., Kashyap, P. C., Nelson, T., Aronov, P., Donia, M., Spormann, A., 12:R60.
et al. (2013). A metabolomic view of how the human gut microbiota impacts the Suzuki, H., and Yamamoto, S. (2009). Campylobacter contamination in retail
host metabolome using humanized and gnotobiotic mice. ISME J. 7, 1933–1943. poultry meats and by-products in Japan: a literature survey. Food Control. 20,
doi: 10.1038/ismej.2013.89 531–537. doi: 10.1016/j.foodcont.2008.08.016
Frontiers in Microbiology | www.frontiersin.org 12 May 2021 | Volume 12 | Article 683905Wu et al. Pediococcus and Oligosaccharides on Broilers Suzuki, Y., Kosaka, M., Shindo, K., Kawasumi, T., Kimoto-Nira, H., and Suzuki, Williams, B. A., Mikkelsen, D., Le Paih, L., and Gidley, M. J. (2011). In vitro C. (2013). Identification of antioxidants produced by Lactobacillus plantarum. fermentation kinetics and end-products of cereal arabinoxylans and (1, 3., 1, Biosci. Biotechnol. Biochem. 77, 1299–1302. doi: 10.1271/bbb.121006 4)-β-glucans by porcine faeces. J. Cereal. Sci. 53, 53–58. doi: 10.1016/j.jcs.2010. Taheri, H. R., Moravej, H., Malakzadegan, A., Tabandeh, F., Zaghari, M., 09.003 Shivazad, M., et al. (2010). Efficacy of Pediococcus acidlactici-based probiotic Wu, Y., Li, J., Qin, X., Sun, S., Xiao, Z., Dong, X., et al. (2018). Proteome and on intestinal Coliforms and villus height, serum cholesterol level and microbiota analysis reveals alterations of liver-gut axis under different stocking performance of broiler chickens. Afr. J. Biotechnol. 9, 7564–7567. doi: 10.5897/ density of Peking ducks. PLoS One 13:e0198985. doi: 10.1371/journal.pone. ajb10.535 0198985 Tsukahara, T., and Ushida, K. (2002). Succinate accumulation in pig large intestine Wu, Y., Wang, Y., Yin, D., Shahid, M. S., and Yuan, J. (2020). Flaxseed diet caused during antibiotic-associated diarrhea and the constitution of succinate- inflammation by altering the gut microbiota of Peking ducks. Anim. Biotechnol. producing flora. J. Gen. Appl. Microbiol. 48, 143–154. doi: 10.2323/jgam.48. 31, 520–531. doi: 10.1080/10495398.2019.1634579 143 Yasar, S., and Forbes, J. M. (1999). Performance and gastro-intestinal response of Ubeda, C., Bucci, V., Caballero, S., Djukovic, A., Toussaint, N. C., Equinda, broiler chickens fed on cereal grain-based foods soaked in water. Br. Poult. Sci. M., et al. (2013). Intestinal microbiota containing Barnesiella species cures 40, 65–76. doi: 10.1080/00071669987854 vancomycin-resistant Enterococcus faecium colonization. Infect. Immun. 81, Yuan, L., Li, W., Huo, Q., Du, C., Wang, Z., Yi, B., et al. (2018). Effects of xylo- 965–973. doi: 10.1128/iai.01197-12 oligosaccharide and flavomycin on the immune function of broiler chickens. Van den Abbeele, P., Belzer, C., Goossens, M., Kleerebezem, M., De Vos, W. M., PeerJ 6:e4435. doi: 10.7717/peerj.4435 Thas, O., et al. (2013). Butyrate-producing Clostridium cluster XIVa species Zhao, Y., Wu, X., Guo, L., Liu, Y., Liu, L., and Liu, J. (2011). Protective effect specifically colonize mucins in an in vitro gut model. ISME J. 7, 949–961. of N-acetylglucosamine on injury of liver tissues induced by alcoholic and its doi: 10.1038/ismej.2012.158 mechanism. J. Jilin Univ. 37, 456–459. Wang, J., Ji, H., Wang, S., Liu, H., Zhang, W., Zhang, D., et al. (2018). Probiotic Lactobacillus plantarum promotes intestinal barrier function by strengthening Conflict of Interest: The authors declare that the research was conducted in the the epithelium and modulating gut microbiota. Front. Microbiol. 9:1953. doi: absence of any commercial or financial relationships that could be construed as a 10.3389/fmicb.2018.01953 potential conflict of interest. Wang, S., Dong, Z., Li, J., Chen, L., and Shao, T. (2019). Pediococcus acidilactici strains as silage inoculants for improving the fermentation quality, nutritive Copyright © 2021 Wu, Lei, Wang, Yin, Aggrey, Guo and Yuan. This is an open-access value and in vitro ruminal digestibility in different forages. J. Appl. Microbiol. article distributed under the terms of the Creative Commons Attribution License 126, 424–434. doi: 10.1111/jam.14146 (CC BY). The use, distribution or reproduction in other forums is permitted, provided Weiss, G. A., Chassard, C., and Hennet, T. (2014). Selective proliferation of the original author(s) and the copyright owner(s) are credited and that the original intestinal Barnesiella under fucosyllactose supplementation in mice. Br. J. Nutr. publication in this journal is cited, in accordance with accepted academic practice. No 111, 1602–1610. doi: 10.1017/s0007114513004200 use, distribution or reproduction is permitted which does not comply with these terms. Frontiers in Microbiology | www.frontiersin.org 13 May 2021 | Volume 12 | Article 683905
You can also read