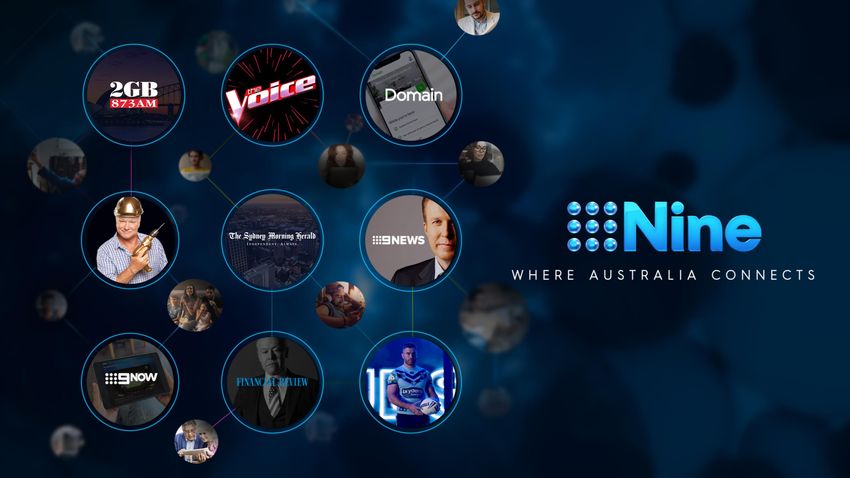
Mid-Year Update 2020 - Nine for Brands
←
→
Page content transcription
If your browser does not render page correctly, please read the page content below

Mid-Year Update - 2020

Nine's Consumer Pulse study continues with a second wave
    of research looking at audience sentiment, media
    consumption and consumer behaviour/spending.
People are feeling more positive
                                                                          and hopeful as time passes
                                          Australians are feeling hopeful. Concern is no longer the top emotion and it has significantly
                                        decreased by 24% ov er the past few weeks. Negativ e emotions are in decline, whilst more positiv e
                                             emotions are increasing. 1 in 2 are feeling more positiv e* than they did a month ago.

                                                                                      TOP 5 Emotions                                                                                     Top 5 (Negative) Emotions
                                                                                      Wave 2 (NOW)                                                                                        in wave 1 are in Decline

                                                                                                                                                             59%
                                                                                          36% Hopeful

                                                                                                                                                                                       40%

                                                                                                                                                                                                                  40%

                                                                                                                                                                                                                                   38%
                                                                                                                                                                   35%

                                                                                                                                                                                                                                                   33%
                                                                                      35% Concerned

                                                                                                                                                                                                                                                         27%
                                                                                                                                                                                              25%

                                                                                                                                                                                                                        24%

                                                                                                                                                                                                                                         18%
                                                                                               32% Tired
                  1 in 2                                                                28% Optimistic
  ARE POSTIVE, HOPEFUL OR                                                                                                                                  Conce rned                   Anxious                  Unset tled        Worried         Frustrated
        OPTIMISTIC                                                                      27% Frustrated                                                                                              Wav e 1                              Wav e 2

Source: 9Nat ion & I nsider – Aust ralians Hav e Their Say on COVI D 19 W av e 1 (N= 3590) / W av e 2 (N= 2395) : How are y ou feeling at t his moment in t ime? *Posit iv e emot ion include opt imist ic, hopeful & posit iv e
Many think as a nation we are coping,
                                                                        better than other countries
                                       When comparing to other countries, consumers think we are doing collectively better. They
                                       think the mood in the country is more positive and are coping better. They also believe our
                                                            federal government is doing well comparatively.

                                                      87%                                                                                       89%                                                                                       83%
                                                                                                                                       Coping w ell in this                                                                             Australian
                                              Mood in Australia is
                                                                                                                                          situation in                                                                          gov ernment is doing
                                              more positiv e than
                                                                                                                                      comparison to other                                                                       w ell in comparison to
                                               other countries
                                                                                                                                           countries                                                                               other countries

Source: 9nat ion & insider – Aust ralians hav e t heir say on COVI D 19 w av e 2 (N= 2395) : w hat w ould y ou say t he mood is in Aust ralia about COVI D-19 in comparison t o ot her count ries?
Source: 9nat ion & insider – Aust ralians hav e t heir say on cov id 19 w av e 2 (n= 2395) : in y our opinion, how are Aust ralians coping w ith t he current cov id-19 sit uat ion compared t o nat ions such as t he us, uk, new zealand, it aly , spain?
Source: 9nat ion & insider – Aust ralians hav e t heir say on cov id 19 w av e 2 (n= 2395) : in comparison t o ot her count ries, do y ou t hink t he Aust ralian federal gov ernment is doing a good job?
Audiences continue to
                                                                                       consume more media
                                                          Over the past few weeks, amongst top 10 activities they have done,
                                                                        five are related to media consumption.

                                                                                      Top 10 activities started past few weeks

                       51%                       50%                        49%                        48%                        47%
                                                                                                                                                             42%                        41%                        40%
                                                                                                                                                                                                                                     38%
                                                                                                                                                                                                                                                          33%

              Watching more
                          Reading
                            TV    news and articles
                                                Watching
                                                    online streaming services
                                                                          Outdoor runs / walks                                  Cooking                    Reading             Trying new recipes         Home DIY projects
                                                                                                                                                                                                                      Listening to more music / podcasts
                                                                                                                                                                                                                                                   Listen to the radio

Source: 9Nation & Insider – Australians Hav e Their Say on COVID 19 Wav e 2 (N= 2395): Now that we are restricted in our mov ements, hav e y ou taken up or would y ou take up any of the f ollowing hobbies and/or activ ities:
Nine continues to be the media powerhouse
                                                      consumers trust to keep them up to date

                                                                                                                                            7 in 10
                                                              Trust Nine’s assets to bring them timely and accurate updates

                                   74%                                                                        71%                                                     Nearly 1 in 3                                                               1 in 4
               Turning to Nine TV Programs                                            Turning to Nine Online Websites                                              Turning to Nine Print Assets                                              Turning to Nine Radio
                                                                                                                                                                                                                                                     Assets

Source: 9Nat ion & I nsider – Aust ralians Hav e Their Say on COVI D 19 W av e 2 (N= 1588): Can y ou t ell us w hich online sit es y ou t rust and hav e accessed t he most ov er t he past few w eeks?
Source: 9Nat ion & I nsider – Aust ralians Hav e Their Say on COVI D 19 W av e 2 (N= 1637): W hich of t he follow ing TV New s programs do y ou t rust and w at ch most oft en t o keep up t o dat e w it h t he coronav irus (COVI D-19)?
Source: 9Nat ion & I nsider – Aust ralians Hav e Their Say on COVI D 19 W av e 2 (N= 750): W hich of t he follow ing phy sical new spapers do y ou t rust and read most oft en t o keep up t o dat e w it h t he coronav irus (COVI D-19)?
Source: 9Nat ion & I nsider – Aust ralians Hav e Their Say on COVI D 19 W av e 2 (N= 1067): Ov er t he past few w eeks, hav e y ou t uned int o one of Nine's radio st at ions t o get t he lat est new s on t he pandemic?
News consumption has stabilised
                                                                  with audiences continuing to choose
                                                                         trusted news sources
                                           Over the past few weeks, people continue to stay on top of the latest updates on the
                                          pandemic. Turning to the sources they trust. News consumption has stabilised, with over 1
                                                         in 2 still consuming more news and current affair content.

                                                                                                                                                                                                                                                                 89%

                                                                                                                                                                                                                                                                          88%
                                                                                                                                                                                            85%
                                                                                                                                             88%

                                                                                                                                                                                                        79%

                                                                                                                                                                                                                                      71%
                                                                                                                                          turn to new s
                                                                                                                                         sources that I

                                                                                                                                                                                                                                                 55%
                                                                                                                                          trust to keep
                                                                                                                                         me up to date

                                                              79%
                                                         Wanting to stay
                                                          on top of the
                                                         latest updates
                                                                                                                                                                                        Staying up to date                Consuming more news in past   Turning to sources they trust
                                                                                                                                                                                                                                  few weeks

                                                                                                                                                                                                                          Wave 1                        Wave 2

Sour ce: 9Nat ion & I nsider – Aust r alians Have T heir Say on COVI D 19 Wave 1 (N= 3590) / Wave 2 (N= 2395): Do you agr ee or disagr ee wit h t he following st at ement s:
My consum pt ion of News and cur r ent affair cont ent has incr eased significant ly over t he past few weeks | I want t o st ay on t op of t he lat est updat es on COVI D-19 | I t ur n t o news sour ces t hat I t rust t o keep m e up t o dat e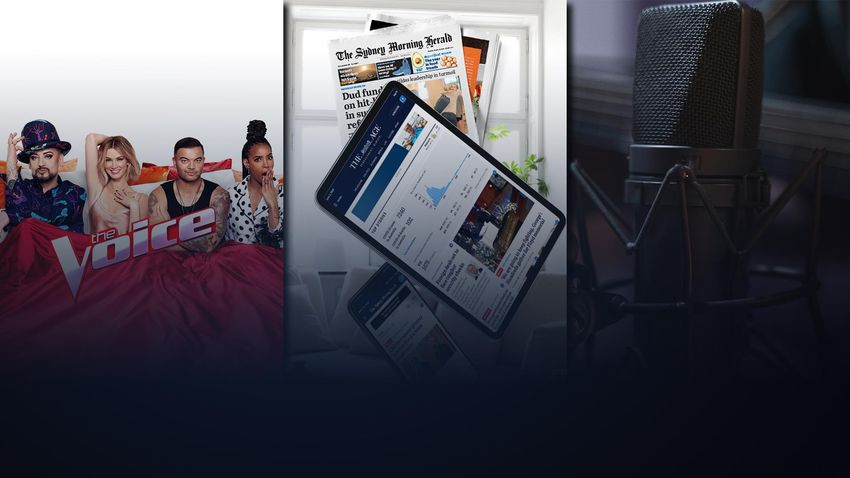
Consumers are more open to purchasing
                                                      non-essentials & treat yourself items
                                There has been a shift in what consumers are purchasing online since the start of the
                              pandemic. Over time treat yourself items purchases like clothes and shoes have increased.
                                    Females and millennials are more open to spending across these categories

                                        66%
                                                                                  +13%                       31%

                 +9%                                                                                                                                                              Top 3 Items likely to purchase
                                                                                                                                                                                   online in the next few weeks
                                                                                18%

            57%
                                                                                                                                                                                                               35-54                                                55+
                                                                                                                                                            18-34
              Spend on non essential                                       Purchase something to treat yourself                                                                                         #1 – Clothes &                                    #1 – Household
                                                                                                                                              #1 – Clothes & Shoes
                                                                                                                                                                                                             Shoes                                             Items
          Wave 1              Wave 2                                            Wave 1                      Wave 2
                                                                                                                                                #2 – Home Delivery
                                                                                                                                                                                                       #2 – Household                                        #2 – Books /

                     66%                                                               1 in 3                                                       #3 – Household
                                                                                                                                                         Items
                                                                                                                                                                                                            Items                                            Magazines

           Still spending on                                       Likely to purchase something                                                                                                    #3 – Home Delivery                                     #3 – Clothes &
          non essential items                                             to ‘treat yourself’                                                                                                                                                                  Shoes

Source: 9Nat ion & I nsider – Aust ralians Hav e Their Say on COVI D 19 W av e 1 (N= 3590) / W av e 2 (N= 2395): Do y ou agree or disagree w it h t he follow ing st at ement s: I am st ill spending on non-essent ial it ems / I am likely t o purchase somet hing t o 't reat my self
Source: 9Nat ion & I nsider – Aust ralians Hav e Their Say on COVI D 19 W av e 2 (N= 2395): You ment ioned y ou are likely t o do more online shopping in t he nex t few w eeks
In the pursuit of truth, trust and entertainment
     more Australians have turned to Nine
Year to date, we provide the most consistent linear
TV network for all key demographics
2020 CYTD
Primetime Com Share
(1800-2359)
P25-54 39.15% 31.03% 29.82%
P16-39 38.66% 30.21% 31.13%
GS+CH 40.30% 31.54% 28.16%
Total People 39.45% 34.87% 25.67%
Source: OzTAM Met ro 5 Cit y , 1/01/2020 - 3/06/2020, Net w ork Nine, Netw ork Sev en, Net w ork 10, Commercial Share, Consolidat ed 7 as at 04/06/2020 .And have continued to reach
new audiences over the last four weeks +0.2
reach ppts
Ttl Ppl
Nine Network’s average weekly reach has increased across the
5 city metro across all key demos (Weeks 19-20 v 21-22)
+0.4
reach ppts
P25-54
Av erage Weekly Reach %
64.9 66.3
59.9 60.1 59.5 59.9
+0.4
45.2 45.6 reach ppts
P16-39
+1.4
reach ppts
Total People P 25-54 P 16-39 GS + CH GS+CH
Weeks 19-20 2020 Weeks 21-22 2020
Source: OzTAM Met ro 5 Cit y , W eeks 19-29 2020. W eeks 21-22 2020, S-S 0200-2559, Net w ork Nine, Reach, Av erage W eekly Reach %,,Various Demos, consolidat ed 7.We are the most consistent platform to
reach P25-54 for over 40 consecutive survey weeks
Network Net w ork
P25-54 – P25-54 –
18:00-MN 18:00-MN
W23 40.04% 34.83% 25.14% W43 38.55% 32.00% 29.45%
W24 38.41% 35.14% 26.46% W44 38.14% 32.64% 29.21%
W25 37.63% 35.32% 27.06% W45 40.30% 32.47% 27.23%
2019
W26 40.78% 33.49% 25.73% W46 37.32% 34.44% 28.24%
W27 38.12% 36.18% 25.70% W47 38.28% 35.37% 26.35%
W28 42.66% 33.53% 23.81% W48 38.23% 36.52% 25.25%
W29 36.71% 36.64% 26.65% W7 40.97% 31.17% 27.86%
W30 35.61% 35.21% 29.18% W8 40.56% 33.20% 26.24%
W31 39.87% 32.66% 27.47% W9 40.39% 31.57% 28.04%
W32 39.88% 32.94% 27.18% W10 41.35% 30.45% 28.20%
2019
W33 39.01% 31.98% 29.02% W11 42.47% 29.67% 27.86%
2020
W34 40.70% 32.40% 26.90% W12 39.72% 33.24% 27.03%
W35 37.27% 31.64% 31.09% W13 43.09% 30.63% 26.27%
W36 38.35% 34.61% 27.04% W14 41.84% 30.78% 27.38%
W37 41.17% 32.64% 26.20% W17 39.39% 30.34% 30.27%
W38 36.55% 34.94% 28.51% W18 36.56% 30.89% 32.56%
W39 38.78% 34.31% 26.91% W19 34.73% 33.17% 32.10%
W40 39.20% 33.99% 26.81% W20 35.96% 31.98% 32.05%
W41 41.06% 30.14% 28.80% W21 36.32% 30.28% 33.40%
W42 36.55% 30.11% 33.33% W22 37.68% 29.47% 32.85%
Source: OzTam met ro TV, W eek 23 2019 – W eek 22 2020, ex cludes Summer & East er periods, P25-54, Net w ork 9, Netw ork 7, 10 Net w ork, 18:00-23:59, 5 Cit y Met ro, Commercial Share, Consolidat ed 7 as at 01/06/20.We provide consistency across all screens
Australia's leading broadcast video
on demand platform
47% 4,543,020
1,821,603
1,038,920
37%
2020 VPM 16%
MINUTES SHARE
Source: Minut es share: OzTAM VOD + Liv e VPM, 1 January t o 03 May , Met ric: Minut es. U nique audience based on Nielsen Digit al Cont ent Rat ings, Mont hly Tagged, April 2020, Broadcast Media, Tex t Only , People 2+, Census.Our biggest
entertainment formats
have brought
families togetherEvery episode of LEGO Masters season 2
delivered growth in co-viewing
Co-Viewing Profile
74.0%
72.3%
72.0% 71.2%
70.6% 70.5%
70.2%
70.0% 69.3%
68.1% 68.1%
67.6% 67.6%
68.0% 67.1%
66.0% 65.1%
63.9% 63.9% 63.6%
64.0%
62.8%
62.0%
60.0%
58.0%
Episode 1 Episode 2 Episode 3 Episode 4 Episode 5 Episode 6 Episode 7 Episode 8
2019 2020
Source: OzTAM Met ro Tot al TV, Nine, Lego Mast ers 2019 v Lego Mast ers 2020, Episodes 1-8, Audience Co-View ing %, Consolidat ed 7 as at 11/05/20. Number one: OzTAM Met ro Tot al TV, Nine, Lego Mast ers 2019 v Lego Mast ers 2020, Episodes 1-8, Audience Co-View ing %,
Consolidat ed 7 as at 11/05/20.The Voice reaches 4.46 Million metro
viewers season to date
Primary Channel timeslot winner
6 consecutive broadcasts
Total People & Grocery Shopper +Child
TIMESLOT AUDIENCE COMPARISON The Voice 2020
Season Average 977, 209 556, 104 853, 007
Launch Episode 1, 011, 542 649, 088 795, 923
Episode 2 951, 003 563, 919 905, 622
Episode 3 987, 048 464, 267 842, 676
Episode 4 1, 025, 727 599, 446 847, 972
Episode 5 959, 174 590, 265 901, 966
Episode 6 927, 101 460, 291 829, 763
Source: OzTAM (Metro) Overnight data as at 2/06/2020.The Voice delivers
Year-on-Year growth across 9Now
The Voice Year-on-Year analysis for
Episode 1-6
Average VPM Rating Total Streams Total Minutes
115,000 1.4 Million 52 Million
+50% YoY +55% YoY +57% YoY
Source: OzTAM LIVE + VOD VPM, 24/05/2020 – 02/06/2020 v 19/05/2019 – 28/05/2019Trusted news content proving
to be more important than ever
METRO GROWTH METRO GROWTH METRO GROWTH METRO GROWTH METRO GROWTH METRO
YOY YOY YOY YOY YOY GROWTH YOY
P25-54: +18.71% P25-54: +25.57% P25-54: +12.81% P25-54: +9.63% GS + CH: +3.50% Total People: +0.95%
P16-39: +25.72% P16-39: +57.49% P16-39: +18.28% P16-39: +17.12% Total People: +0.60%
GS + CH: +12.10% GS + CH: +11.30% GS + CH: +19.60% GS + CH: +14.97%
Total People: +9.38% Total People: +29.71% Total People: +11.71 Total People: +9.89%
Sour ce: OzT AM Met ro, 2020 YT D v 2019 ST LY, T ot al People, P25-54, P16-39, GS+CH, Avg. Audience, Over night .Round Three reaches 3.8 million Australians
and returns with year-on-year growth
YEAR ON YEAR GROWTH ROUND 3 – IN GAME
P25-54 +23.48%
P16-39 +25.11%
GS+CH +20.94%
+57% Highest rating VPN on
Dynamic average audience share for all 9Now for Round 3
key demos across Round 3 25K Live Average VPN Matches only,
+250% on Round 3, 2019.
Source: OzTam met ro TV, 28/05/20 – 31/05/20, Various Demos, Channel 9, Channel 7, Channel 10, cont ains ‘NRL LI VE’, ex cludes ‘POST’, Sy d-Bris, Dy namic Share of Commercial Primary Channels, Ov ernight . Grow t h based on I n Game performance. 5 Cit y met ro.,
Round 3 on Nine (Thurs, Fri, Sun) LI VE VPM, 28 May 2020 – 31 May 2020 v 28 Mar ch 2019 – 31 Mar ch 2019, 2020 based on pr e logs. OzT AM Met ro T ot al T V & Regional T AM Regional FT A +WA, 28/05/2020-31/05/2020, T ot al People, Nine Net wor k & Net work Cont ent
Affiliat es, Over night , Cum e. Reach, cont ains “NRL”.Engaging Australian footy fans in key NRL
markets like never before
DYNAMI C PRI MARY CHANNEL
TI MESLOT SHARE, OVERNI GHT ROUND 3
SYD & BRI S
P25-54 59.0% 21.2% 24.1%
P16-39 61.4% 16.9% 24.6%
GS+CH 59.8% 14.1% 20.8%
Audience Profile
180,000
160,000
140,000
38%
120,000
100,000
62%
80,000
60,000
40,000
20,000
0 Men Women
P 65+ P 55-64 P 35-54 P 25-34 P 16-24 P 0-15
Source: OzTam met ro TV, 28/05/20 – 31/05/20, Various Demos, Channel 9, Channel 7, Channel 10, cont ains ‘NRL LI VE’, ex cludes ‘POST’, Sy d-Bri, Dy namic Share of Commercial Primary Channels, Ov ernight . OzTam met ro TV, 28/05/20 – 31/05/20,
Various Demos, Nine Net w ork, cont ains ‘NRL LI VE’, ex cludes ‘POST’, 5 Cit y Met ro, Simple Audience Profile, Ov ernight .The countdown to
the Grand Final
On October 25th, the biggest sporting competition
of the year comes to a head as the best teams of
the season face off over 9 matches, to determine
which team will be crowned the NRL champion for
2020.
All finals games are shown live and the Grand Final
is exclusively on Nine’s Wide World of Sports.
Reached
5.2
Million
Fans in 2019
Sour ce: OzT AM Met ro T ot al T V 01/01/2019-13/10/2019, 1800-2359, T ot al I ndividuals, Com m er cial FT A Channels, Cons 7, 5 Cit y Met r o. Excludes: M OVI ES GENRES & “Repeat s and Encor es”, T he Lat est : Seven News, Specials, 60 Minut es –Sum mer, 60Minut es –Lat e,
7News & 9News gr ouped based off 1800-1859 t imeslot S-S.State of Origin
Big event television
The Holden State of Origin series is the greatest rivalry in
Australian sport and consistently amongst the most
watched programs of the year.
For the first time in it’s 40 year history the series will take
place at the end of the NRL season, and all games are
live and exclusive on Nine’s Wide World of Sports.
• Game One Wednesday, November 4
• Game Two Wednesday, November 11
• Game Three Wednesday, November 18
Delivered
9.537M TOP 3
fans reached
programs in 2019
nationally in 2019
for P25-54
Source: Reach: OzTam Met ro & Regional Dat a, Nine Net w ork & Nine Net w ork Cont ent Affiliat es, Tot al People, 2019 St at e of Origin Series including Pr e and Post , St andard 1 Min Cumulat iv e Reach, Ov ernight . Top programs: OZTAM Met ro 5 Cap, 01/01/2019 -
30/09/2019, 0200-2559. Tot al FTA, P25-54, Av erage Audience, Con7 dat a.Australia’s favourite renovation
reality show is back!
After fifteen mammoth seasons, The Block continues to excite and
inspire audiences across the country with incredible renovations,
fascinating characters and nail-biting auctions.
On-Air 50 x Episodes Sun: 1900 Short Form, Long
August Mon – Wed: 1930 Form, Live Stream
OVERNIGHT LIVE PLAYBACK ENCORE LIVE VPM VOD VPM
1.543M 1.273M 101k 198k 16k 99k
1.67 MILLION AVG. viewers per episode in 2019
Source: Cross-plat form audience: OzTAM Met ro Tot al TV & Regional TAM Regional FTA+W A. Ov ernight /Timeshift t o 7/Consolidat ed 7 (encores only ) as at 19/11/2019. 04/08/19-16/11/19 "The Block". Tot al I ndiv iduals, Nine/Nine Cont ent Affiliat es. 5 Cit y Met ro &
Combined Agg Market s. AU D & Tot al AU D (encores). OzTAM Liv e + VOD VPM, 4/8/2019 – 17/11/2019. Online v iew ing: OzTAM VOD VPM, 7-13 Oct ober 2019 v 27 May – 2 June 2018.Viewers' Choice Sponsorship
Knockout tournament structure     Knockout tournament structure
                                     New obstacles introduced
 Each state: 4 Ninjas | 16 runs
                                   Each state: 4 Ninjas | 12 runs
NEW BRANDED ASSET OPPORTUNITIES Branded perimeter screens Branded leaderboard At home supporters and support crew In pool branding
Harness the
power of
Australian drama
Branded sneak peek
•   Bespoke in-program content
    integration
•   Sneak Peek (1 x Available)

Digital Short Form
•   15” Pre-roll

BVOD
•  30” Pre and mid-rolls
•  Digital billboards

•   16 x 30” First run commercial
    content across the series
•   Broadcast billboards

•   6 x Insta Stories - 'Swipe up' to see ‘Sneak
    Peak' of next week's episode. Includes
    branded tag, logo and swipe up.
The complete streaming experience with
local and international exclusive content
9Now has ev olved into a complete streaming experience offering v iewers both
locally produced Nine content and international exclusiv e programs from NBCU.
Giv ing viewers more choice has seen 9Now experience year-on-year growth of
daily activ e users and time spent.
More daily
VPM Minutes
active users
5% 7% 9% 6% 7%
14%
18%
+41% DAU
37%
30% July – May YoY
49%
95% 93% 94% 93%
More content
91%
consumed per user
86%
82%
70%
63%
51% +22% hours/user
July – May YoY
Jul Aug Sep Oct Nov Dec Jan Feb Mar Apr
Catch-up Digital Exclusive
Source: OzTAM LI VE + VOD VPM 01.07.2019 - 30.04.2020. DAU analy sis based on int ernal user dat aLove Island UK Season 1-6 launching Friday June 5
An unrivalled network of news products
                                                  with growing digital audiences

      10.671M UAs                                3.169M UAs                                5.164M UAs       9.353M UAs    2.003M UAs       1.425M UAs

   UA +27.5% YoY                             UA +99.4% YoY                              UA +62% YoY         UA +32% YoY   UA +101.2% YoY   UA +109.7% YoY
 Moves to No 3. new s                  No. 1 time spent (finance)                No. 2 commercial website
     w ebsite                                   14.45 Mins                           time spent (new s)
                                                                                         33.05 Mins
Source: Nielsen Digital Content Ratings, Monthly Tagged, April 2020, All Brands, Text, People 2+, Census.
Australians turn to trusted
online news in record numbers
Monthly Unique Audience year-on-year
10,000,000 9.353M UAs
UA +32% YoY
9,000,000
8,000,000
7,000,000 5.164M UAs
UA +62% YoY
6,000,000
5,000,000
2.003M UAs
4,000,000 +101.2% YoY
3,000,000
2,000,000 1.425M UAs
+109.7% YoY
1,000,000
0
The Sydney Morning Herald The Age Brisbane Times WAToday The Australian Financial 3.169M UAs
Review
+99.4% YoY
Apr-19 Apr-20
Source: Nielsen Digital Content Ratings, Monthly Tagged, April 2020, Sub Categories, Text, People 2+, Census.Best in market cross-platform news
products Australians turn to first
5.321M Monthly readers Australia’s No. 1 news 3.726M monthly readers
(print + digital) brand (print + digital) (print + digital)
+16% Vs Dec 2019 11.033M monthly readers +52% Vs Dec 2019
(print + digital)
+43% YoY
+20% YoY
+35% Vs Dec 2019
Print readership growth +4%
+38% YoY (March 2019) YoY
Source: em m a™ conduct ed by I psos Connect ; People 14+ for t he 12 m ont hs ending Mar ch 2020, 14+ Nielsen Digit al Panel dat a calibr at ed t o Di git al Cont ent Rat ings Mar ch 2020.Feel good moments offer
connection and optimism
As Australians look to escape heav ier news content the metro mastheads hav e
deliv ered good news stories, which are offering a moment of optimism for
readers.Empowering Australians with
cross-platform Money content
Digital Print Television Radio
Money indexed segment Money section - twice weekly Twice weekly Money Joel Gibson joins nights on
online, with content posted (Wednesdays and Sundays) segments (Wednesday’s with Wednesday nationally.
Tuesdays, Wednesdays, Joel Gibson and Sundays with Brooke Corte hosting Money
Fridays and Sundays Jessica Irvine) nationally News programNEW! Good Food joins Sunday Life
Launching on Sunday 5th July, the Good Food "Flip-cover
special" in Sunday Life.
Building on much-loved weekly Adam Liaw Good Food
recipes, This monthly Good Food special edition offers half a
million readers more pages of kitchen innovations, chef
inspired recipes to eat in and reviews of the best places to eat
out.
• Good Food Flip-back will be a minimum of 12 pages of
food related content
• Published on the first Sunday of every monthI n these extraordinary times, The Australian Financial Review is responding with an editorial series, Invest in Australia. This special series of print and digital executions will go in depth into all the v ital areas of our economy, rev ealing the challenges and opportunities our nation faces as w e emerge from the COVI D-19 global pandemic and enter the new decade and beyond. We will examine what is needed in terms of inv estment and policy in order to make the most of this nation’s extraordinary and untapped potential, and so guarantee our future business and economic prosperity.
The best lifestyle publishing content
            is still to come
The Nine Data strategy
developing a World class offering
BILLIONS OF 1 ST
PARTY DATA SIGNALS
11M
GENERATED BY
OFFLINE DATA AND
16M
PURCHASE HISTORY
FROM BILLIONS OF
DOLLARS WORTH
AUSTRALIANS OF TRANSACTIONS
REGISTERED
USER IDS EVERY MONTH
Ability to identify our users who Our audience is consistent ly engaged Our data is matched against
have signed up to one of Nine’s through the day and night, across the Australia’s leading transactional data
services, across any device, and depth and breadth of Nine’s diverse providers at a 1-to-1 person level
have these linked to a person media brands, allowing Nine to gain a
rich insight into their behavioursO ffl i ne and tr ans ac ti o nal data
fr o m A us tr al i a' s data l e ade r s
Trav el data from $23 Billion worth of annual Financial data from 50 million Behav ioural data collected Location data collected on
12 million Qantas transactions analysed credit applications a year from 16M activ e MyTicketek ov er 4.5M+ Nine w eb and app
Frequent Flyer from grocery basket and processed on behalf of members purchasing 30M users, allowing advertisers to
members. bank transaction data. Australia’s financial institutions, tickets each year. target physical store locations
including the big 4 banks. and measure footfall
attribution across Nine.Nine’s targeting products provide
a ful l funne l s o l uti o n to m ar ke te r s
Achieve targeted reach
to drive brand awareness
Leverage passions, lifestyle
and motivations to drive
brand consideration
Target in market consumers
to drive conversions
Drive customer lifetime value
by retaining and up/cross selling
to your existing customersNine Radio
2020 Strategy
Lean in Lean back
Talk Radio Music RadioThe untapped market
People 40+Wealth & Spending Key decision
financial attitude on extras maker
520k (35%) 271k (18%) 83%
Of listeners (1.2M) are main
Listeners have investments over Spend on extras - 36% grocery buyers spending $143 a
$300k - 71% higher than AP18+ higher than AP18+ week
64%
790k (53%) 904k (60%) of listeners (954k) are main
decision makers for purchasing
Own their home outright (not Are the main income motor vehicles
under mortgage) earner - 14% higher than
AP18+ 71%
of listeners (1.06M) are main
decision makers for Insurance,
Financial Services and Investments
Source: Nielsen CMV, Met ro Surv ey 2 2020, Mon-Sun 5.30am-12MN, 2GB, 3AW 4BC 6PR 5aa, 2U E,Magic1278,4BH AP40+ v s AP18+Talk radio engages more
than any other radio platform
Our listeners are
40%
Less likely to change
station “When I hear
an ad come on”
Source: GfK Radio Rat ings, SMBAP, Surv ey 1 2020, Mon-Sun 5.30am-12MN, Time Spent List ening (HH:MM), AP10+, Macquarie New s Talk - 2GB, 3AW , 4BC, FI VEaa or 6PRAudiences continue to turn to trusted voices and
platforms where they can voice their own opinions
Digital Digital Digital Digital Podcast
Average session Average session Average session Average session April Downloads
+8% month-on-month +61% month-on-month +29% month-on-month +13% month-on-month 1.781 Million
Streaming +5% Streaming +2% Streaming +4% Streaming +8%
Source: St reaming: Trit on W ebcast Met rics, May 18 – 31 v May 4 – 17. Podcast ing: Trit on W ebcast Met rics, May. Online: Google Analy t ics, May .2GB & 4BC 3AW 6PR
Steve Mills & Basil
Alan Jones Ross and John
Breakfast Zempilas
Mornings Ray Hadley Neil Mitchell Garevth Parker
Afternoon Deb Knight NEW Dee Dee Dunleavy NEW
Simon Beaumont
in
in
2020
2020
Drive Ben Fordham Tom Elliot Oliver Peterson
Nights John Stanley Denis Walter NEW Chris Ilsley
in
2020A new era for breakfast
Ben Fordham Live
Sydney’s Best Breakfast

 After launching his career in the 2UE newsroom, and
Sky News Australia, Fordham joined the Nine Network
in 1999 and has been a leading reporter on A Current
 Affair, and a senior journalist for Nine News, including
stints on the Today show, 60 Minutes, and working with
          Laurie Oakes in the Canberra Bureau.

Fordham has been awarded ‘Best Talk Presenter’ five
 times (2014, 2015, 2016, 2018, 2019) and voted ‘Best
 Metropolitan Current Affairs Presenter’ in 2017 in the
              prestigious ACRA Awards.
Breakfast with
Neil Breen
Neil Breen joined the Nine Network at the end of 2012
as executive producer of Today and he has since
been a leading sports reporter for Nine News Sydney,
Sports Sunday, 100% Footy and the Sunday Footy
Show.
Breen is a multi-award winning journalist who has had
a distinguished career in newspapers, during which
he was editor of Australia’s largest selling newspaper,
The Sunday Telegraph, for seven years and sports
editor of The Courier-Mail and The Australian.
Throughout his career, he has been at the forefront of
exclusive political and general news stories – the
perfect complement for talkback radio.Our digital future
Nine's new world liv ing content partnerships allow brands to engage with consumers while at home.

        Health Today                 Getting Together Today                 The New Active                     Brighten Up                   Finance Forward
   Health Today is an essential     As the pandemic continues to       For many Australians exercise         Brighten Up the lives of     As consumers worry about
     guide to help consumers          change the way we live, the       plays a crucial role in their    Australians and join the at-        job security, financial
navigate through their wellbeing        way we connect with our         everyday lifestyle, and the        home beauty revolution.                security and
 concerns, whether it’s physical       friends, families, colleagues     struggle to maintain it at             Inspire and inform       impacts on superannuation,
 health, mental health, nutrition   and community changes with          present is real. The question     consumers with at-home,        many are taking conservative
    or financial. Coming to life    it. Join Nine as we engage the       on everybody's lips is how       self-care beauty solutions     action to help keep a closer
   across Nine’s TV, publishing,        depth and breadth of the        can I maintain my physical      from Australia’s best beauty        eye on their finances.
 radio and digital assets, Health     Nine ecosystem with Getting      and mental health indoors?       influencers, and harness the
Today will bring together experts    Together Today, exploring the         What defines The New               power of immerse ad        With Finance Forward brands
and unite household brands like           latest in technology, the     Active? From TV, publishing       creative and high impact        have a real opportunity to
        Sunday Life, TODAY,          meaning of connection, and         and radio to digital, we set     publishing stunts – all while       offer guidance, help
9Honey and Good Food to start          the state of the nation in a     out to motivate and guide             aligning with the best     and information to consumers
 a home health revolution right              world of isolation.        Australians with the best in      lifestyle brands Australians    about cost savings/relief or
          across Australia.                                                health and wellbeing.                  know and love.            other measures to help
                                                                                                                                           alleviate financial stress.
Integrated
Fireplace & Brand TVCs TVCs
Halfpage
Content
Series
Miniscrollers
Augmented
Reality
Mobile
Interscrollers
Interstitials
Infographic
Inserts
Native
article
& stories
Reverse
Wraps Covers
Advertorial Quiz
Image-LedIn summary
Consumer habits and media consumption is changing
and growing
Brand safe and cocooning content performing
Huge audience growth in data rich and addressable channels
Work with us to realise big ideasYou can also read