Minor intron retention drives clonal hematopoietic disorders and diverse cancer predisposition
←
→
Page content transcription
If your browser does not render page correctly, please read the page content below
Articles
                                                                                                         https://doi.org/10.1038/s41588-021-00828-9

Minor intron retention drives clonal hematopoietic
disorders and diverse cancer predisposition
Daichi Inoue1,2,12, Jacob T. Polaski 3,12, Justin Taylor 4,12, Pau Castel 5, Sisi Chen2,
Susumu Kobayashi1,6, Simon J. Hogg2, Yasutaka Hayashi1, Jose Mario Bello Pineda3,7,8,
Ettaib El Marabti2, Caroline Erickson2, Katherine Knorr2, Miki Fukumoto1, Hiromi Yamazaki1,
Atsushi Tanaka1,9, Chie Fukui1, Sydney X. Lu2, Benjamin H. Durham 2, Bo Liu2, Eric Wang2,
Sanjoy Mehta10, Daniel Zakheim10, Ralph Garippa10, Alex Penson2, Guo-Liang Chew 11,
Frank McCormick 5, Robert K. Bradley 3,7 ✉ and Omar Abdel-Wahab 2 ✉

Most eukaryotes harbor two distinct pre-mRNA splicing machineries: the major spliceosome, which removes >99% of introns,
and the minor spliceosome, which removes rare, evolutionarily conserved introns. Although hypothesized to serve important
regulatory functions, physiologic roles of the minor spliceosome are not well understood. For example, the minor spliceosome
component ZRSR2 is subject to recurrent, leukemia-associated mutations, yet functional connections among minor introns,
hematopoiesis and cancers are unclear. Here, we identify that impaired minor intron excision via ZRSR2 loss enhances hemato-
poietic stem cell self-renewal. CRISPR screens mimicking nonsense-mediated decay of minor intron-containing mRNA species
converged on LZTR1, a regulator of RAS-related GTPases. LZTR1 minor intron retention was also discovered in the RASopathy
Noonan syndrome, due to intronic mutations disrupting splicing and diverse solid tumors. These data uncover minor intron rec-
ognition as a regulator of hematopoiesis, noncoding mutations within minor introns as potential cancer drivers and links among
ZRSR2 mutations, LZTR1 regulation and leukemias.

M
           yelodysplastic syndromes (MDS) are clonal blood dis-                small subset (
Articles                                                                                                          NATuRE GEnETICS

simultaneously investigate splicing factor mutations in malignant            The above data, revealing enhanced self-renewal of Zrsr2-null
hematopoietic stem cell (HSC) disorders as well as to identify           HSCs, stand in stark contrast to recent work evaluating the
potential tissue-specific roles of the minor spliceosome. We there-      effects of hotspot mutations in SF3B1, SRSF2 and U2AF1, all of
fore set out to understand the role of loss-of-function mutations        which revealed a perplexing impairment in self-renewal when
in ZRSR2 as observed in myeloid HSC disorders by generating a            these mutations were induced in mice using similar transplan-
mouse model permitting time- and tissue-specific deletion of Zrsr2       tation methods4,23,24. We therefore repeated the above competi-
(Extended Data Fig. 1c,d; also encoded on the X chromosome in            tive transplantation assays using 6-week-old Mx1-Cre;Sf3b1K700E/+
mice). Conditional Cre-mediated excision of exon 4 of Zrsr2, in a        and Mx1-Cre;Srsf2P95H/+ mice alongside Mx1-Cre;Zrsr2fl/y mice
manner that results in an early frameshift, efficiently downregu-        (Extended Data Fig. 4a). We additionally included Mx1-Cre;Tet2fl/fl
lated Zrsr2 mRNA in long-term HSCs (LT-HSCs; lineage-negative            mice, given the well-described effects of Tet2 loss on increasing
CD150+CD48−c-Kit+Sca-1+ cells) and Zrsr2 protein in the spleen           self-renewal and numbers of HSCs in this system16. Similar to the
(Fig. 1a and Extended Data Fig. 1e–h). This was accomplished by          effects of Tet2 deletion, Zrsr2 loss again resulted in increased com-
the generation of Mx1-Cre;Zrsr2fl/y and Mx1-Cre;Zrsr2fl/fl mice,         petitive advantage in vivo (Fig. 1g). This advantage was observed
as Mx1-Cre is a well-established system allowing for conditional,        in the numbers and percentages of BM hematopoietic stem and
time-controlled and efficient deletion of genes in postnatal hemato-     progenitor cells (HSPCs) (Fig. 1h and Extended Data Fig. 4b–d).
poietic cells16–18. Exon 4 was chosen for deletion because deletion of   Moreover, the effect of Zrsr2 loss was strikingly distinct from the
this exon causes a frameshift when skipped and this exon is present      effects of inducing leukemia-associated mutations in Sf3b1 and
in all sequences coding for annotated Zrsr2 isoforms and is highly       Srsf2, which were associated with near-complete loss of hema-
conserved across species.                                                topoiesis (Fig. 1g and Extended Data Fig. 4b). Interestingly, dele-
    Prior work from several animal models of global deletion of core     tion of Zrsr2 in the context of mutant Sf3b1 rescued the impaired
minor spliceosome components (including Rnpc3 in zebrafish and           clonogenic capacity of Sf3b1K700E/+ hematopoietic precursor cells
mice19,20 and small nuclear (sn)RNA species in Drosophila melano-        (Extended Data Fig. 4e,f). These data are quite distinct from prior
gaster21) identified that the minor spliceosome is required for devel-   reports of the lethal phenotype of combined Sf3b1K700E and Srsf2P95H
opment and survival. However, tissue-specific deletion of a minor        mutations25 and may explain the occasional co-occurrence of SF3B1
spliceosome component has not been performed. In contrast to the         and ZRSR2 mutations in patients with myeloid neoplasm26.
loss of viability that results from pan-tissue deletion of core minor
spliceosome components Rnpc3 (refs. 19,20) and the U11 snRNA22, we       Global impairment in minor retention with ZRSR2 loss. We
found that hematopoietic-specific Zrsr2 deletion in 6-week-old male      next sought to understand the mechanistic basis by which ZRSR2
and female mice enhanced proliferation as well as clonogenic capacity    loss causes aberrant HSC self-renewal and MDS. We performed
of Zrsr2-null HSCs in vitro (Fig. 1b,c and Extended Data Fig. 2a,b).     high-coverage RNA-seq on BM samples from patients with MDS
    We therefore evaluated the in vivo self-renewal capacity of          and diverse ZRSR2 mutations (n = 8) and patients with MDS
Zrsr2-null HSCs by performing bone marrow (BM) competi-                  lacking any spliceosomal gene mutation (n = 10) and quanti-
tive transplantation assays, in which Zrsr2 was deleted follow-          fied transcriptome-wide splicing patterns (Extended Data Fig. 5a
ing stable reconstitution of hematopoiesis with equal numbers of         and Supplementary Tables 1 and 2). ZRSR2-mutant samples
CD45.2+ Zrsr2-floxed and CD45.1+ WT hematopoietic cells in               were characterized by widespread, dysfunctional recognition of
CD45.1 recipient mice (Extended Data Fig. 2c; in these experi-           U12-type introns, with over one-third of U12-type introns exhibit-
ments, Zrsr2 was deleted in recipient mice 4 weeks following             ing significantly increased retention (Fig. 2a,b). All ZRSR2-mutant
transplantation via polyinosinic-polycytidylic acid (pIpC) admin-        samples exhibited U12-type intron retention, indicating that the
istration to recipients). These assays revealed strikingly enhanced      diverse ZRSR2-mutant lesions represented in our cohort converge
self-renewal of Zrsr2-deficient male and female hematopoietic cells,     on loss of function (Extended Data Fig. 5b–d). Aberrant intron
both in primary and secondary transplantation (Fig. 1d; such an          retention was specific to the minor spliceosome: we observed no
effect was not observed in females with heterozygous deletion of         transcriptome-wide association between ZRSR2 mutations and
Zrsr2 (Extended Data Fig. 2d,e)). This was associated with increased     levels of U2-type intron retention (Extended Data Fig. 5e,f). We
numbers of Zrsr2-null mature B cells and myeloid cells in the blood      confirmed the robustness of our results by reanalyzing data from
(Extended Data Fig. 2f) as well as LT-HSCs and lineage-negative          a published cohort of MDS samples (Extended Data Fig. 5g and
Sca-1+c-Kit+ (LSK) cells in the BM 16 weeks following primary and        Supplementary Table 3)7. ZRSR2-mutant samples in this cohort
secondary transplantation (Fig. 1e and Extended Data Fig. 2g,h).         were similarly characterized by transcriptome-wide U12-type
Similar effects were observed in primary, non-transplanted               intron retention (Fig. 2c,d and Extended Data Fig. 5h). However,
Mx1-Cre;Zrsr2-knockout (KO) mice, in which deletion of Zrsr2             in contrast to our cohort, U2-type introns were also frequently
increased numbers of LT- and short-term HSCs as well as down-            retained in most ZRSR2-mutant samples (Extended Data Fig. 5i,j).
stream progenitor populations (Extended Data Fig. 3a; deletion was       As the two patient cohorts represented different ZRSR2 mutational
induced at 6 weeks of age). Interestingly, Zrsr2 deletion was also       spectra, exhibited both similarities and differences in their splicing
associated with increased total BM mononuclear cells as well as          programs and were orthogonally collected, we hypothesized that
LT-HSCs in the active phase of the cell cycle and undergoing apop-       convergently mis-spliced genes might be particularly important for
tosis (Fig. 1f and Extended Data Fig. 3b,c). Given that these pheno-     disease pathogenesis. We observed a striking overlap in aberrantly
types are key features of human MDS, we also performed detailed          retained U12-type introns, with ~94% of all U12-type introns that
morphological assessments of hematopoietic tissues from primary          were retained in our cohort also being retained in the previously
Zrsr2-KO mice, which revealed modest morphologic evidence of             published cohort7 (Fig. 2e). By contrast, very few (~4%) aberrantly
dysplasia (Extended Data Fig. 3d,e). Overall, Mx1-Cre;Zrsr2-KO           retained U2-type introns were shared between cohorts (Fig. 2f).
mice had numerically hastened death compared to littermate                  Closer inspection of genes of potential disease relevance con-
controls, but this did not reach statistical significance, and there     firmed the robustness and specificity of U12-type intron reten-
were no significant differences in blood counts based on genotype        tion in ZRSR2-mutant samples. Minor spliceosome-dependent
(Extended Data Fig. 3f,g). Other than increased numbers of mature        genes such as ATG3, TRAIP and PARP1 exhibited striking reten-
B220+ cells in the blood and BM, numbers of B cell and T cell sub-       tion of a single U12-type intron, with adjacent U2-type introns
sets in the BM, spleens and thymi of Zrsr2-KO mice were unper-           normally spliced (Fig. 2g and Extended Data Fig. 5k). In each case,
turbed (Extended Data Fig. 3h–m).                                        the U12-type intron was specifically retained in ZRSR2-mutant

                                                                                                   Nature Genetics | www.nature.com/naturegenetics
NATuRE GEnETICS Articles
a b Mx1-Cre control Mx1-Cre Zrsr2 fl/y Mx1-Cre Zrsr2 fl/fl c Mx1-Cre Mx1-Cre; Mx1-Cre;
Mx1-Cre Mx1-Cre; Zrsr2 fl/y Zrsr2 fl/fl
control Zrsr2 fl/y
150 **** **** **** **** **** **** **** **** **** control
75 kDa
Zrsr2
No. colonies
(purification 1) 100
50
75
Zrsr2
(purification 2) 50
50
Actin
37 0
1 2 3 4 5 6 7 8 9
No. platings
d 100
e LSK LT-HSC
P = 0.0167 P = 0.0329
P < 0.0001 P < 0.0001 0.5 P = 0.0369 0.08
P = 0.0003 P = 0.0051
P < 0.0001 P = 0.0035
0.4
No. cells (×106)
0.06
1° transplant
80
0.3
Percent CD45.2+ (%)
0.04
0.2
60 0.02
0.1
Mx1-Cre control
0 0
40 Mx1-Cre;Zrsr2 fl/y
0.3 P < 0.0001 0.05 P < 0.0001
Mx1-Cre;Zrsr2 fl/fl P = 0.0048 P = 0.0086
0.04
No. cells (×106)
2° transplant
20 0.2 0.03
0.02
0.1
0
0.01
0 12 16 28 32
0 0
1° transplant 2° transplant
y
y
fl
fl
l
l
Time post-plpC (weeks)
fl/
fl/
fl/
fl/
tro
tro
2
2
2
2
on
on
sr
sr
sr
sr
C
C
Zr
Zr
Zr
Zr
f g h LT-HSC LSK
P = 0.0017
80 Mx1-Cre control Mx1-Cre;Zrsr2 fl/y 0.08 P = 0.0021 0.4 P < 0.0001
5
Mx1-Cre;Sf3b1K700E/+ Mx1-Cre;Zrsr2 fl/fl
BrdU+ LT-HSCs (%)
P = 0.0101 P = 0.0019
4 Mx1-Cre;Srsf2 P95H/+ 0.06 0.3
Percent
3
0.04 0.2
60
2
Percent CD45.2+ (%)
P= 0.02 0.1
1 0.0005
P= Mx1-Cre control
0 0 0
No. cells
(×106)
0.0013
40 Mx1-Cre;Zrsr2 fl/y
P = 0.0193 MPP ST-HSC
12 Mx1-Cre;Zrsr2 fl/fl
P = 0.0005
0.25 0.08 P = 0.0003
P = 0.0093
Percent Annexin
V+ LT-HSCs (%)
P = 0.0113
0.20 0.06
8
20 P < 0.0001 0.15
0.04
4 0.10
0.05 0.02
0 0
0 0
Pre-pIpC 1 2 3 4
l
O
tro
-K
on
r2
Time (months)
C
s
Zr
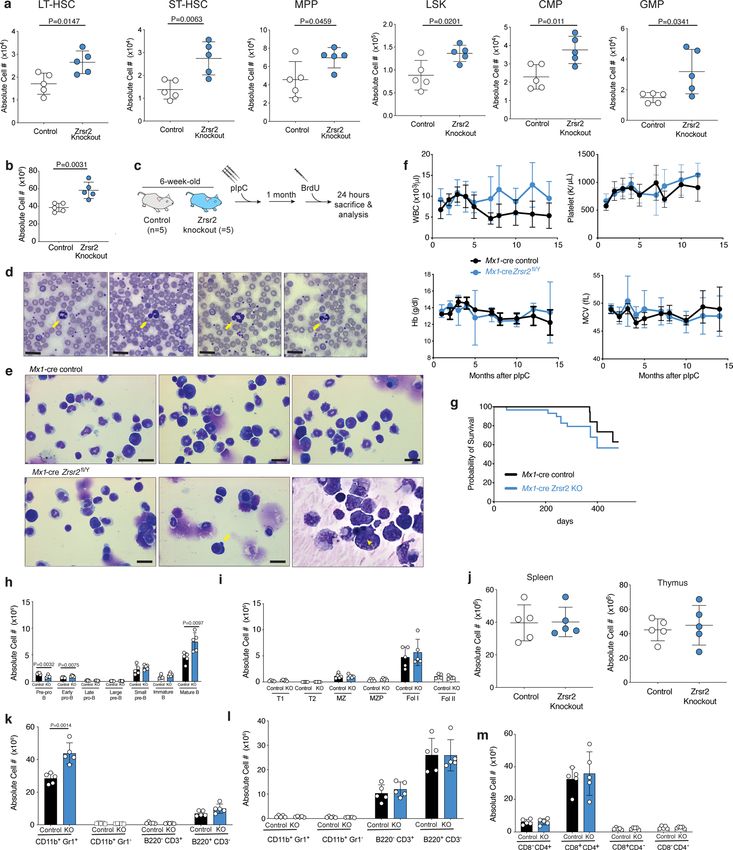
Fig. 1 | Zrsr2 loss increases HSC self-renewal. a, Anti-Zrsr2 western blot in the spleens of 6-week-old Mx1-Cre control and Mx1-Cre;Zrsr2fl/y mice. The
experiment was repeated three times with similar results. b, Number of colonies in methylcellulose colony-forming-unit assays from LT-HSCs from male
and female Zrsr2-KO mice and controls. Mean values ± s.d. are shown. n = 4 biologically independent experiments. P values were calculated by two-sided
t-tests, ****P < 0.0001. c, Representative photograph of the initial methylcellulose plating from b. d, Box-and-whisker plots of the percentage of peripheral
blood CD45.2+ cells in competitive transplantation assays after pIpC administration using CD45.2+ Mx1-Cre control, Mx1-Cre Zrsr2fl/y and Mx1-Cre Zrsr2fl/fl
mice. For box-and-whisker plots throughout, bars indicate medians, box edges indicate first and third quartile values, and whisker edges indicate minimum
and maximum values. e, Box-and-whisker plots of absolute numbers of LSK cells and LT-HSCs in the BM of recipient mice following 16 weeks of primary
(top) and secondary (bottom) transplantation from d. f, Box-and-whisker plots of percentages of bromodeoxyuridine (BrdU)+ and Annexin V+ LT-HSCs
in the BM of primary 6-week-old Zrsr2-KO and control mice. g, Percentage of peripheral blood CD45.2+ cells in competitive transplantation assays before
and after pIpC administration using CD45.2+ Mx1-Cre control (n = 10), Sf3b1K700E/+ (n = 9), Srsf2P95H/+ (n = 8), Zrsr2fl/y (n = 10) and Tet2fl/fl (n = 10) mice. Error
bars represent mean values ± s.e.m. P values were calculated by two-sided t-tests, using the values at 4 months. h, Absolute numbers of CD45.2+ LSK
cells, LT-HSCs, multipotent progenitors and short-term (ST)-HSCs in the BM of recipient mice following 16 weeks of competitive transplantation from g.
P values were calculated relative to the control group by two-sided t-tests and are indicated in the figures.
MDS, but not in MDS without spliceosomal mutations, relative to leukemia-associated spliceosomal gene mutations, we quanti-
normal BM in both cohorts (Fig. 2h and Extended Data Fig. 5l). fied the number of retained U12-type introns across patients with
To further evaluate the specificity of minor intron splicing across bona fide deleterious mutations in ZRSR2 versus known hotspot
Nature Genetics | www.nature.com/naturegenetics
Articles                                                                                                                           NATuRE GEnETICS

mutations in SF3B1, SRSF2 and U2AF1 in the 427 patients with                       portion of minor introns are regulated by ZRSR2, we next evaluated
AML from the Beat AML study27. This analysis revealed a striking                   the sequence features of introns that were retained upon ZRSR2 loss.
enrichment for U12-type intron retention in patients with mutated
ZRSR2 but no such enrichment for patients with SF3B1, SRSF2 or                     Characteristics of ZRSR2-regulated introns. We previously
U2AF1 mutations (Fig. 2i). U12-type intron retention was gener-                    reported that, while branchpoints within U2-type introns are highly
ally associated with downregulated mRNA expression of U12-type                     constrained in their location, branchpoints within U12-type introns
intron-containing genes (Extended Data Fig. 5m).                                   exhibit a bimodal distribution, such that half of U12-type introns
    Consistent with the effect of ZRSR2 mutations in MDS on splic-                 have branchpoints similar in location to U2-type branchpoints, while
ing, hematopoietic precursors (lineage-negative c-Kit+ cells) from                 half of U12-type branchpoints occur in closer proximity (within 20
mice deficient for Zrsr2 exhibited global increases in U12-type                    nucleotides) to the 3′ splice site (3′ss)29 (Fig. 3e). To test whether this
intron retention without significant changes in U2-type splicing                   bimodality was relevant to ZRSR2 responsiveness, we augmented
(Fig. 2a,j,k; RNA-seq analysis was performed 2 months following                    our previously published branchpoint annotation by querying avail-
pIpC administration to 6-week-old Mx1-Cre;Zrsr2fl/y and Mx1-Cre                    able RNA-seq data from cohorts within the Cancer Genome Atlas
control mice). Moreover, a number of overlapping U12-type introns                  (TCGA) to search for lariat-derived reads that span the 5′ splice site–
were similarly retained in the BM of Zrsr2-KO mice but not in con-                 branchpoint junction within minor introns. Such reads are extremely
trol mice, consistent with the high conservation of U12-type introns               rare due to typically rapid lariat degradation (hence the need for an
(Fig. 2a,l and Supplementary Table 4). These comparisons strongly                  extremely large-scale analysis) but allow for inference of branchpoint
suggest that U12-type intron retention is the central molecular                    location with nucleotide-level resolution. Using this large U12-type
phenotype of cells with ZRSR2 mutations and that U2-type intron                    branchpoint annotation, we discovered that introns that responded to
retention is a sporadic occurrence that only characterizes a subset of             ZRSR2 loss had branchpoints that were significantly more proximal
cases of ZRSR2-mutant MDS.                                                         to the 3′ss than did unresponsive introns (two-sided Kolmogorov–
                                                                                   Smirnov test, P < 2.2 × 10⁻¹⁶; Fig. 3f). By contrast, unresponsive
Mapping direct RNA binding targets of ZRSR2. As the above                          U12-type introns exhibited no such spatially restricted enrichment,
data identify a strong functional link between ZRSR2 and minor                     suggesting that branchpoint location influences U12-type intron sus-
introns, we next sought to understand the mechanistic basis for this               ceptibility to retention in the absence of ZRSR2 (ref. 29). We therefore
relationship by identifying direct binding targets of ZRSR2 in RNA.                examined the branchpoint more closely as a potential determinant
We therefore performed anti-ZRSR2 eCLIP-seq28 (enhanced UV                         of response to ZRSR2 loss. This revealed that ZRSR2-responsive
cross-linking immunoprecipitation followed by next-generation                      introns preferred adenosine nucleotides as branchpoints (Fig. 3g;
sequencing) in human myeloid leukemia (K562) cells (Extended                       P = 1.5 × 10⁻⁵ by two-sided binomial proportion test), had more
Data Fig. 5n,o). This revealed that ~80% of ZRSR2-binding sites                    branchpoints per intron than ZRSR2-unresponsive introns (Fig. 3h;
mapped to exons, with a highly significant enrichment for ZRSR2                    P = 0.03 by two-sided t-test) and had branchpoints that more closely
binding to minor intron-containing genes, the minor introns of                     matched the U12 snRNA consensus sequence (Fig. 3i; P = 5.2 × 10⁻¹⁶
which were responsive versus unresponsive to ZRSR2 mutations                       by Wilcoxon rank-sum test). ZRSR2-responsive minor introns addi-
(Fig. 3a,b and Extended Data Fig. 5p; P value < 2.2 × 10⁻¹⁶ with                   tionally had less-defined polypyrimidine tracts and a reduced prefer-
an odds ratio in the range (95% confidence interval) of 2.1–2.5).                  ence for G at the +1 position than unresponsive introns (Fig. 3j,k and
ZRSR2 binding was specifically enriched in minor introns, consis-                  Extended Data Fig. 5q). Overall, these data demonstrate that U12-type
tent with our analyses of the effects of ZRSR2 loss on minor intron                introns fall into two classes: those that are resistant to ZRSR2 loss and
retention (Fig. 3c). Finally, ZRSR2-bound mRNA was enriched for                    those that respond strongly to ZRSR2 loss. Responsive introns are typ-
mRNA encoding RNA regulatory proteins as well as for that cor-                     ically characterized by a 3′ss-proximal, adenosine branchpoint that is
responding to genes with known involvement in leukemia and                         surrounded by nucleotides that closely resemble the U12 snRNA con-
protein processing and translation (Fig. 3d). Overall, these analyses              sensus, as well as by having a weak or absent polypyrimidine tract.
demonstrate that minor intron-containing genes with splicing regu-
lated by ZRSR2 are direct binding targets of ZRSR2.                                Positive-enrichment screen of ZRSR2-regulated events. One
    Both RNA-seq and eCLIP-seq analyses above identified that                      major challenge with understanding how RNA splicing fac-
approximately only one-third of U12-type intron-containing genes                   tor mutations cause disease is determining whether the observed
are sensitive to loss of ZRSR2. To understand the specificity of                   phenotypes are causally linked to one or many aberrant splicing
ZRSR2 for regulating the splicing of minor introns and why only a                  changes. Our transcriptomic analyses revealed that only a subset of

Fig. 2 | Widespread minor intron retention with ZRSR2 loss. a, Genome-wide quantification of differential splicing of U12-type introns from our patient
cohort with key overlapping mis-spliced mRNA species in mouse hematopoietic precursors (green). Each point corresponds to a single intron and
illustrates the percentage of mRNA in which the intron is spliced out. Blue or red dots indicate introns that exhibit significantly increased or decreased
retention in ZRSR2-mutant versus -WT cells, defined as an absolute change in retention of ≥10% or absolute log fold change of ≥2 with associated
P ≤ 0.05. Green asterisks, minor introns differentially retained in both patients and mice; light green asterisks, minor introns in genes of particular interest
(Parp1, Lztr1 and Atg3). P values were calculated by two-sided Mann–Whitney U tests without adjustment for multiple comparisons. b, Distribution of
U12-type intron retention in ZRSR2-mutant samples (n = 8 mutant and n = 10 WT samples). Blue and red dashed lines, thresholds of −10% and 10% for
differential retention; gold line, median change in intron retention. c, As for a but for the Madan at al.7 cohort. d, As for b but for the Madan et al.7 cohort.
e, Overlap of U12-type intron retention events between the two patient cohorts (n = 8 mutant and n = 4 WT samples). f, As for e but for U2-type introns.
g, RNA-seq coverage plots of U12-type intron retention but not U2-type intron retention in our patient cohort. Plots were averaged over all samples with
the indicated genotypes. h, Box plots quantifying splicing efficiencies of introns illustrated in g relative to normal marrow (median of four normal samples
from Madan et al.7). P values were calculated by two-sided Mann–Whitney U tests. NS, not significant. i, Numbers of retained U12-type introns in samples
bearing any of the four spliceosomal gene mutations from the Beat AML cohort. Distributions of U12-type (j) and U2-type (k) intron retention in Zrsr2-KO
relative to WT mouse precursors. Blue and red dashed lines indicate thresholds of −10% and 10% used for differential retention; gold line indicates the
median change in intron retention. l, Box plots illustrating intron splicing efficiencies in mouse lineage-negative c-Kit+ cells. For h,l, the middle line, hinges,
notches and whiskers indicate medians, 25th and 75th percentiles, 95% confidence intervals and the most extreme data points within 1.5× interquartile
range from the hinge. P values were calculated by two-sided Mann–Whitney U tests.

                                                                                                                  Nature Genetics | www.nature.com/naturegenetics
NATuRE GEnETICS Articles
minor spliceosome-dependent genes are recurrently and robustly We therefore systematically evaluated the potential role of each
mis-spliced, suggesting that not all U12-type introns are equally U12-type intron retention event in cell transformation with a func-
important for disease pathogenesis. tional genomic screen. We mimicked the effects of nonsense-mediated
a Our cohort b j Mouse constitutive
Constitutive introns (U12-type) Constitutive introns (U12-type) introns (U12-type)
100 Up: 7 (1.6%) 12.5
U12-type intron removal (%)
10.0 10
in ZRSR2-mutant MDS
Down: 202 (46%)
PARP1 7.5
75
LZTR1 5.0 5
Density
Density
ATG3
50 2.5
25
0
–20 –10 0 10 20 –20 –10 0 10 20
0 25 50 75 100
Change in intron removal (%) Change in intron removal (%)
U12-type intron removal (%)
in WT MDS More retention Less retention More retention Less retention
c Madan et al. d k Mouse constitutive
Constitutive introns (U12-type) Constitutive introns (U12-type) introns (U2-type)
100 Up, 1 (0.16%) 20 5
U12-type intron removal (%)
Down, 359 (58%) 4
in ZRSR2-mutant MDS
15
3
75 10
ATG3 2
Density
Density
LZTR1
50 PARP1 5 1
25
0
–20 –10 0 10 20 –20 –10 0 10 20
0 25 50 75 100
Change in intron removal (%) Change in intron removal (%)
U12-type intron removal (%)
in WT MDS More retention Less retention More retention Less retention
e Retained U12-type introns f Retained U2-type introns i
Madan et al. Madan et al. 200
Our cohort
11 Our cohort
150 167 892 52 270
No. retained U12-type introns
150
100
g WT
Read coverage
50
ZRSR2-mutant
0
2
2
1
F1
SR
SF
3B
2A
SF
SR
ZR
U
U12 U2 U12 U2 U12 U2
ATG3 TRAIP PARP1
h l Atg3 Traip Parp1
ATG3 TRAIP PARP1
relative to median normal BM)
P = 0.003 P = 0.016 P = 0.017
1 2 1.00 0.97 0.9900
P = 0.004
log2 (intron removal
P = 0.025
Intron removal (%)
NS 2
1 NS 0.98 0.96 0.9875
0
0 1 0.95 0.9850
–1 P = 0.004 0.96
–1 NS
0.94 0.9825
–2 0 0.94
–2 0.93 0.9800
M
(m T)
t)
M DS M
(m T)
t)
BM
(m T)
t)
KO
T
KO
T
KO
an
an
an
T
M al B
M al B
W
S W
S (W
W
W
W
ut
ut
ut
al
D S(
(
S
m
m
m
D
D
or
or
or
M
S
N
N
N
D
D
M
M
Nature Genetics | www.nature.com/naturegenetics
Articles                                                                                                                                                                                                                                               NATuRE GEnETICS

           a                                                                                                                    b 50
                                                                                                                                         40
                                                                                                                                         30

                                                                                                                                Count
                                                                                        1st exon (20%)
                                                                                                                                         20
               Other                                                                                                                     10
                                                                                            Downstream
                exon                                                                                                                        0                                                                                                          Intronic reads
                                                                                            (
NATuRE GEnETICS Articles
a b
sgRNA library Ba/F3
Predicted NMD targets (601 human genes, 593 mouse genes)
2,372 human sgRNA species
2,404 mouse sgRNA species
Four sgRNA species per gene PTEN
7 TM2D1
Gene KO PPP5c 6
Cytokine
Puromycin depletion PCNX3
selection (day 0) 32D
Day 9 LZTR1
Day 7 to day 0
0 0
BaF3-Cas9 Day 0 Day 7
32Dcl3-Cas9 High-throughput 1
TF-1-Cas9 sequencing of
integrated sgRNAs TF-1
c Pten
(FDR = Pten
Ba/F3 2.4 × 10–106) 32D (FDR = TF-1
500 Lztr1 20 1.3 × 10⁻¹⁷) 20
400 (FDR =
2.4 × 10–38) 15 15
–log10 (FDR)
300
10 Lztr1 10
200 (FDR = LZTR1
3.9 × 10⁻⁹) (FDR =
100 5 5
0.03)
0 0 0
0 1,000 2,000 3,000 0 1,000 2,000 3,000 0 1,000 2,000 3,000
Probe rank
d IP, vector e
7.5 WT AML
(n = 325)
PSI = 0.90
0 eCLIP-
FPM
IP, FLAG–ZRSR2 seq ZRSR2 mutant (n = 9)
7.5 PSI = 0.64
P = 1.29 × 10⁻⁵
Read coverage
0
WT MDS SRSF2 mutant (n = 51)
2 PSI = 0.89
Read coverage
SF3B1 mutant (n = 21)
0 RNA- PSI = 0.88
ZRSR2-mutant MSD seq
1.8
U2AF1 mutant (n = 21)
PSI = 0.90
0
U2 U12 U2 U2 U12
LZTR1 LZTR1
f ZRSR2 WT ZRSR2 mutant
1 2 3 4 1 2 3 4 ZRSR2 WT ZRSR2 mutant
18 19 1 2 3 1 2 3
800 bp
LZTR1 100 kDa
500 LZTR1
RT–PCR Western 75
200 18 19 blot
Actin
GAPDH 37
100
Fig. 4 | Impaired LZTR1 minor intron excision confers competitive advantage. a, Schematic of a positive-enrichment custom CRISPR–Cas9 pooled
lentiviral screen to identify functionally important ZRSR2-regulated minor intron splicing events. b, Venn diagram of genes targeted by sgRNA species in
the screen in a across Ba/F3, 32D and TF-1 cells. Numbers of genes identified in the screen in each segment of the Venn diagram are displayed. c, Rank
plot for the −log10 (false discovery rate (FDR)) associated with each sgRNA in the screen from a. sgRNA species targeting the positive control (Pten) and
Lztr1 are highlighted. For the probe-level (per-sgRNA) analysis, we fitted a negative binomial generalized log-linear model and performed a likelihood-ratio
test. False discovery rates were computed using the Benjamini–Hochberg method. d, Top, eCLIP-seq for FLAG immunoprecipitation (IP) from cells
expressing FLAG empty vector or FLAG–ZRSR2 over the region of the minor intron of LZTR1. FPM, fragments per million mapped fragments. Biological
duplicate immunoprecipitation data are overlaid. Bottom, RNA-seq coverage over the same locus in primary human MDS samples, with WT MDS data
colored gray (top) and ZRSR2-mutant MDS data colored blue (bottom). e, RNA-seq coverage plots across the U12-type intron of LZTR1 for patients from
Beat AML with the indicated genotypes. Each coverage plot represents an average across all samples with the indicated genotype, following normalization
to the total number of reads mapped to the coding genes for each sample. PSI, fraction of spliced mRNA. f, Qualitative reverse transcriptase (RT)–PCR gel
for LZTR1 minor intron excision (left) and LZTR1 protein levels (right) in representative samples from patients with MDS and WT or mutant ZRSR2 (n = 4
distinct patient samples or genotypes for RT–PCR and n = 3 distinct patient samples or genotypes for the western blot).
Nature Genetics | www.nature.com/naturegenetics
Articles NATuRE GEnETICS
decay (NMD) caused by loss of minor intron splicing and subse- region of each of the 601 genes, for which corresponding mRNA
quent open reading frame disruption in ZRSR2-mutant cells via was identified as differentially spliced in ZRSR2-mutant MDS
CRISPR–Cas9-mediated gene KO. In this assay, the protein-coding patient samples versus spliceosomal wild-type MDS patient samples
a d Intron 18 e
l
sgRNA
tro
sgLZTR1 intron 18-2 Coding
on
sgControl
2 3 6 12
C
region Intron 18
sg
Human LZTR1 18 19 sgRNA sgRNA
sgLZTR1 intron 18-1 800 bp
sgLztr1 intron 18-2 1 2 7 8 2 3 6 12
18 19 200 LZTR1 100 kDa
sgLztr1 intron 18-1 Mouse Lztr1 75
18 19 300
GAPDH 50 LZTR1
b 100
8
37
Sequences
6
4
2 LZTR1 25 RIT1
0 25
Pan-RAS
37 Actin
c f Coding Intron 18 g Coding Intron 18
nucleotide is mutated or deleted (%)
region sgRNA sgRNA region sgRNA sgRNA
6 15
Mean increase in intron
(compared to day 2, %)
retention if indicated
50 Days following Days following
Percent GFP+
imatinib (100 nM)
40 4 10 IL-3 withdrawal
30 2 2
20 4 4
10 2 7 5 7
0 10 10
0 15
0 15
Branchpoint
1
2
3
#1
#3
#4
1
2
#1
#2
l
tro
l
tro
1#
1#
1#
8#
8#
tr1
tr1
tr1
18
18
on
on
TR
TR
TR
i1
i1
1i
1i
Lz
Lz
Lz
tr1
tr1
C
C
LZ
LZ
LZ
TR
TR
sg
sg
sg
sg
sg
Lz
Lz
sg
sg
sg
LZ
LZ
sg
sg
sg
sg
h i j P = 0.0028
B
BT
P < 0.0001
In vitro replating 2.0
1Δ
LZ R1
TR
P = 0.0459
T
EV
LZ
P = 0.0021
1.5
+
150 kDa
Relative % GFP
+ P = 0.0003
GFP LSK
cells 100 FLAG
Mx1-Cre LSK 75
control cells 1.0
150
Empty vector 100 0.5
In vivo self-renewal LZTR1
LZTR1 cDNA 75
Mx1-Cre;
LZTR1ΔBTB cDNA Assess blood
Zrsr2 fl/y 0
+ marrow % GFP+
50 Actin
EV
EV
1
B
1
B
WT
TR
TR
BT
BT
LZ
LZ
Δ
Δ
C57/B6 recipient
Control Zrsr2-KO
Fig. 5 | Impaired LZTR1 minor intron excision promotes clonal advantage and effects of LZTR1 re-expression on Zrsr2-null hematopoietic cells.
a, Schematic of the minor intron branchpoint binding region in LZTR1 intron 18 with illustration of intronic sgRNA binding sequences (the U12 conserved
sequence is in red). b, Branchpoint within the minor intron of LZTR1 based on intron lariat-derived RNA-seq reads. The bar represents the number of
supporting high-confidence reads, defined as those with a single identifying mismatch at the branchpoint characteristic of traversal of the 2′–5′ linkage.
c, Logo plot representation of minigene experiments summarizing mean increases in intron retention if the indicated nucleotide is mutated (%). The
height of each nucleotide indicates its requirement for normal excision of the minor intron of LZTR1. d, RT–PCR for LZTR1 intron 18 excision in K562
AML single-cell clones treated with intron 18-targeting sgRNA species. The experiment was repeated three times with similar results. e, Western blot
for full-length LZTR1 using antibodies specific to the N terminus as well as K-, N- and H-RAS (‘pan-RAS’) in K562 single-cell clones treated with sgRNA
species targeting the protein-coding versus intronic sequence of LZTR1. The experiment was repeated three times with similar results. Relative percentage
of GFP-labeled K562 cells from d mixed with equal proportions of unlabeled cells sensitive to imatinib (f) and Ba/F3 cells treated with sgRNA species
targeting the protein-coding region of LZTR1 following interleukin (IL)-3 withdrawal (g) (median percent relative to day 2 is plotted). h, Schema of the
LZTR1 cDNA experiment. Lineage-negative cells from Mx1-Cre Zrsr2 control and Zrsr2fl/y mice expressing empty vector, LZTR1 cDNA or LZTR1 cDNA
lacking the sequence for BTB domains (‘ΔBTB’). DAPI−GFP+LSK+ cells were then sorted and tested for replating capacity or transplanted into mice.
i, Western blot for FLAG and LZTR1 in cells expressing N-terminal FLAG-tagged empty vector (EV), LZTR1 and ΔBTB LZTR1. The experiment was repeated
twice with similar results. j, Relative percent of GFP+ blood cells from mice receiving lineage-negative cells expressing Mx1-Cre Zrsr2 control or Zrsr2fl/y
constructs from h. Mean values ± s.e.m. are shown. Bars indicate medians, box edges indicate first and third quartile values, and whisker edges indicate
minimum and maximum values. P values were calculated relative to the control group by two-sided t-tests and are indicated in the figures.
Nature Genetics | www.nature.com/naturegenetics
NATuRE GEnETICS                                                                                                                      Articles
and predicted to result in NMD (Supplementary Tables 2 and 3),                  LZTR1 intron retention is transforming. Our functional screens
was targeted by four single guide (sg)RNA species. This was per-                revealed that LZTR1 KO was associated with a uniquely robust
formed as a positive-enrichment CRISPR screen using pools of                    competitive advantage, but CRISPR-based gene KO is an imperfect
lentiviral sgRNA species in cytokine-dependent mouse (32D, Ba/                  model of LZTR1 loss due to impaired removal of its minor intron.
F3) and human (TF-1) hematopoietic cell lines stably expressing                 To address this, we took advantage of a protospacer adjacent motif
Cas9 (Fig. 4a and Supplementary Tables 5–9; similar to an approach              site deep within intron 18 of LZTR1, which is located adjacent to a
we recently used to model mutant splicing factor (SF)3B1-induced                highly conserved sequence matching the consensus motif for the
aberrant splicing events30). Following stable infection with the                minor intron branchpoint (Fig. 5a). Although recent work from our
sgRNA library, cytokines were depleted, and sgRNA representation                group identified that most introns use multiple branchpoints29, we
was evaluated before and 7 d after cytokine removal.                            analyzed intron lariat-derived reads from RNA-seq data and identi-
    This screen revealed several minor intron-containing genes,                 fied that this highly conserved sequence within intron 18 of LZTR1
the downregulation of which conferred cytokine independence to                  contained only a single branchpoint nucleotide (Fig. 5b) located
one or more cell lines (Fig. 4b). Strikingly, only one gene was sig-            proximal to the 3′ss, consistent with our genomic analysis of minor
nificantly enriched in all three cell lines (Fig. 4c), LZTR1, which             introns that were vulnerable to ZRSR2 loss (Fig. 3e–f). To function-
encodes a cullin-3 adaptor regulating ubiquitin-mediated suppres-               ally evaluate the requirement for this putative branchpoint and the
sion of RAS-related GTPases31–33 and is subject to loss-of-function             surrounding U12 consensus sequence for splicing of LZTR1, we
mutations in glioblastoma34, schwannomatosis35 and the RASopathy                generated a minigene of LZTR1’s minor intron and flanking exons
known as Noonan syndrome36 (of note, anti-PTEN sgRNA species                    from human cells and performed extensive mutagenesis reactions.
were included here as a positive sgRNA control; although PTEN                   This verified that LZTR1 is spliced less efficiently in ZRSR2-null
has a minor intron, its splicing did not consistently differ between            cells than in WT cells and identified the conserved U12 intronic
ZRSR2-WT and -mutant cells). Inspection of transcriptomic data                  sequence as required for ZRSR2-dependent excision of the minor
from primary patient samples confirmed the link between aberrant                intron (Fig. 5c and Extended Data Fig. 6k–m).
splicing of LZTR1 and MDS pathogenesis, as we identified retention                  Delivering sgRNA species targeting the intronic U12 consen-
of a U12-type intron in LZTR1 (intron 18) in samples harboring muta-            sus sequence of LZTR1 (which is ten nucleotides from the closest
tions in ZRSR2 (which was specific to ZRSR2-mutant MDS compared                 protein-coding region of LZTR1) induced robust LZTR1 intron
to BM samples from patients with WT ZRSR2 and MDS and unaf-                     18 retention in polyclonal mouse and human cells (Fig. 5d). We
fected individuals; Fig. 4d). Importantly, this same region is a direct         therefore generated multiple clones of LZTR1 minor intron-mutant
binding target of ZRSR2, as revealed by eCLIP-seq in human myeloid              human K562 and Ba/F3 cells (Extended Data Fig. 6n,o) and com-
leukemia cells (Fig. 4d). Moreover, this mis-splicing of LZTR1 was              pared the effects of impaired LZTR1 minor intron excision with del-
specific to patients with ZRSR2 mutations and AML versus those with             eterious mutations in the protein-coding sequence of LZTR1. This
other spliceosomal gene mutations (Fig. 4e). Consistent with intron             revealed that both direct disruption of the protein-coding sequence
retention causing NMD-inducing reading frame disruption, minor                  of LZTR1 and induction of minor intron retention virtually abolished
intron retention in LZTR1 correlated with reduced LZTR1 mRNA                    LZTR1 protein expression, without generating a truncated LZTR1
and LZTR1 protein levels in MDS and AML primary patient samples                 protein product (Fig. 5e and Extended Data Fig. 6p). Similarly,
as well as in mouse hematopoietic precursors (Fig. 4f, Extended Data            inducing mutations within either the protein-coding region of
Fig. 6a–f and Supplementary Table 1). Moreover, blocking NMD by                 LZTR1 or its minor intron resulted in dramatic accumulation of
knockdown of UPF1, a core component of the NMD machinery or                     RAS proteins, including RIT1, a RAS GTPase recently identified as
by pharmacologic inhibition of NMD in ZRSR2-KO cells increased                  an endogenous substrate of LZTR1 (ref. 32), and its corresponding
the mRNA stability and expression of the minor intron-retained                  gene is known to undergo activating mutations in RASopathies and
forms of LZTR1 and an additional ZRSR2-regulated intron in CHD4                 a variety of cancers37,38. Consistent with these convergent effects of
(Extended Data Fig. 6g–j). These data formally confirm that these               protein-coding mutations and minor intron retention in LZTR1,
U12-type intron-containing isoforms are NMD substrates.                         both perturbations conferred cytokine independence to Ba/F3 cells

Fig. 6 | Aberrant LZTR1 minor intron retention in Noonan syndrome, schwannomatosis and diverse cancers. a, Pedigree of a family affected by Noonan
syndrome in which the mother and all four offspring had a mutation within the conserved U12 branchpoint sequence in LZTR1 intron 18. All four children
were diagnosed with Noonan syndrome, and the proband (black circle) developed AML. b, Schematic of the location of the intronic c.220-17C>A
mutation. Intronic nucleotides in blue represent the conserved U12 sequence. c, Sequence conservation (cons) of the LZTR1 minor intron 3′ conserved
sequence and surrounding intronic and exonic sequences (as estimated by phyloP39). The location of the LZTR1 intron 18 branchpoint as well as mutations
in a K562 single-cell clone; the family affected by Noonan syndrome from a and a patient with schwannoma35 bearing mutations in this region are shown.
Conservation and repetitive element annotation from the University of California, Santa Cruz (UCSC) Genome Browser40. Vert., vertebrate. d, Qualitative
RT–PCR gel for LZTR1 intron 18 excision (top) and LZTR1 and RIT1 protein levels (bottom) in immortalized skin fibroblasts from the individuals in a as well
as two healthy control individuals. The experiment was repeated three times with similar results. e, Splicing of the minor intron of LZTR1 across peritumoral
normal (N) and tumor (T) samples in cancers from the indicated TCGA cohorts with available matched normal samples. Normal samples for LAML
comparison were from ref. 41. The horizontal dashed line in each normal column represents the maximum intron retention observed in normal control
samples for each cancer type. Shaded boxes indicate cancer samples exceeding maximum intron retention in normal samples. The percentage next to
each box indicates per cancer type percentage of cancer samples with high intron retention. f, Representative RNA-seq coverage plots for the minor intron
of LZTR1 in bladder and stomach carcinoma and peritumoral normal samples. g, Degree of minor (U12-type) intron retention across normal and tumor
samples in cancers from TCGA. Each point corresponds to a single U12-type intron and indicates the percentage of all tumor samples in which retention
of that intron exceeded the maximum corresponding retention of that intron observed in normal samples. Red dots indicate the U12-type intron of LZTR1;
numbers indicate its percentile rank compared to all other U12-type introns. BLCA, bladder urothelial carcinoma; BRCA, breast invasive carcinoma; CESC,
cervical squamous cell carcinoma and endocervical adenocarcinoma; CHOL, cholangiocarcinoma; COAD, colon adenocarcinoma; ESCA, esophageal
carcinoma; GBM, glioblastoma multiforme; HNSC, head and neck squamous cell carcinoma; KICH, kidney chromophobe; KIRC, kidney renal clear cell
carcinoma; KIRP, kidney renal papillary cell carcinoma; LAML, acute myeloid leukemia; LIHC, liver hepatocellular carcinoma; LUAD, lung adenocarcinoma;
PAAD, pancreatic adenocarcinoma; PCPG, pheochromocytoma and paraganglioma; PRAD, prostate adenocarcinoma; READ, rectum adenocarcinoma;
STAD, stomach adenocarcinoma; THCA, thyroid carcinoma; THYM, thymoma; UCEC, uterine corpus endometrial carcinoma.

Nature Genetics | www.nature.com/naturegenetics
Articles NATuRE GEnETICS
as well as BCR–ABL inhibitor resistance to K562 cells (Fig. 5f,g; of the exact branchpoint nucleotide within intron 18 of LZTR1 ren-
a phenotype originally used to identify LZTR1 as a regulator of dered K562 cells resistant to ATP-dependent or -independent ABL
mitogen-activated protein kinase signaling31). In fact, mutagenesis kinase inhibitors (imatinib or rebastinib, respectively (Fig. 5f and
a d
Mother LZTR1 c.220-17C>A/WT
Father LZTR1 R210*/WT
LZTR1 LZTR1
R210*/WT c.220-17C>A/WT
Children,
Control 48
Control 51
LZTR1 R210*/
c.220-17C>A
1 2 3 4
800 bp 18 19
LZTR1 LZTR1 LZTR1 LZTR1 500
c.220-17C>A/ c.220-17C>A/ c.220-17C>A/ c.220-17C>A/ LZTR1
R210* R210* R210* R210* RT–PCR
200 18 19
GAPDH 100
b LZTR1
c.220-17C>A/WT
100 kDa
LZTR1
75
Exon 18 Exon 19
Western RIT1
25
Actin
37
LZTR1
f Normal bladder Normal stomach
epithelium epithelium
1.3
12
c Branchpoint 0
0 1.5
LZTR1 WT Bladder
K562 intron 18 sgRNA clone carcinoma
0
Family affected by Noonan syndrome 1.1
Patient with schwannoma Stomach
adenocarcinoma
0 2.1
LZTR1 1.5
Intron 18
0 0
100 vertebrates basewise conservation by phyloP 1.7 1.9
4.88
cons
0 0
vert.
0
100
23 0.93
4.50
Multiz alignments of 100 vertebrates 0 0
55 2.7
Rhesus
Mouse
Dog
Elephant 0 0
56 2.6
Chicken
Xenopus tropicalis
Zebrafish
0 0
Lamprey
LZTR1 LZTR1
e
100
Intron splicing (%)
80 41.0% 40.2% 39.9% 32.3%
11.2% 2.48% 1.82%
18.2% 2.70% 1.14% 1.10% 0%
24.8% 6.42% 6.18% 4.44% 2.96% 0.826% 0.568%
60 37.7% 21.2%
12.4%
10.9%
40
20
N T N T N T N T N T N T N T N T N T N T N T N T N T N T N T N T N T N T N T N T N T N T N T
PCPG THYM GBM CESC KICH LUSC COAD UCEC BLCA PAAD READ STAD LUAD ESCA LAML HNSC PRAD KIRC KIRP THCA BRCA LIHC CHOL
g
retention in normal samples (%)
exceeding maximum U12 intron
Percent tumor samples
80
60
40 96.7
97.6
98.5
20 97.6 95.9
87.6 71.9
63.7 76.4 92.1 90.2
86.2 74 69.5 64.3 76.9 78.4 80.3 80.9
BLCA BRCA CHOL COAD ESCA GBM HNSC KICH KIRC KIRP LAML LIHC LUAD LUSC PRAD READ STAD THCA UCEC
Nature Genetics | www.nature.com/naturegeneticsNATuRE GEnETICS Articles
Extended Data Fig. 6q)). Finally, we evaluated the impact of muta- among ZRSR2 mutations and aberrant LZTR1 splicing and expres-
genesis of Lztr1’s minor intron on the clonogenic capacity of mouse sion and frequent LZTR1 U12-type intron retention in diverse can-
HSPCs. This was performed by generating HSC-specific condi- cers and cancer predisposition syndromes.
tional Cas9 knockin mice by crossing HSC-Scl-CreERT Zrsr2-WT Interestingly, the most common somatic mutation in LZTR1
or Zrsr2fl/y mice with Rosa26-Lox-STOP-Lox-Cas9-EGFP knockin reported to date affects a splice site33. Given the prevalence of LZTR1
mice. Infection of BM cells from these mice with sgRNA species deep intronic mutations in cancer predisposition syndromes, it is
targeting the conserved U12 sequence of Lztr1’s minor intron reasonable to hypothesize that the minor intron of LZTR1 may be
strongly promoted replating capacity of Zrsr2-WT HSPCs but not similarly subject to somatic mutations not detected by whole-exome
that of Zrsr2-mutant HSPCs (Extended Data Fig. 7a,b). Conversely, sequencing. Consistent with this concept, LZTR1 intron retention
restoring expression of LZTR1 in Zrsr2-KO HSPCs strongly is not limited to the U12-type intron of LZTR1; several U2-type
impaired their replating capacity as well as their self-renewal in vivo LZTR1 introns are also commonly retained in tumors relative to
(which was not seen with expression of a version of LZTR1 lack- normal tissues (Extended Data Fig. 9b,c).
ing the Broad-complex, Tramtrack and Bric-abrac (BTB) domains Overall, these analyses indicate that LZTR1 is frequently dys-
required for cullin-3 interaction and LZTR1 function; Fig. 5h–j and regulated via perturbed minor intron splicing, much more so than
Extended Data Fig. 7c,d). These data further confirm the impact revealed by studying protein-coding mutations alone. Given our
of impaired Lztr1 minor intron excision on clonogenic capacity. Of finding of frequent post-transcriptional disruption of LZTR1 in
note, although RIT1 was clearly upregulated upon LZTR1 down- the absence of protein-coding mutations, our data motivate study
regulation, the effects of LZTR1 downregulation were not solely of other cancer-associated minor intron-containing genes that may
dependent on RIT1 (Extended Data Fig. 7e,f). This latter point likely be dysregulated via similar and as-yet-undetected aberrant splicing.
reflects the upregulation of multiple RAS proteins upon LZTR1 loss
and underscores the need for future efforts to systematically iden- Online content
tify LZTR1-regulated substrates in hematopoietic cells. Any methods, additional references, Nature Research report-
ing summaries, source data, extended data, supplementary infor-
Impaired LZTR1 splicing in Noonan syndrome and cancer. Our mation, acknowledgements, peer review information; details of
finding that mutagenesis of deep intronic sequences within the minor author contributions and competing interests; and statements of
intron of LZTR1 transformed cells, combined with the fact that data and code availability are available at https://doi.org/10.1038/
LZTR1 is recurrently affected by protein-coding mutations in a vari- s41588-021-00828-9.
ety of cancers34,35, led us to search for aberrant LZTR1 minor intron
excision beyond the context of ZRSR2-mutant MDS. We first studied Received: 28 May 2020; Accepted: 24 February 2021;
cancer predisposition syndromes. Interestingly, in one reported fam- Published: xx xx xxxx
ily with autosomal recessive Noonan syndrome in which one child
died of AML36, the mother and all four children carried an intronic References
mutation within the branchpoint-containing region that we identi- 1. Yoshida, K. et al. Frequent pathway mutations of splicing machinery in
myelodysplasia. Nature 478, 64–69 (2011).
fied within the minor intron of LZTR1 (c.2220-17C>A; Fig. 6a,b).
2. Papaemmanuil, E. et al. Clinical and biological implications of driver
This same sequence is also mutated in schwannomatosis35 (Fig. 6c). mutations in myelodysplastic syndromes. Blood 122, 3616–3627 (2013).
We established immortalized fibroblasts from each family member 3. Haferlach, T. et al. Landscape of genetic lesions in 944 patients with
and unrelated controls and identified clear LZTR1 minor intron myelodysplastic syndromes. Leukemia 28, 241–247 (2014).
retention with consequently impaired LZTR1 protein expression and 4. Kim, E. et al. SRSF2 mutations contribute to myelodysplasia by
mutant-specific effects on exon recognition. Cancer Cell 27, 617–630 (2015).
RIT1 accumulation in individuals bearing the LZTR1 minor intron 5. Ilagan, J. O. et al. U2AF1 mutations alter splice site recognition in
mutation (Fig. 6d and Extended Data Fig. 8a–d). hematological malignancies. Genome Res. 25, 14–26 (2014).
We next interrogated LZTR1 minor intron splicing across the 6. Darman, R. B. et al. Cancer-associated SF3B1 hotspot mutations induce
diverse cancer types profiled by TCGA. The minor intron of LZTR1 cryptic 3′ splice site selection through use of a different branch point. Cell
was efficiently excised in all normal samples. However, a notable Rep. 13, 1033–1045 (2015).
7. Madan, V. et al. Aberrant splicing of U12-type introns is the hallmark of
subset of tumors in almost all profiled cancer types exhibited sig- ZRSR2 mutant myelodysplastic syndrome. Nat. Commun. 6, 6042 (2015).
nificantly increased retention that was specific to the minor intron 8. Gault, C. M. et al. Aberrant splicing in maize rough endosperm3 reveals a
of LZTR1. The extent of LZTR1 intron retention varied between conserved role for U12 splicing in eukaryotic multicellular development.
samples and across cancer types, with a total of 11.1% of all pro- Proc. Natl Acad. Sci. USA 114, E2195–E2204 (2017).
filed cancer samples exhibiting LZTR1 minor intron retention 9. Tarn, W. Y. & Steitz, J. A. A novel spliceosome containing U11, U12,
and U5 snRNPs excises a minor class (AT–AC) intron in vitro. Cell 84,
exceeding that observed in any peritumoral control normal tissue 801–811 (1996).
(Fig. 6e). In some cases, this intron retention was comparable to 10. Hall, S. L. & Padgett, R. A. Conserved sequences in a class of rare
that observed in ZRSR2-mutant MDS, even though ZRSR2 and eukaryotic nuclear introns with non-consensus splice sites. J. Mol. Biol. 239,
other minor spliceosomal factors are not recurrently mutated in 357–365 (1994).
those cancers (Fig. 6f). Moreover, we performed systematic analysis 11. Tarn, W. Y. & Steitz, J. A. Highly diverged U4 and U6 small nuclear RNAs
required for splicing rare AT–AC introns. Science 273, 1824–1832 (1996).
of U12-type as well as U2-type intron retention across all alternative 12. Hall, S. L. & Padgett, R. A. Requirement of U12 snRNA for in vivo splicing of
introns across cancers in TCGA datasets and evaluated the degree a minor class of eukaryotic nuclear pre-mRNA introns. Science 271,
of LZTR1 U12-type intron retention in this context. This analysis 1716–1718 (1996).
revealed that the minor intron of LZTR1 is among the most fre- 13. Burge, C. B., Padgett, R. A. & Sharp, P. A. Evolutionary fates and origins of
quently retained introns across cancer types (top 10% of retained U12-type introns. Mol. Cell 2, 773–785 (1998).
14. Patel, A. A., McCarthy, M. & Steitz, J. A. The splicing of U12-type introns can
minor introns across all cancers; Fig. 6g and Extended Data Fig. 9a). be a rate-limiting step in gene expression. EMBO J. 21, 3804–3815 (2002).
15. Younis, I. et al. Minor introns are embedded molecular switches regulated by
Discussion highly unstable U6atac snRNA. eLife 2, e00780 (2013).
Since the discovery of a second, independent spliceosome in most 16. Moran-Crusio, K. et al. Tet2 loss leads to increased hematopoietic stem cell
self-renewal and myeloid transformation. Cancer Cell 20, 11–24 (2011).
metazoans over 20 years ago10, many questions regarding the role
17. Challen, G. A. et al. Dnmt3a is essential for hematopoietic stem cell
of minor introns in cellular physiology and disease have been enig- differentiation. Nat. Genet. 44, 23–31 (2011).
matic. Here, we uncover a heretofore unrecognized role of minor 18. Li, Q. et al. Hematopoiesis and leukemogenesis in mice expressing oncogenic
intron excision in regulating HSC self-renewal, a molecular link NrasG12D from the endogenous locus. Blood 117, 2022–2032 (2011).
Nature Genetics | www.nature.com/naturegeneticsArticles NATuRE GEnETICS
19. Markmiller, S. et al. Minor class splicing shapes the zebrafish transcriptome 31. Bigenzahn, J. W. et al. LZTR1 is a regulator of RAS ubiquitination and
during development. Proc. Natl Acad. Sci. USA 111, 3062–3067 (2014). signaling. Science 362, 1171–1177 (2018).
20. Doggett, K. et al. Early developmental arrest and impaired gastrointestinal 32. Castel, P. et al. RIT1 oncoproteins escape LZTR1-mediated proteolysis.
homeostasis in U12-dependent splicing-defective Rnpc3-deficient mice. RNA Science 363, 1226–1230 (2019).
24, 1856–1870 (2018). 33. Steklov, M. et al. Mutations in LZTR1 drive human disease by dysregulating
21. Otake, L. R., Scamborova, P., Hashimoto, C. & Steitz, J. A. The divergent RAS ubiquitination. Science 362, 1177–1182 (2018).
U12-type spliceosome is required for pre-mRNA splicing and is essential for 34. Frattini, V. et al. The integrated landscape of driver genomic alterations in
development in Drosophila. Mol. Cell 9, 439–446 (2002). glioblastoma. Nat. Genet. 45, 1141–1149 (2013).
22. Baumgartner, M. et al. Minor spliceosome inactivation causes microcephaly, 35. Piotrowski, A. et al. Germline loss-of-function mutations in LZTR1
owing to cell cycle defects and death of self-amplifying radial glial cells. predispose to an inherited disorder of multiple schwannomas. Nat. Genet. 46,
Development 145, dev166322 (2018). 182–187 (2014).
23. Obeng, E. A. et al. Physiologic expression of Sf3b1K700E causes impaired 36. Johnston, J. J. et al. Autosomal recessive Noonan syndrome associated with
erythropoiesis, aberrant splicing, and sensitivity to therapeutic spliceosome biallelic LZTR1 variants. Genet. Med. 20, 1175–1185 (2018).
modulation. Cancer Cell 30, 404–417 (2016). 37. Berger, A. H. et al. Oncogenic RIT1 mutations in lung adenocarcinoma.
24. Shirai, C. L. et al. Mutant U2AF1 expression alters hematopoiesis and Oncogene 33, 4418–4423 (2014).
pre-mRNA splicing in vivo. Cancer Cell 27, 631–43 (2015). 38. Aoki, Y. et al. Gain-of-function mutations in RIT1 cause Noonan syndrome, a
25. Lee, S. C. et al. Synthetic lethal and convergent biological effects of RAS/MAPK pathway syndrome. Am. J. Hum. Genet. 93, 173–180 (2013).
cancer-associated spliceosomal gene mutations. Cancer Cell 34, 225–241 (2018). 39. Pollard, K. S., Hubisz, M. J., Rosenbloom, K. R. & Siepel, A. Detection of
26. Taylor, J. et al. Single-cell genomics reveals the genetic and molecular bases nonneutral substitution rates on mammalian phylogenies. Genome Res. 20,
for escape from mutational epistasis in myeloid neoplasms. Blood 136, 110–121 (2010).
1477–1486 (2020). 40. Rosenbloom, K. R. et al. The UCSC Genome Browser database: 2015 update.
27. Tyner, J. W. et al. Functional genomic landscape of acute myeloid leukaemia. Nucleic Acids Res. 43, D670–D681 (2015).
Nature 562, 526–531 (2018). 41. Pellagatti, A. et al. Impact of spliceosome mutations on RNA splicing in
28. Van Nostrand, E. L. et al. Robust, cost-effective profiling of RNA binding myelodysplasia: dysregulated genes/pathways and clinical associations. Blood
protein targets with single-end enhanced crosslinking and 132, 1225–1240 (2018).
immunoprecipitation (seCLIP). Methods Mol. Biol. 1648, 177–200 (2017).
29. Pineda, J. M. B. & Bradley, R. K. Most human introns are recognized via
multiple and tissue-specific branchpoints. Genes Dev. 32, 577–591 (2018). Publisher’s note Springer Nature remains neutral with regard to jurisdictional claims in
30. Inoue, D. et al. Spliceosomal disruption of the non-canonical BAF complex in published maps and institutional affiliations.
cancer. Nature 574, 432–436 (2019). © The Author(s), under exclusive licence to Springer Nature America, Inc. 2021
Nature Genetics | www.nature.com/naturegeneticsNATuRE GEnETICS Articles
Methods 1:200), anti-D43 (eBioR2/60, eBioscience, 11-0431-85, 1:200), anti-CD24-BV605
Patient samples. Studies were approved by the institutional review boards of (M1/69, BD Biosciences, 563060, 1:200), anti-CD21/35-PE (4E3, eBioscience,
Memorial Sloan Kettering Cancer Center (MSKCC) and Fred Hutchinson Cancer 12-0212-82, 1:200), anti-CD93-APC (AA4.1, eBioscience, 17-5892-82, 1:200),
Research Center and were conducted in accordance with the Declaration of anti-CD23-e450 (B3B4, BD Biosciences, 48-0232-82, 1:200), anti-CD16/CD32
Helsinki protocol. Informed consents were obtained from all human participants. (FcγRII/III)-Alexa 700 (93, eBioscience, 56-0161-82, 1:100), anti-CD34-FITC
Next-generation sequencing was performed on DNA extracted from BM (RAM34, BD Biosciences, 553731, 1:50), anti-CD34-PerCP (8G12, BD Biosciences,
mononuclear cells and matched normal samples from fingernails. Patient samples 345803, 1:50), anti-CD117-PE-Cy7 (104D2, eBioscience, 25-1178-42, 1:100),
were sequenced with the MSK-IMPACT targeted sequencing panel, and somatic anti-CD45-APC-H7 (2D1, BD Biosciences, 560178, 1:200) and anti-Ly-51-PE (BP-
mutations (substitutions and small insertions and deletions), gene-level focal copy 1, BD Bioscience, 553735, 1:200).
number alterations and structural rearrangements were detected with a clinically The composition of immature and mature hematopoietic cell lineages in the
validated pipeline as previously described42,43. BM, spleen and peripheral blood was assessed using a combination of antibodies
against B220 (RA3-6B2), CD19 (1D3), CD3 (17A2), CD4 (GK1.5), CD8a (53-6.7),
Animals. All animals were housed at MSKCC using a 12-h light–12-h dark cycle CD11b (M1/70), CD25 (PC61.5), CD44 (IM7), Gr-1, IgM (Il/41), IgD (11-26c.2a),
and with ambient temperature maintained at 72 °F ± 2 °F (~21.5 °C ± 1 °C) with CD43 (S11), CD24 (M1/69), Ly-51 (BP-1), CD21/35 (4E3), CD93 (AA4.1), CD23
30–70% humidity. All animal procedures were completed in accordance with the (B3B4), c-Kit (2B8), Sca-1 (D7), CD127 (A7R34) and CD135 (A2F10).
Guidelines for the Care and Use of Laboratory Animals and were approved by the The following antibodies were used for western blotting: anti-Zrsr2
Institutional Animal Care and Use Committees at MSKCC. All mouse experiments (custom, YenZym, 1:1,000), anti-LZTR1 (sc-390166 or sc-390166 X, Santa Cruz
were performed in accordance with a protocol approved by the MSKCC Biotechnology, 1:1,000), anti-RIT1 (ab53720, Abcam, 1:1,000), anti-pan-RAS
Institutional Animal Care and Use Committees (11-12-029). antibody (Thermo Fisher Scientific, MA1-012X, 1:1,000), anti-FLAG (F-1084,
Sigma-Aldrich, 1:1,000), anti-UPF1 (ab109363, Abcam, 1:1,000) and anti-actin
Generation of Zrsr2-conditional knockout mice. Please see the Supplementary (A-5441, Sigma-Aldrich, 1:4,000).
Note for full details.
Cell cycle and apoptosis analyses. Please see full details in the Supplementary
Genetically engineered mice other than Zrsr2-conditional knockout mice. Note.
Sf3b1K700E, Srsf2P95H, HSC-Scl-CreERT, Rosa26-Lox-STOP-Lox-Cas9-EGFP, Tet2
floxed and Mx1-Cre mice were obtained from Jackson Laboratory and were Histological and peripheral blood analysis. Please see full details in the
previously generated and described4,16,23, with the exception of HSC-Scl-CreERT Supplementary Note.
mice44 (which were obtained from J.R. Göthert, University Hospital, West German
Cancer Center (WTZ), University Duisburg-Essen). Cell lines and tissue culture. HEK293T cells were obtained from ATCC and
grown in DMEM with 10% FCS. Ba/F3 and 32Dcl3 cells were grown in RPMI with
Bone marrow transplantation. Please see full details in the Supplementary Note. 10% FCS and 1 ng ml−1 murine IL-3 (PeproTech, 213-13) unless noted otherwise.
TF-1 cells were grown in RPMI with 10% FCS with 2 ng ml−1 recombinant human
Colony-forming assays. LT-HSCs (lineage-negative CD150+CD48−c-Kit+Sca- GM-CSF (R&D Systems, 215-GM) unless noted otherwise. K562 cells were
1+DAPI−) were sorted by flow cytometry from the BM of Mx1-Cre WT, cultured in RPMI with 10% FCS. Human fibroblast cells were from F. McCormick’s
Mx1-Cre;Zrsr2fl/+, Mx1-Cre;Zrsr2fl/fl mice and seeded at a density of 100 cells per laboratory and were cultured in DMEM with 20% FCS. All cell culture media
replicate into cytokine-supplemented methylcellulose medium (MethoCult M3434, included penicillin (100 U ml−1) and streptomycin (100 μg ml−1).
Stemcell Technologies). Colonies propagated in culture were scored at day 7.
The remaining cells were resuspended and counted, and a portion was taken for Transformation of primary human fibroblasts. Please see full details in the
replating (100 cells per replicate). Supplementary Note.
LZTR1 cDNA expression experiments. Please see full details in the In vitro competition assay. Please see full details in the Supplementary Note.
Supplementary Note.
CRISPR screening for ZRSR2-regulated U12-type introns. Ba/F3, 32D and
Development of a custom anti-mouse Zrsr2 antibody. The rabbit polyclonal TF-1 cells were transduced with LentiCas9-Blast (Addgene, 52962) and single-cell
antibody against Zrsr2 was generated by rabbit injections (YenZym, sorted into 96-well plates. Among these clones, we used a single clone with strong
Cys-C-Ahx-PEQEEPPQQESQSQPQPQPQSDP-amide; cysteine (C) was assigned Cas9 expression. sgRNA libraries of NMD targets in LZTR1-mutated cells were
for single-point, site-directed conjugation to the carrier protein; Ahx was added as amplified and packaged as lentiviruses. Functional viral titers were obtained
a linker or spacer), followed by affinity purification using standard protocols. by measuring puromycin (2 µg ml−1) resistance after transduction as previously
published45. A titer resulting in 30% of cells surviving puromycin selection was
Antibodies, flow cytometry and western blot analysis. All antibodies for flow calculated. For the NMD library screen, which included 2,600 sgRNA species,
cytometry were purchased from BD Pharmingen, eBioscience or BioLegend. BM triplicate transductions with 8.7 × 10⁶ infected cells each were performed for
mononuclear cells were stained with a lineage cocktail composed of antibodies a coverage of approximately 1,000× representation. The library included four
targeting CD3, CD4, CD8, B220, CD19, NK1.1, Gr-1, CD11b, Ter119 and sgRNA species against each target gene (602 human genes for TF-1-Cas9 and
IL-7Rα. Cells were also stained with antibodies against c-Kit, Sca-1, CD150 594 mouse genes for Ba/F3-Cas9 and 32D-Cas9), 100 control sgRNA species and
and CD48. Cell populations were analyzed using an LSRFortessa (Becton positive control sgRNA species against Pten for Ba/F3-Cas9 and 32D-Cas9 cells
Dickinson) and sorted with a FACSAria II instrument (Becton Dickinson). We and NF1 for TF-1-Cas9 cells. Cells were transduced with lentivirus carrying the
used the following antibodies: anti-B220-APC-Cy7 (clone RA3-6B2, BioLegend, sgRNA library produced by 293FT cells, and puromycin selection (2 µg ml−1) was
103224, 1:200 dilution), anti-B220-PerCP-Cy5.5 (RA3-6B2, eBioscience, performed in IL-3- or GM-CSF-containing medium for 7 d. Next, we washed out
45-0452-82, 1:200), anti-CD3-PE-Cy7 (17A2, BioLegend, 100220, 1:200), IL-3 or GM-CSF (day 0), and surviving cells were collected at 7 d after cytokine
anti-CD3-APC-Cy7 (17A2, BioLegend, 100222, 1:200), anti-Gr-1-APC (RB6- depletion (day 7). Cell pellets were lysed, and genomic DNA was extracted
8C5, eBioscience, 25-5931-82, 1:500), anti-CD11b-FITC (M1/70, BioLegend, (Qiagen) and quantified by Qubit (Thermo Scientific). A quantity of gDNA
101206, 1:200), anti-CD11b-APC-Cy7 (M1/70, BioLegend, 101226, 1:200), covering a 1,000× representation of gRNA species was amplified by PCR using Q5
anti-NK1.1-APC-Cy7 (PK136, BioLegend, 108724, 1:200), anti-Ter119-APC-Cy7 High-Fidelity Polymerase (New England Biolabs, M0491) to add Illumina adaptors
(Ter119, BioLegend, 116223, 1:200), anti-c-Kit-APC (2B8, BioLegend, and multiplexing barcodes. Amplicons were quantified by Qubit and Bioanalyzer
105812, 1:100), anti-c-Kit-PerCP-Cy5.5 (2B8, BioLegend, 105824, 1:100), (Agilent) and sequenced on the Illumina HiSeq 2500. Sequencing reads were
anti-c-Kit-BV605 (ACK2, BioLegend, 135120, 1:100), anti-Sca-1-PE-Cy7 (D7, aligned to the screened library, and counts were obtained for each gRNA. We used
BioLegend, 108102, 1:100), anti-CD45.1-FITC (A20, BioLegend, 110706, 1:200), standard methods from the R–Bioconductor package, and the specific package
anti-CD45.1-PerCP-Cy5.5 (A20, BioLegend, 110728, 1:200), anti-CD45.1-BV711 was edgeR. For the probe-level analysis, we used the standard workflow with the
(A20, BioLegend, 110739, 1:200), anti-CD45.1-APC (A20, BioLegend, 110714, glmLRT option for model fitting and statistical tests. For gene-level analysis, we
1:200), anti-CD45.2-PE (104, eBioscience, 12-0454-82, 1:200), anti-CD45.2-Alexa used the camera analysis function, also from edgeR, as previously described46,47.
700 (104, BioLegend, 109822, 1:200), anti-CD45.2-BV605 (104, BioLegend,
109841, 1:200), anti-CD48-PerCP-Cy5.5 (HM48-1, BioLegend, 103422, 1:100), CRISPR-directed mutations. Cas9-expressing K562 and Ba/F3 cells were
anti-CD150-PE (9D1, eBioscience, 12-1501-82, 1:100), anti-CD127 (IL- transduced with the iLenti-guide-GFP vector targeting LZTR1 and Lztr1
7Rα)-APC-Cy7 (A7R34, BioLegend, 135040, 1:200), anti-CD8-APC-Cy7 (53-6.7, exonic and intronic sequences in which sgRNA expression was linked to GFP
BioLegend, 100714, 1:200), anti-CD19-APC-Cy7 (6D5, BioLegend, 115529, 1:200), expression. For the in vivo competition assay, the percentage of GFP-expressing
anti-IgM-PE (II/41, eBioscience, 12-5790-82, 1:200), anti-IgD-FITC (11-26c.2a, cells was then measured over time after infection using the BD LSRFortessa. The
BioLegend, 405704, 1:200), anti-CD135-APC (A2F10, BioLegend, 135310, 1:200), GFP-positive rates in living cells at each point normalized to those at day 2 after
anti-CD4-APC-Cy7 (GK1.5, BioLegend, 100413, 1:200), anti-CD25-BV711 lentiviral transduction were calculated. For RT–PCR and western blot analyses,
(PC61.5, BioLegend, 102049, 1:200), anti-CD44-APC (IM7, BioLegend, 103012, sgRNA-transduced cell lines were single-cell sorted into 96-well plates using a
Nature Genetics | www.nature.com/naturegeneticsYou can also read