Monarch Butterfly Habitat Quantification Tool Specifications Document - April 17, 2017 - Environmental Defense ...
←
→
Page content transcription
If your browser does not render page correctly, please read the page content below
Monarch Butterfly
 Habitat Quantification Tool
 Specifications Document

April 17, 2017 Version 1.0
MONARCH BUTTERFLY HQT SPECIFICATIONS DOCUMENT PAGE 2 ACKNOWLEDGEMENTS The Monarch Butterfly Habitat Quantification Tool is being developed for the Monarch Butterfly Habitat Exchange. It is the product of Environmental Defense Fund, Environmental Incentives, and the Monarch Lab at the University of Minnesota. The expert insight and guidance provided by the Monarch Lab has been essential to the development of this document and the HQT in general. Authors and contributors of this document include: Monarch Lab: Karen Oberhauser, Ph.D., Carl Stenoien, and Kelly Nail, Ph.D. Monarch Joint Venture: Wendy Caldwell Environmental Incentives: Eoin Doherty, Erik Anderson, Chris Sonnier and Lauren Morrell Environmental Defense Fund: David Wolfe and Audrey Archer Members of the Monarch Lab who have participated in field testing the HQT are also appreciated: Monarch Lab: Kyle Kasten and Laura Lukens Related Products The Monarch HQT consists of a set of products, each with different purposes and audiences. Monarch HQT Specifications Document (this document): describes the scientific approach for quantifying impacts and benefits to monarch habitat for use in the Monarch Butterfly Habitat Exchange. It includes a description and definition of the attributes measured, methods of evaluating suitability for each attribute, and supporting documentation (e.g., peer-reviewed literature, gray literature, expert opinion). Monarch HQT User’s Guide: provides detailed instructions for assessing monarch habitat using the Monarch HQT. It is intended for experienced field biologists but may be used by knowledgeable landowners or managers. Refer to the appropriate version for the region in which the assessment is conducted. Monarch HQT Credit Project Calculator: an Excel-based tool that computes habitat suitability, functional acres and monarch yield based on parameters measured at the site. Refer to the appropriate version for the region in which the assessment is conducted. Review of the HQT Specifications documentation is not required to apply the Monarch HQT. Recommended Citation Anderson, E.T., K.S. Oberhauser, C. Stenoien, W. Caldwell, K.R. Nail, D. Wolfe, A. Archer. 2017. Monarch Habitat Quantification Tool Specifications Document. Prepared by Environmental Incentives, LLC. V1.0
MONARCH BUTTERFLY HQT SPECIFICATIONS DOCUMENT PAGE 3

Contents
 INTRODUCTION .............................................................................................................. 5
 MONARCH CONSERVATION STATUS............................................................................ 5
 CONSERVATION TARGETS ............................................................................................. 6
 Monarch Habitat ........................................................................................................ 7
 Monarch Population .................................................................................................. 7
 APPROACH TO QUANTIFYING HABITAT QUALITY ........................................................ 7
 APPLICATION OF THE HQT ............................................................................................. 9
 Geographic Scope .................................................................................................... 9
 Intended Users ........................................................................................................... 10
 Intended Uses ............................................................................................................ 11
 Exclusions .................................................................................................................... 11
 Application Scale ..................................................................................................... 11
 INDICATOR FRAMEWORK ............................................................................................ 13
 SITE CAPACITY ............................................................................................................. 13
 MILKWEED AVAILABILITY .............................................................................................. 13
 Density of Native Milkweed Stems ......................................................................... 13
 Diversity of Native Milkweeds.................................................................................. 15
 Presence of Non-Native Milkweed ........................................................................ 17
 Combined Milkweed Suitability Index ................................................................... 17
 NECTAR SOURCE AVAILABILITY .................................................................................. 18
 Blooming Forb Frequency ....................................................................................... 18
 Blooming Forb Richness ........................................................................................... 21
 Combined Nectar Source Suitability Index .......................................................... 22
 SITE SIZE........................................................................................................................... 23
 THREATS ........................................................................................................................ 23
 RISK OF PESTICIDE EXPOSURE ...................................................................................... 24
 COMBINED THREAT SI ................................................................................................... 25

 V1.0
MONARCH BUTTERFLY HQT SPECIFICATIONS DOCUMENT PAGE 4

OPPORTUNITY ............................................................................................................... 25
CONSERVATION PRIORITY ........................................................................................... 26
 REGIONAL CONSERVATION PRIORITY ....................................................................... 26
AGGREGATION METHOD ............................................................................................ 27
 BREEDING HSI ................................................................................................................ 27
 FORAGING HSI .............................................................................................................. 27
 COMBINED HSI .............................................................................................................. 28
 FUNCTIONAL ACRES..................................................................................................... 28
INTERPRETATION OF HSI & FUNCTIONAL ACRES ........................................................ 29
 HABITAT SUITABILITY INDEX ........................................................................................... 29
 FUNCTIONAL ACRES..................................................................................................... 29
 MONARCHS CONTRIBUTED TO WINTER POPULATIONS ........................................... 29
LIMITATIONS ................................................................................................................. 30
QUALITY ASSURANCE .................................................................................................. 30
 FIELD TESTING ................................................................................................................ 31
 SENSITIVITY ANALYSIS .................................................................................................... 31
 EXTERNAL REVIEW ......................................................................................................... 35
REFERENCES ................................................................................................................. 37
APPENDIX A: OVERVIEW OF MONARCH BIOLOGY ................................................... 42
 Eastern Monarchs Migratory Cycle........................................................................ 42
 Western Monarchs Migratory Cycle ...................................................................... 43
 APPENDIX B: OTHER FACTORS THAT AFFECT MONARCH PRODUCTION, SURVIVAL
AND MIGRATION ......................................................................................................... 44
 Climate Change ....................................................................................................... 44
 Natural Enemies ........................................................................................................ 44

 V1.0
MONARCH BUTTERFLY HQT SPECIFICATIONS DOCUMENT PAGE 5

INTRODUCTION
 The Monarch Habitat Exchange (Exchange) is an incentives-based program intended to promote
 restoration and protection of monarch habitat across the U.S. The program supports farmers,
 ranchers and other land managers to create, enhance and manage/maintain monarch habitat.
 Participants can generate “credits” based on the suitability of monarch habitat on their property
 and uplift resulting from restoration and conservation actions. Conservation organizations,
 philanthropists, corporations, and others can purchase credits to fund monarch conservation and
 mitigate risks to monarch populations.
 The Monarch Habitat Quantification Tool (HQT) is used by the Exchange to evaluate habitat and
 estimate benefits to monarchs. An HQT is a science-based approach to assessing habitat
 suitability and conservation outcomes for a species. The purpose of an HQT is to facilitate
 efficient resource allocations for species conservation and incentivize landowners to participate
 in species conservation. An HQT can be used to assess a site through time, compare different
 sites or management alternatives, and track program-wide progress towards important
 conservation outcomes.
 The purpose of the Monarch HQT is to measure change in monarch butterfly habitat condition
 within the context of the Monarch Butterfly Habitat Exchange, track changes to meaningful
 habitat variables through time, and report progress towards regional program goals.
 The objectives of the HQT include:
 1. Inform site selection
 2. Measure changes in habitat condition resulting from management actions
 3. In part, facilitate the estimate of payments to landowners for achieving conservation
 outcomes
 4. Monitor ongoing project performance
 5. Track and report progress towards regional program goals
 No existing tools fulfill these objectives for the Monarch Butterfly Habitat Exchange, and so the
 Monarch HQT was created.

 MONARCH CONSERVATI ON STATUS
 Monarchs engender a great deal of public interest (Diffendorfer et al. 2014; Gustafsson et al.
 2015), and thus serve as a flagship species that promotes engagement in conservation among
 many audiences. In 2014, the U.S. Fish and Wildlife Service (USFWS) was petitioned to list the
 North American population of monarchs as threatened under the Endangered Species Act
 (Center for Biological Diversity et al. 2014) and after a positive 90-day finding, the USFWS
 subsequently initiated a status review.
 There are clear indications that the eastern population of monarch butterflies (Danaus plexippus)
 warrants conservation concern. The status of this population is traditionally assessed by
 documenting the area in the Mexican wintering grounds occupied by trees covered by monarchs,

 V1.0
MONARCH BUTTERFLY HQT SPECIFICATIONS DOCUMENT PAGE 6

and this area has declined at a rate averaging ∼0.89 ha/year (Oberhauser et al. 2016), with the
lowest two population sizes recorded during the winters of 2013–2014 and 2014–2015, when
the areas occupied were only 0.67 and 1.13 hectares, respectively (Rendón-Salinas & Tavera-
Alonso, 2015). The White House has announced a goal to increase this population to 225 million
butterflies by 2020, which will occupy an area of ~6 hectares in the Mexican overwintering
grounds (Vilsack and McCarthy 2015).
The western monarch population has also declined to an extent comparable to the eastern
population. Censuses of the western overwintering population began in 1997 and showed a
population size of 1.2 million monarchs, with historical accounts suggesting a population of at
least this size before these counts began (Pelton et al. 2016, Monroe et al. 2016, Center for
Biological Diversity et al. 2014). However, in recent years, population numbers have remained
low, not having gone over 275,000 individuals since 2001 and currently at approximately 74%
below historic levels (Pelton et al. 2016).
The decline of monarch butterflies is likely attributable to the additive effects of several causes.
The primary cause for the eastern population decline is generally accepted to be the loss of
milkweeds due to the use of glyphosate on herbicide-tolerant crops (Pleasants and Oberhauser
2013). The Midwestern U.S. (and specifically the subsection known as the Corn Belt) was once an
important source of milkweed habitat for monarchs; milkweed grew abundantly in agriculture
fields and surrounding areas, and rates of monarch use of these milkweeds suggest that the vast
majority of monarchs that migrated to Mexico each year originated in corn and soybean fields
(Oberhauser et al. 2001). The adoption of glyphosate tolerant crops has devastated milkweed
abundance in much of this landscape (Pleasants and Oberhauser 2013). Other causes for
monarch declines include habitat loss due to land use change, non-target effects of insecticide
use, and overwintering habitat loss and degradation (summarized by Stenoien et al. 2016). There
are several studies that document monarch mortality from disease and natural enemies
(summarized in Altizer et al. 2011, Altizer & de Roode 2015, De Anda & Oberhauser 2015,
Oberhauser et al. 2015), and the current and impending effects of global climate change pose
potential threats to breeding habitats (Lemoine 2015), overwintering habitats (Ramirez et al.
2015), and monarchs themselves (Nail et al. 2015, Nail & Oberhauser 2015).

CONSERVATI ON GOALS & OBJECTI VES
In order to reduce monarch extinction risk and maintain the annual migration, restoration and
maintenance of sufficient monarch habitat must be achieved (Pleasants 2016). While the eastern
subpopulation accounts for a majority of the monarch population, the conservation of both the
eastern and western subpopulations are considered equally important by the Exchange.
Conservation targets are established for both subpopulations to reflect differences between the
two subpopulations, however it should be noted that there is likely some intermixing of the two
populations (Pyle 2015). These targets provide measurable goals for monarchs to which the
Exchange will contribute; however, specific objectives reflect range-wide needs for monarchs,
and are not specific targets for the Exchange.

 V1.0
MONARCH BUTTERFLY HQT SPECIFICATIONS DOCUMENT PAGE 7

 Monarch Habitat
 Goal: Restore and maintain high-quality, diverse, and distributed monarch habitat throughout
 the breeding range of monarchs in the continental U.S, including the eastern and western
 subpopulations.
 Objective (Eastern subpopulation): Establish and maintain 1.6 billion milkweed stems by 2020,
 primarily in the South Central and North Central regions (Pleasants 2016), as compared to 2016
 levels.
 Objective (Western subpopulation): TBD. There is considerable uncertainty in defining strategies
 appropriate for conservation of monarchs in the West, and thus proposing conservation targets.
 In general, habitat should be created or restored where it is historically appropriate and where
 risk to monarchs, such as through pesticide exposure, is minimal. Protection of existing habitats
 a high priority although it is clear that additional habitat is needed to reverse population declines.
 Monarch Population
 Goal: Restore monarch populations to reduce extinction risk.
 Objective (Eastern subpopulation): Reach and maintain an average of 6 hectares occupied by
 the overwintering population in Mexico by 2020. A recent analysis by Semmens et al. (2016)
 predicted that, if attained, this population target will reduce the risk of eastern population quasi-
 extinction over 10–20 years by more than 50% for all minimum population thresholds
 considered. However, achieving this goal over a longer timeframe may be more realistic.
 Objective (Western subpopulation): Reach and maintain 1.2 million monarchs as counted in the
 Western Monarch Thanksgiving Count (WMTC) by 2025. This would restore monarch populations
 to levels counted in 1997 when censusing first began (Pelton 2016). This objective may be
 modified as conservation planning continues in the West.

APPROACH TO QUANTIFYING HABITAT QUALITY
 The Exchange requires a defensible means for assessing habitat suitability, quantifying benefits
 to monarch habitat from restoration and conservation actions, and communicating
 achievements to investors and other stakeholders. The assessment procedure must be simple
 and efficient and, at the same time, accurate enough to inspire stakeholder confidence and
 precise enough to detect meaningful change.
 To meet these objectives, we developed an HQT using a modified Habitat Evaluation Procedure
 (HEP). In this approach, we relate habitat characteristics (indicators) to observed and expected
 demographic response variables using empirical data and expert opinion. These relationships are
 translated into suitability indices (SIs) for each indicator, such that a given level of any habitat
 characteristic can be interpreted as a level of suitability for monarchs. Suitability indices for

 V1.0
MONARCH BUTTERFLY HQT SPECIFICATIONS DOCUMENT PAGE 8

individual indicators are combined to Key Terms
develop a Habitat Suitability Index (HSI).
 Habitat Suitability – the ability of habitat to sustain
Habitat suitability refers to the ability of monarchs, support reproduction, and contribute to the
habitat to sustain monarchs, support overall population relative to other habitats.
reproduction, and contribute to the Habitat Evaluation Procedure (HEP) – an approach to
overall population relative to other estimating habitat suitability developed by the USFWS.
habitats. Two HSIs (a breeding and a Suitability Index (SI) – defines the relationship between
foraging HSI) are developed to evaluate a habitat characteristic (e.g., milkweed abundance) and
the ability of a site to provide for the suitability of that habitat for monarchs.
breeding and foraging requirements. Habitat Suitability Index (HSI) – a model of habitat
The breeding and foraging HSIs can be suitability which describes the relative value of a
interpreted individually to understand specific habitat to monarchs.
the suitability of the site for each type of Habitat Quantification Tool (HQT) – a tool for
habitat use. assessing, ranking, comparing, and monitoring habitat
The HSIs are combined using a weighted over time and across different sites.
sum model to produce an overall HSI, Functional Acres – calculated by multiplying the habitat
which is multiplied by the area of the site suitability (as a percentage) by the size of the habitat
to calculate functional acres (analogous patch (measured in acres).
to habitat units in the original HEP Monarch Wildlife Habitat Evaluation Guide (WHEG) –
procedure). Functional acres are a tool for assessing monarch habitat used by the NRCS.
intended to reflect the relative
contribution of a site to overall carrying capacity (equilibrium density) and the probability that
individuals or their progeny occupying that site contribute to the winter population. The current
focus of monarch conservation efforts is to increase the capacity of North American habitat to
support monarch production and survival (i.e. the number of monarchs surviving at the end of a
breeding season); thus, it is important that the HQT reflect the contribution of any assessed
habitat towards those efforts. Any given site can contribute to the winter population by
supporting monarchs during spring and early summer breeding and migration, mid to late
summer breeding, and autumn migration. However, the scoring model has not been validated in
the sense of comparing model outputs to long-term measurements of monarch demographic
parameters or population trends. Data to facilitate such model validation are not available
currently, and the development timeline of this HQT precludes gathering these data. When
properly applied, however, the scoring models and their indicators should describe the relative
contribution of a site towards conservation targets.
The Monarch HQT is intended to focus land managers, investors, and other stakeholders on
restoring and protecting high quality and diverse monarch habitat across the contiguous U.S. The
Monarch HQT prioritizes characteristics of monarch habitat that are both (1) primary drivers of
monarch habitat suitability and (2) within the influence of decision makers (e.g., land managers).
Predation, competition, extreme weather, and climate change, among other factors, all affect
monarch population levels, but they will not be assessed because they are largely outside of the

 V1.0
MONARCH BUTTERFLY HQT SPECIFICATIONS DOCUMENT PAGE 9

 influence of land managers. The Monarch HQT should not be confused with more robust
 demographic models such as those under development by the Monarch Conservation Science
 Partnership (MCSP, e.g. Oberhauser et al. 2016). However, data collected during application of
 the HQT may be input into such demographic models to estimate changes to monarch habitat
 and population levels over time.
 To promote collaboration and learning, we strive to maintain compatibility with ongoing data
 collection, habitat evaluation, and demographic modelling efforts, including NRCS Monarch
 Wildlife Habitat Evaluation Guides (WHEGs) and the MCSP Integrated Monitoring Framework, to
 the extent possible. Thus, data collected during HQT habitat assessments can be used to evaluate
 the availability of monarch habitat on a broad scale (a goal of the MCSP Integrated Monitoring
 Framework), and future iterations of the HQT can be parameterized using data from the MCSP
 Integrated Monitoring Framework. We also reviewed existing methods for evaluation of habitat
 for other pollinators, thus allowing land managers to evaluate restoration and enhancement
 efforts for multiple species without unnecessary repetition of effort. The objectives of those
 efforts are different than the objectives of the HQT, and so some deviation was necessary to
 increase sensitivity to desired management actions and discriminate between sites of similar
 quality.

APPLICATION OF THE HQT
 While the data collected during a habitat assessment using the HQT and the outputs of the
 scoring model should be valuable to any assessment of monarch habitat, the HQT is designed to
 be applied within the context of the Monarch Exchange. The priorities of the Monarch Exchange
 are to restore, enhance, and preserve habitat on agricultural lands (e.g., farms and ranches) and
 corridors (e.g., utility rights-of-ways and roadsides). The HQT is intended to evaluate monarch
 habitat on those lands.
 Participants in the Monarch Exchange will be subject to certain limitations and required to
 implement best management practices depending on conditions present at the site. For example,
 participants will not be allowed to apply insecticides on enrolled acreage; apply herbicides except
 to improve habitat for monarchs; or burn, mow or hay during times monarchs may be present.
 Improper management of a site will impact the ability of a site to perform at the capacity
 estimated by the HQT. Recommendations for management actions are provided in the Monarch
 HQT User’s Guide.
 Geographic Scope
 The HQT is applicable in both the eastern and western subpopulations, but it is important to note
 that the methods are based on a clearer understanding of breeding biology for the eastern
 subpopulation, and that ongoing testing and data collection in the Western subpopulation may
 inform future versions of the HQT. Variations of the scoring model are developed for unique
 regions in the U.S. Regional boundaries are based in part on boundaries used in recent studies by

 V1.0
MONARCH BUTTERFLY HQT SPECIFICATIONS DOCUMENT PAGE 10

Oberhauser (2016) and Flockhart (2017) (Figure 1). Suitability levels of indicators and weighting
of indicators in the combined model are modified for regional variations. A unique scoring model
has been developed for the North Central region, South Central region, and for the western
subpopulation. An additional scoring model for the Northeastern and Southeastern U.S. will also
be developed.

Figure 1. The geographic scope of the Monarch HQT includes all breeding and migrating habitats in the continental
U.S. Regional variations of the Monarch HQT have been developed for the regions outlined.

The HQT is expected to eventually cover the entire range of monarch butterfly habitat in the
United States, including breeding/migrating and overwintering habitat types in both the eastern
and western populations, although at this point, more data exist that allow us to quantify habitat
needs for the eastern population during the breeding portion of its annual cycle.
Intended Users
Individuals applying the HQT are expected to have field work experience and at least some
background or training in botany and monarch butterfly biology. NRCS staff may also use the HQT
in conjunction with the NRCS Monarch Butterfly Habitat Development Project and other Farm
Bill programs such as Environmental Quality Incentives Program (EQIP), Conservation
Stewardship Program (CSP), or Wetlands Reserve Easement (WRE) to select project sites or
estimate project outcomes. Organizations such as Pheasants Forever and agencies such as Soil
and Water Conservation Districts may utilize the HQT to design monarch habitat projects. The
MCSP Integrated Monitoring Project could utilize the HQT for users that are unable to carry out
the entire monitoring framework, such as citizen scientists.

 V1.0
MONARCH BUTTERFLY HQT SPECIFICATIONS DOCUMENT PAGE 11

Intended Uses
The HQT is applicable to any breeding or migratory monarch habitat in the United States, but was
specifically designed for use in agricultural areas and within corridors such as rights-of-way.
Agriculture
Agricultural areas offer the largest opportunity for restoring monarch breeding habitat. Examples
of land areas that may be enrolled in this effort include fallow crop lands, marginally productive
land that is currently being farmed, grazing lands, fencerows, and areas between fields.
Roadsides & Rights-of-Way
Roadsides and Rights-of-Way, while perhaps not large contributors to monarch populations in
the past relative to other habitat types, have become more significant due to loss of habitat in
the rest of the agricultural landscape (Flockhart et al. 2015, Kasten et al. 2016). Entities managing
these habitat types have the capabilities and resources to leverage an HQT and increase habitat
availability at a large scale. For example, the Iowa DOT has an Integrated Roadside Vegetation
Management program that supports native plant restoration on roadsides, and the HQT may
serve as a tool to help restore, enhance and manage Iowa roadsides specifically for monarchs.
Other Habitat Types
Gardens and public-agency-managed natural areas are not specific foci of the HQT. However,
while circumstances present in those habitat types may not have been envisioned by this
ecological model, conclusions drawn from this model should be generally applicable in these
habitat types.
Exclusions
Forested areas (forested swamps, riparian forested areas, or forested uplands), bodies of open
water, and other areas where management for monarch habitat is not prioritized should be
excluded from assessment of habitat using the HQT. Land managers may use the Monarch HQT
to inform the prioritization of potential monarch habitats on their property for management as
monarch habitat or for other objectives.
Application Scale
Spatial Scale
The HQT should be applied at the scale of individual parcels, termed ‘assessment areas’ in the
HQT. For large projects, the site should be divided into ecological sites or similar units based on
landscape attributes, soils, vegetation, and management actions to provide meaningful
interpretation of model outputs. Each assessment area is evaluated separately, resulting in an
index value for habitat suitability (i.e., a score between 0 – 100%) and number of functional acres
(i.e., the size of the site measured in acres multiplied by the habitat suitability score, expressed
as a percentage). Results from the evaluation of each analysis area can be combined to inform
credit awards for the entire site. However, each assessment area should be considered separately

 V1.0
MONARCH BUTTERFLY HQT SPECIFICATIONS DOCUMENT PAGE 12 when evaluating management alternatives and assessing outcomes from restoration and enhancement actions. Temporal Considerations Monarchs require milkweed and nectar resources throughout the time they are present in a region. Ideally, data would be collected periodically throughout the year. In order to provide an efficient means of habitat evaluation, we allow for a single site visit to collect data for sites located in the North Central region and Western Subpopulation regions. For sites in the South Central region, two field visits are required because monarchs utilize habitats differently during the spring and fall in this region. Field data should preferably be collected for the HQT during peak monarch site use, but it is important to note that the timing of peak use can vary from year to year. For more information on when monarchs are present near the area of interest, refer to Journey North’s citizen-science observational data available at https://www.learner.org/jnorth. These data indicate first sightings of monarchs; peak monarch site use will take place some weeks after these first sightings. Permissible windows for field data collection are provided in Table 1. Where two sampling windows are provided but only one visit is required (e.g., North Central region), the suitability indices used to assess habitat suitability may vary based on the season of the site visit. While sampling should always be conducted during the permissible window, the exact timing of the field data collection should take into account local conditions—ideally, sampling would take place at peak milkweed density during the sampling window. Table 1. Permissible Sampling Windows REGION SAMPLING WINDOWS North Central May 15 – July 1 (Mid-Season: earlier weeks in south part of region, later in north) July 1 – September 15 (Late Season) South Central March 15 – May 15 (Early Season) September 1 – October 15 (Late Season) Western May 20 – October 1 (early and late periods of this window will not be appropriate in the northern part of the region) Northeast TBD Southeast TBD Results from the HQT assessment reflect the expected capacity of a site to produce and support monarchs over a single year. We assume that intra-annual variability is consistent among all sites or time periods which are being compared, and that diversity of milkweeds and nectar sources is positively correlated with resource availability throughout the year and during atypical weather, such as drought, mitigating the risk of overestimating the value of a site. The scoring model output should not be interpreted as a point-in-time estimate of monarch production. V1.0
MONARCH BUTTERFLY HQT SPECIFICATIONS DOCUMENT PAGE 13 When evaluating a restoration or enhancement project, an HQT assessment should be conducted to establish a benchmark reflecting pre-project conditions and again after the project in order to assess outcomes. INDICATOR FRAMEWORK Indicators—habitat characteristics which are determinant of monarch habitat suitability—are organized within an adaptable framework to facilitate adaptive management of the HQT, as described below: Site Capacity: Site capacity reflects the relative suitability of a site for monarchs based on observed and expected relationships between key habitat characteristics and immature and adult monarch densities. Threats: Threats impact site capacity by reducing the survivorship of monarchs produced and supported by the site. Within the scope of the HQT, the primary threat to monarchs is risk of pesticide exposure. Other threats to monarchs, such as incompatible mowing or haying, are not included in the HQT because those actions are prohibited for projects enrolled in an Exchange. Opportunity: Opportunity describes the ability of a site to perform at its expected site capacity based on local-scale and landscape-scale factors that influence the site. Given that monarchs are considered strong dispersers, and little is known about the effects of the surrounding landscape on monarch habitat, no opportunity indicators are currently included in the HQT. Conservation Priority: Conservation priority is based on the relative contribution of a region to overwintering colony populations, and is informed for the eastern subpopulation by Oberhauser et al. (2016), where prioritization of regions is focused on boosting carrying capacity that will result in increased winter population levels. Prioritization models for the western subpopulation are being investigated. SITE CAPACITY MI LKWEED AVAI LABI LI TY Monarchs rely solely on milkweeds (plants in the genus Asclepias and a few closely related genera) as larval food sources. Therefore, milkweed is an essential feature of monarch habitat. Monarchs and other pollinators also utilize milkweed as a nectar source while in bloom. There are over 100 species of milkweed in North America, although monarch conservation organizations have prioritized species for each region of the U.S. (highlighted on the Monarch Joint Venture’s Milkweed Information Sheet, MJV 2016a). Density of Native Milkweed Stems Because milkweed is necessary for monarch reproduction, it is logical to assume that higher densities of milkweed would lead to greater production of monarchs. However, few studies have measured monarch production based on consistent measures of milkweed density. Milkweed V1.0
MONARCH BUTTERFLY HQT SPECIFICATIONS DOCUMENT PAGE 14

data from the Monarch Larva Monitoring Project (MLMP 2016), for example, are typically
reported on a per-site basis, but not a per area basis. Agricultural studies of milkweed density
often use estimates of the number of square meters “infested” per hectare, but do not report
the actual densities of milkweed stems. To our knowledge, only one study in one region (the
upper Midwestern U.S., Kasten et al. 2016) has done a comprehensive survey of milkweed stem
density and related that to monarch density. Over 1,000 randomly selected 50-meter stretches
of roadside in MN, SD, IA, WI, and IL were evaluated. In a model predicting the density of
immature monarchs on a per area basis, milkweed density was the most significant positive
predictor, but the data suggest that monarch production (monarch egg and larvae per square
meter) in roadsides is maximized at about 0.6 milkweeds per square meter (Kasten et al. 2016).
Although it seems that higher densities may be beneficial for monarch production, it is rare that
areas such as fallow fields and native prairie in the Upper Midwest have milkweed densities
above 0.15 stems per square meter. Accounting for the assumptions made in the analysis, a
reasonable estimate of the density at which the marginal returns for monarchs of additional
milkweed become very low is approximately 0.5 stems per square meter or 2,000 stems per acre
(Figure 2). Densities above 0.5 stems per square meter may be undesirable in most natural
contexts, and rewarding landowners for greater densities may provide a perverse incentive to
manipulate milkweed (and possibly monarch) density beyond sustainable ecological thresholds
and at the cost of other ecosystem services provided by a diverse plant community.
Non-native milkweed species are not counted towards estimates of milkweed density.
In the North Central region, milkweed must be present on site to generate functional acres. Sites
where milkweed is not present or is not expected to be present after creation or restoration of
the habitat on the site should not be evaluated with the HQT.

 V1.0
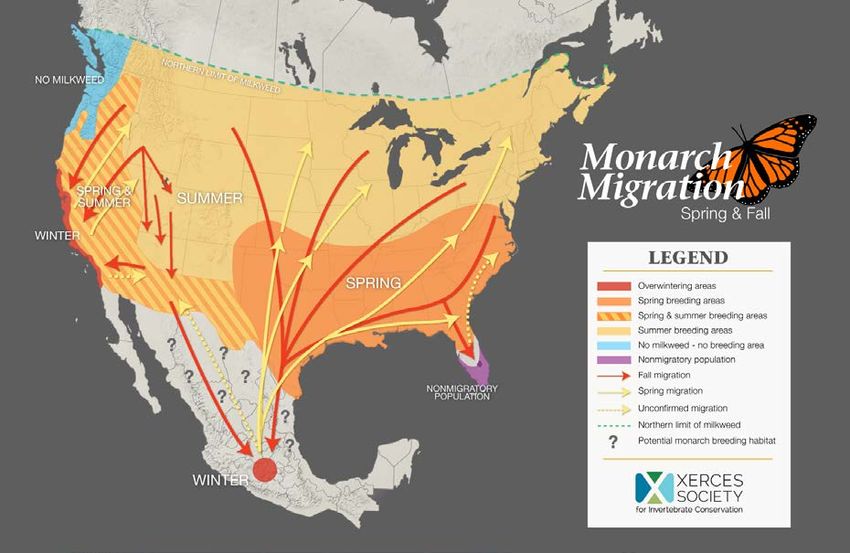
MONARCH BUTTERFLY HQT SPECIFICATIONS DOCUMENT PAGE 15

 Suitability of Milkweed Density (All Regions)
 100%

 (eggs and larvae per acre)
 Immature Monarch Density
 80%

 60%
 Suitability

 40%

 20%

 0%
 0 500 1,000 1,500 2,000
 Density of Native Milkweed Plants (stems/acre)

Figure 2. Milkweed Density Suitability Index (SI) for all regions of breeding/migratory habitat in the U.S. This SI is
derived based on expert opinion of monarch biologists and a comprehensive survey of milkweed stem density and
monarch density, which evaluated over 1,000 randomly selected 50-meter stretches of roadside in MN, SD, IA, WI,
and IL (Kasten et al. 2016). The suitability of milkweed density is related to immature monarch densities (eggs and
larvae per acre).

The Milkweed Density SI is given by Equation 1.
 Equation 1
 2
 = 1 −
 1 + (6 ∗ 2000)

 Where:
 x: density of native milkweed stems expressed in stems per acre

Diversity of Native Milkweeds
Diversity promotes resilience in ecosystems. Each species is adapted to specific conditions
related to soil, temperature, shade, water availability, disturbance, slope, and other factors. Sites
with high diversity are less susceptible to losses of milkweed during weather events such as
drought and other perturbations. Additionally, different milkweed species are more attractive to
monarchs at different times of the year and species with later blooming periods tend to be
available later in the year after species with earlier blooming periods have senesced. For example,
A. verticillata has indeterminate growth, and thus more fresh leaf tissue at the end of the season,
when other species are senescing (Karen Oberhauser, personal observations). A. asperula is

 V1.0
MONARCH BUTTERFLY HQT SPECIFICATIONS DOCUMENT PAGE 16

generally available early in the year and A. latifolia is generally available late in the year (Kristen
Baum, personal observations).
Milkweeds are assumed to be locally adapted and will be better host plants if growing in
conditions similar to those in their evolutionary history. Only native milkweeds should be
included in estimates of milkweed diversity. Monarch Planting Lists developed by the NRCS are
available to determine milkweed species that are native and common to a particular region
(USDA NRCS 2016c). It should be noted that not all regions or sites are suitable for a high diversity
of milkweed species. Consult your local seed provider for information about milkweed species
suitable for any particular site (find milkweed seed providers at www.xerces.org/milkweed-seed-
finder).
Milkweed diversity is expressed as number of effective species, or True Diversity, as calculated
using Simpson’s Index. Simpson’s Index incorporates measures of species richness and evenness,
which provides more information about milkweed diversity than species richness alone (see Data
Transformation section below for application of Simpson’s Index). Optimal values shown on
Figure 3 are derived from best professional judgement.

 Suitability of Milkweed Diversity (All Regions)
 120%

 Increase in immatue monarch density
 100%

 (eggs and larvae per acre)
 80%
 Suitabiilty

 60%

 40%

 20%

 0%
 1 2 3 4 5 6
 True Diversity (# of effective species)

Figure 3. Milkweed Diversity Suitability Index (SI) for all breeding/migratory habitats in the U.S. The SI is derived
based on expert opinion of monarch biologists. Simpson’s Index is used to estimate True Diversity (D), which is
translated to suitability. The suitability of milkweed diversity is related to expected increases in immature monarch
densities (eggs and larvae per acre) as diversity increases. The maximum suitability of 120% provides a ‘bonus’ for
highly diverse sites without penalizing sites with reasonably good diversity.

The Milkweed Diversity SI is given by Equation 2.

 V1.0
MONARCH BUTTERFLY HQT SPECIFICATIONS DOCUMENT PAGE 17

 Equation 2
 1.4
 = 1.2 −
 1 + ( − 1 )

 Where:
 D: number of effective species

Data Transformation
We use Simpson’s Index to estimate the number of ‘effective species’ (D), which is a measure of
diversity that includes both evenness and richness (Equation 3).
Equation 3

 1
 =
 ∑ 2

 Where:
 p: proportional abundance of species i

The intent of this indicator is to differentiate sites commonly assessed by the HQT based on
milkweed diversity. While higher species richness may be desirable, values above the optimal
value are relatively rare in fallow fields and natural areas. A maximum suitability of 120% provides
a ‘bonus’ for highly diverse sites without penalizing sites with reasonably good diversity.
Presence of Non-Native Milkweed
There is some evidence that a non-native milkweed in the southern U.S., A. curassavica, may
facilitate the build-up of a key monarch parasite, Ophryocystis elektroschirra (OE), because it is
available for multiple generations (Satterfield et al. 2015). It may also affect monarch migratory
behavior by being available during times that native milkweeds are not (MJV 2016b). Where A.
curassavica is present on the site, it should be managed by cutting it back in the winter and fall
months in the southern U.S. and California (excluding southern Florida). Data are not available to
estimate an effect on monarch production due to presence or abundance of A. curassavica, so
we have chosen not to discount the value of a site due to its presence, but rather to simply not
include it in the assessment of milkweed density or diversity.
Combined Milkweed Suitability Index
The suitability scores for milkweed density and milkweed diversity are weighted and combined
to calculate overall milkweed suitability according to Equation 4.

 V1.0
MONARCH BUTTERFLY HQT SPECIFICATIONS DOCUMENT PAGE 18

Equation 4

 = ∗ Density SI + ∗ Diversity SI

 Weight for the Density SI and Diversity SI are based on the expectation that high diversity will
 increase monarch production by approximately 20%, which is based on expert opinion.
 Weighting for these two SIs is the same for all geographic regions. Weights are provided in
 Table 2.
 Table 2. Weights for the Combined Milkweed Suitability Index by Region
 REGION DENSITY (WDENSITY) DIVERSITY (WDIVERSITY)
 North Central 80% 20%
 South Central 80% 20%
 Western 80% 20%
 Northeast TBD TBD
 Southeast TBD TBD

NECTAR SOURCE AVAI LABI LI TY
Unlike larvae that rely only on milkweed to survive, adult monarchs use diverse nectar sources
for food. Nectar plants are a key component to prime habitat for monarchs and other pollinators.
Spring blooming nectar plants (blooming approximately March 20—June 1) fuel the monarch
migration northward from Mexico and inland from the California coast. Without abundant nectar
sources through the migratory corridors, monarchs are probably less likely to survive and may
not be able to reproduce successfully. Summer blooming nectar sources (blooming
approximately June 2—August 15) throughout the breeding range are vital to sustain a healthy
breeding population. Fall blooming nectar plants (blooming approximately August 16—October
30) are equally important; monarchs rely on abundant nectar sources in the fall to store enough
energy not only to survive the long journey to their overwintering sites, but also to survive winter
with very minimal nectar availability.
While non-native species can be used for nectar, native nectar plants are often more beneficial
to an ecosystem. Native plants are well suited for the climatic conditions of an area and are
responsible for important ecosystem functions, such as erosion control and filtration. Only native
nectar plants are included in the assessment of nectar source availability. A site without native
nectar plants will receive a score of zero for foraging habitat.
Blooming Forb Frequency
Adult monarchs need continuously available nectar sources for migrating and breeding. Because
migrating monarchs need to convert and store lipids obtained from nectar sources in large
enough quantities to survive the winter, late-season nectar sources from the Great Plains

 V1.0
MONARCH BUTTERFLY HQT SPECIFICATIONS DOCUMENT PAGE 19

southward are critical for wintering survival (Brower et al. 2006). While monarchs are observed
foraging during the winter in Mexico, there are not enough flowers in and near the overwintering
forests to accommodate the millions of monarchs that are there. Overwintering monarchs must
survive during the winter on the lipid reserves that they built up as larvae and as adults during
the fall migration (Alonso-Mejia et al. 1997).
Nectar source availability is assessed by measuring the frequency of blooming forbs in nested
plots, where frequency is defined as the proportion of possible plots within an assessment area
occupied by blooming forbs. Suitability of the assessment area is given by the average index value
for all subplot areas sampled (0.25 m2, 0.5 m2, and 1 m2).

 Suitability of Blooming Forb Frequency per Subplot Area (All Regions)
 100%
 Suitability per Subplot Area

 Adult monarch density
 80%

 (individuals per acre)
 60%

 40%

 20%

 0%
 0% 10% 20% 30% 40% 50% 60% 70% 80% 90% 100%
 Blooming Forb Frequency
 (proportion of plots with blooming forb present)

 Subplot 1 Subplot 2 Subplot 3

Figure 4. Blooming Forb Frequency SI for each subplot area for all breeding/migratory habitats in the U.S. The SI is
derived based on expert opinion of monarch biologists. Frequency data are collected in three subplot areas (0.25
m2, 0.5 m2, and 1 m2). Data are log-transformed to approximate density from frequency. The SI for each subplot area
is averaged to calculate the SI for the assessment area. The suitability of blooming forb frequency is expected to be
related to the density of adult monarchs (individuals per acre) and is based on expert opinion.

The Blooming Forb Frequency SI is given by Equation 5, assuming data are collected from three
subplot areas.
 Equation 5
 3
 1 −ln(1 − )
 = � 0.155 ∗
 3
 =1

 Where:
 fi: frequency of subplot area i expressed as a proportion

 V1.0
MONARCH BUTTERFLY HQT SPECIFICATIONS DOCUMENT PAGE 20

 ai: area of subplot area i

The constant 0.155 is a scaling factor derived from the assumption that approximately 6.4
blooming forbs per m2 represents fully-functioning habitat, which is based on expert opinion of
monarch biologists (0.155 = 1/6.4). This density corresponds to the density of blooming forbs
when the frequency of subplot 1 (0.25 m2) is 80%. Where blooming forb density is calculated to
be greater than 6.4 (i.e., the SI would be greater than 100%), the SI value assigned is 100%.
Data Transformation
Frequency is a rapid, objective, relatively simple method for collecting data on blooming forb
availability, and it has lower sensitivity to periodic fluctuations than similar methods of estimating
forb abundance (e.g., canopy cover). Measures of frequency reflect both density and dispersion.
The availability of nectar sources is probably best approximated by density as opposed to
frequency. The relationship of frequency to density is curvilinear—changes in frequency at
different frequency values do not reflect the same magnitude of changes in density. The
relationship of frequency to density, assuming random dispersion of individuals in the sample, is
given by Equation 6 (Morrison 1995, Hyder 1965).
 Equation 6

 = 1 − exp(− ∗ )

 Where:
 f: frequency of blooming forbs expressed as a proportion
 d: density, or number of blooming forbs per unit area
 a: area of the subplot

The suitability index for each plot area (Equation 5) is derived using this relationship between
frequency and density, as provided by Equation 6. In other words, this data transformation is
implicit in the suitability index; no transformation is required to evaluate the suitability of
frequency data using the suitability index. While this transformation is imperfect, it allows for a
more linear interpretation of frequency data on monarch habitat suitability and partially corrects
for the plot size dependence of frequency data. This allows the HQT to use all three plot sizes in
the calculation of habitat suitability.
During ongoing monitoring of the site, managers should assess changes in frequency values per
species in combination with field observations to inform adaptive management decisions and
should not rely solely on changes in the suitability index as calculated using the HQT.

 V1.0
MONARCH BUTTERFLY HQT SPECIFICATIONS DOCUMENT PAGE 21

Blooming Forb Richness
The number of unique forb species currently in bloom is recorded for the entire assessment area.
Because monarchs require nectar sources throughout the time they are present on the site,
optimal forb richness values are provided for multiple sampling windows (see Table 3). Sampling
during a single window is sufficient for evaluation of habitat in the North Central region and
Western Subpopulation regions, however optimal values for different times of the year provide
important information to land managers to allow them to maximize the suitability of their site
for monarchs by establishing a diverse stand of forbs that provide a source of nectar for monarchs
throughout the year. In the South Central region, two site visits are required, one during each
sampling window (early season and late season).

 Suitability of Blooming Forb Richness (North Central)
 100%

 80%

 Adult monarch density
 (indivduals per acre)
 60%
 Suitability

 40%

 20%

 0%
 0 1 2 3 4 5 6 7 8 9 10
 Blooming Forb Richness (# of unique species)

 Early Season (May 15 - July 1) Late Season (July 1 - Sept 15)

Figure 5. Blooming Forb Richness Suitability Index (SI) for the North Central region. The SI is derived based on expert
opinion of monarch biologists. The suitability of blooming forb richness is expected to be related to adult monarch
density (individuals per acre) and is based on expert opinion.

The Blooming Forb Richness SI is given by Equation 7.
 Equation 7
 2
 ℎ = 1 −
 1 + exp(6 ∗ )

 Where:
 y: number of unique blooming forbs in the assessment area
 max: number of blooming forbs characteristic of fully-functioning habitat.

 V1.0
MONARCH BUTTERFLY HQT SPECIFICATIONS DOCUMENT PAGE 22

Table 3 provides the number of blooming forbs characteristic of fully-functioning habitat for each
region and season of field data collection. If field data are collected during multiple sampling
windows the maximum overall score (including all parameters measured by the HQT) for the site
should be used for the purposed of the Monarch Exchange.
Table 3. Optimal blooming forb richnesses by region and season

 REGION EARLY SEASON MID-SEASON LATE SEASON
 n/a (May 15 – July 1) (July 1 – Sept 15)
 North Central
 6 10
 (Mar 15 – May 15) n/a (Aug 15 – Oct 15)
 South Central
 10 10
 n/a (May 20 – Oct 1) n/a
 Western
 TBD
 Northeast TBD TBD TBD
 Southeast TBD TBD TBD

Preferred Forb Species
One source suggests that monarchs prefer plants with relatively flat surfaces or long multi-
flowering inflorescences where the nectar is easily accessed (USDA - NRCS 2016c), but there is
limited research on this topic. Monarch nectar plant guides developed by the NRCS and Xerces
Society are available to determine nectar source preference by species for regions in the U.S.
(USDA- NRCS 2016c; available at www.nrcs.usda.gov/monarchs and www.xerces.org/monarch-
nectar-plants). Eventually, the HQT may include a preferred list of species, and beginning with
the USDA documents would be reasonable. However, at this time the HQT does not limit
estimates of nectar source availability to forbs currently listed as preferred in those documents.
Combined Nectar Source Suitability Index
The suitability scores for forb cover and richness are weighted and combined to calculate
combined nectar source suitability according to Equation 8.
Equation 8

 = ∗ Frequency SI + ℎ ∗ Richness SI

Nectar SI weights for each region are provided in Table 4. Weights are based on expert opinion
of the relative importance of frequency and richness of blooming preferred forbs to monarch
habitat suitability.

 V1.0
MONARCH BUTTERFLY HQT SPECIFICATIONS DOCUMENT PAGE 23

 Table 4. Weights for the Combined Nectar Suitability Index by Region
 REGION FREQUENCY (WFREQUENCY) RICHNESS (WRICHNESS)
 North Central 60% 40%
 South Central 60% 40%
 Western 60% 40%
 Northeast TBD TBD
 Southeast TBD TBD

 SI TE SI ZE
 Total monarch production is assumed to increase linearly with site size, all other factors being
 equal.
 Monarch butterflies are excellent dispersers and utilize habitats with milkweeds regardless of the
 size of the site. Small butterfly gardens and large natural areas may differ in many respects, but
 both types of sites can contribute to monarch reproduction. Larger sites typically experience less
 disturbance and more diverse plant and animal communities than smaller sites. While small sites
 may be equally valuable on a per area basis to large sites, the creation and support for larger sites
 will be necessary to replace the many milkweed stems that have been lost to conventional
 agriculture and land use changes across North America.
 Based on Monarch Larva Monitoring Project data, smaller sites (i.e., those with fewer milkweed
 plants) tended to have more eggs per plant, yet lower larval survival than larger sites (Stenoien
 et al. 2015, Nail et al. 2015). This trade-off between egg density and survival likely equalizes
 overall production on a per area basis, which is why the value of a site increases linearly based
 on area.
 Site size, measured in acres, is used to calculate functional acres available on a site. Completely
 forested areas or bodies of water do not contribute towards site size.

THREATS
 Herbicides and insecticides are potentially problematic for restoration efforts of milkweeds and
 monarch butterflies. Full suitability cannot be achieved when insecticides are used on a site and
 it may be difficult to quantify the loss of monarchs resultant from insecticide use, thus insecticide
 use is prohibited on habitat enrolled in the Exchange. Herbicide use in and adjacent to monarch
 habitat should be avoided, or closely controlled to achieve full suitability (although herbicides
 can be effectively used during the restoration process or to control weedy species that may
 compete with milkweed and nectar species). The biggest risk of pesticides to milkweeds and
 monarch is expected to be due to transport from adjacent lands during and after pesticide
 application. Spot application of herbicides and the use of Integrated Pest Management plans can
 allow for control of invasive species while limiting impacts to monarchs. An analysis of potential

 V1.0
MONARCH BUTTERFLY HQT SPECIFICATIONS DOCUMENT PAGE 24

sites for establishing new monarch habitat indicated that approximately 80% of rural roadsides
and 40% of non-crop areas in Story County, IA are within 125 feet of fields in conventional
agricultural (Tyler Grant pers. comm.). Excluding these potential habitats from conservation
efforts would very likely preclude achievement of the conservation targets for monarch habitat
necessary to reduce quasi-extinction risk.

RI SK OF PESTI CI DE EXPOSURE
Habitats that are adjacent to conventional agriculture are likely to be impacted by drift, runoff or
dustoff of both herbicides and insecticides, depending on application procedures and
environmental conditions at the time of spraying (Felsot et al. 2010). The presence of windbreaks,
such as hedgerows, at the boundary between crop and non-target areas can decrease aerial
pesticide drift into non-target areas (Felsot et al. 2010, USDA 2014). Hedgerows installed for the
purpose of protecting habitat from pesticides should not contain milkweed or other flowering
plants. A buffer zone of 6 meters appears to be sufficient if spraying is done under appropriate
conditions, but 10% mortality of non-target insects at distances of up to 24 meters have been
recorded when spraying was carried out under windy conditions (Felsot et al. 2010).
We adopt the specifications from the NRCS WHEG (USDA NRCS 2016a), which reduces habitat
suitability by 70% for any areas within 38.1 meters (125 feet) of areas treated with pesticides.
Where a hedgerow is present, the reduction in habitat suitability will be 40%. To qualify,
hedgerows must conform to recommendations established by the NRCS (USDA 2014, Appendix
B). Additional mitigating factors may be considered for future versions of the HQT. Because it can
be difficult to verify pesticide use on neighboring cropland, any areas of conventional (e.g., non-
organic) cropland will be considered as areas where pesticides are applied, unless clearly
demonstrated otherwise. The Pesticide Risk SI is calculated according to Equation 9.
Equation 9

 (0.7 ∗ ℎ + 0.4 ∗ )
 = 1 −

 Where:
 ℎ : Area within 38.1 meters (125 feet) of conventional agriculture, unprotected
 : Area within 38.1 meters (125 feet) of conventional agriculture protected by a
 hedgerow
Need for Additional Information
The positive valuation of monarch habitat at risk of drift, runoff and dustoff of agricultural
chemicals by nearby production agriculture, even when protected by hedgerows or other
mitigating actions, risks the creation of populations sinks for monarchs if the habitat receives
credits through the Exchange. While there have been significant efforts to better understand and
quantify the effects of pesticides on monarch populations, much is still unknown. Given the

 V1.0
You can also read