MRI-guided VT Ablation in Patients with Ischemic Cardiomyopathy - Philipp Halbfaß - Expert Meeting Berlin

Page created by Claude Waters
 
CONTINUE READING
MRI-guided VT Ablation in Patients with Ischemic Cardiomyopathy - Philipp Halbfaß - Expert Meeting Berlin
MRI-guided VT Ablation in Patients with
      Ischemic Cardiomyopathy

             Philipp Halbfaß
           Herz- und Gefäßklinik
               Bad Neustadt
MRI-guided VT Ablation in Patients with Ischemic Cardiomyopathy - Philipp Halbfaß - Expert Meeting Berlin
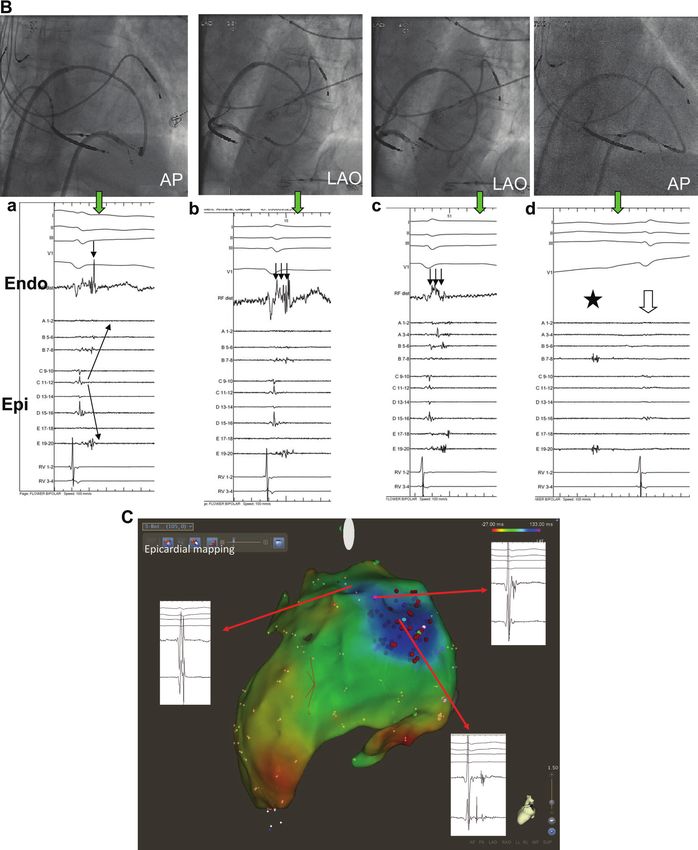
Patient with ICM - VT: PPI 460ms, CL 450ms
                                             Stevenson et al., JACC 1997

                     Prerequisite:
VT monomorphic + inducible + (hemodynamically tolerated)
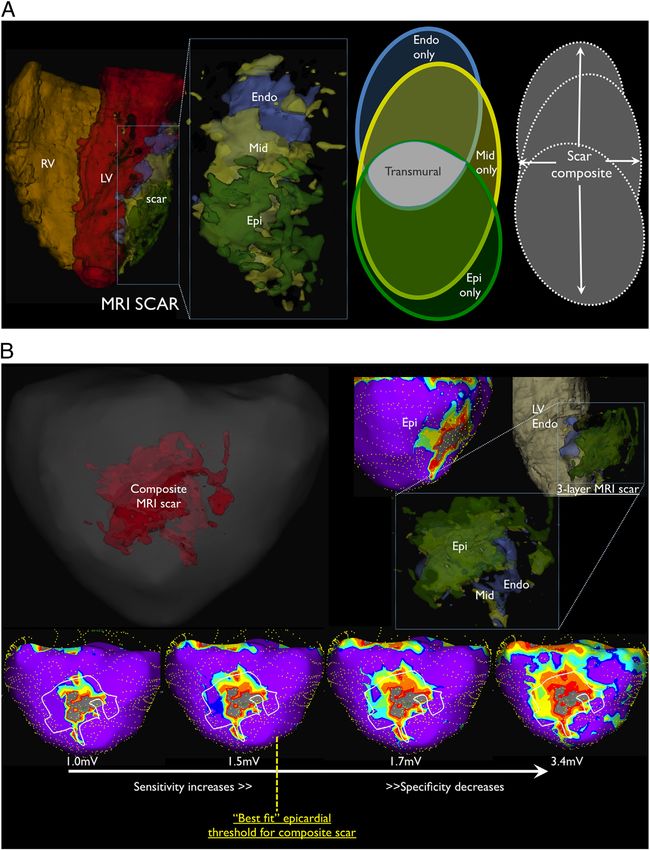
MRI-guided VT Ablation in Patients with Ischemic Cardiomyopathy - Philipp Halbfaß - Expert Meeting Berlin
136           Di Biase et al.
                                                                                                                                                                                                                                                                               Endo-Epicardial Homogenization of the Scar

           Different VT Ablation Approaches
                                                                                                                                                                                                                                                                    The goal of this ablation strategy was covering the entire                                     dures, transthoracic echocardiograp
                                                                                                                                                                                                                                                                 scar with ablation lesions targeting abnormal electrograms.                                       discharge.
                                                                                                                                                                                                                                                                 In the first 10 patients, pacing was performed at high output                                        All patients were followed up w
                                                                                                                                                                                                                                                                 (up to 20 mA with a pulse duration of 10 ms) from within                                          well as implantable device interro
                                                                                                                                                                                                                                                                 the ablated area, but capture was not seen and not tested in                                      every 3 months thereafter to asses
                                                                                                                                                                                                                                                                 later patients. Ablation at the border zone or within the                                            Arrhythmia recurrence was defin
                                                                                                                                                                                                                                                                 dense scar had the same procedural endpoint (i.e., abolition                                      ing device-based treatments (anti-t
                                                                                                                                                                                                                                                                 of all abnormal potentials) (Figs. 2 and 3). At the end of the

                                                                                             Downloaded from http://ahajournals.org by on September 8, 2019
                                                                                                                                                                                                                                                                                                                                                                   or shock). After ablation, the pre
                                                                                                                                                                                                                                                                 ablation, programmed stimulation with and without isopro-                                         were given and discontinued 3
                                                                                                                                                                                                                                                                 terenol was performed in all cases to test the inducibility of
                                                                                                                                                                                                                                                                                                                                                                   procedures, all ICDs were prog
                                                                                                                                                                                                                                                                 any VAs following extensive substrate ablation.
                                                                                                                                                                                                                                                                                                                                                                   slower than the clinical VTs. No di
                                                                                                                                                                                                                                                                 Procedural endpoint. Although with a different ablation
                                                                                                                                                                                                                                                                 technique, in both groups after ablation the acute procedural                                     ming modality in between groups
                                                                                                                                                                                                                                                                 endpoint was the noninducibility of any monomorphic VTs                                           Statistical analysis. Continuous
                                                                                                                                                                                                                                                                 before and after the administration of isoproterenol (up to                                       mean " SD and as numbers and p

• Targeting “EP substrate“: Late potentials,
                                                                                                                                                                                                                                                                 5 !g/min). Induction of nonclinical very fast VT (cycle                                           Student t test, chi-square test, an
                                                                                                                                                                                                                                                                 length !200 ms), or VF, ventricular flutter, or fast poly-                                        used to compare differences acro
                                                                                                                                                                                                                                                                 morphic VT were not considered as a procedural endpoint                                           Cox regression analysis was used f
                                                                                                                                                                                                                                                                 and were not taken into account.                                                                  predictors of VA recurrence while
                                                                                                                                                                                                                                                                 Follow-up. In all patients, screening for pericardial effu-                                       relevant covariates. All potential c
                                                                                                                                                                                                                                                                 sion was routinely done at the end of the procedure by                                            into the model based on significan
                                                                                                                                                                                                                                                                 intracardiac echocardiography and fluoroscopy. In case of                                         or prior knowledge or expected clin
                                                                                                                                                                                                                                                                 patients’ symptoms or low blood pressure after the proce-                                         of their statistical significance. T

       „LAVA“ (local abnormal ventricular activities) 1                                                                                                                                                                                                                                       Figure 6 (Continued).

                                                                                                                                                              LAVAs were observed epicardially in 4 of the 7 patients with                                                                                       0.20 – 0.60 mV) compared with the endocardium (median,
                                                                                                                                                              no endocardial LAVAs, whereas the remaining 3 patients had                                                                                         0.11 mV; IQR, 0.08 – 0.22 mV; P!0.002). At sites where
                                                                                                                                                              no identified LAVA.                                                                                                                                LAVAs were recorded, the median amplitude and duration of
                                                                                                                                                                 Characteristics of the LAVA signals are summarized in                                                                                           the far-field endocardial ventricular electrogram were 0.20
                                                                                                                                                              Table 2. The LAVA amplitude was significantly higher when                                                                                          mV (IQR, 0.10 – 0.50 mV) and 60 milliseconds (IQR, 50 – 83

• Targeting the whole substrate: „substrate homgenization“ 2
                                                                                                                                                              recorded from the epicardium (median, 0.37 mV; IQR,                                                                                                milliseconds), respectively. Normal amplitude ("1.5 mV)

                                                                                                                                                                                                                                       1436       Circ Arrhythm Electrophysiol             December 2015

• Targeting only „functional relevant“ substrate
                                                                                                                                                                                                                                                                   Figure 2        Bipolar Voltage Map of the LV Endocardium in a Patient From Group 2

                                                                                                                                                                                                                                                                   Regions in red represent scar (bipolar voltage !0.5 mV), and purple regions represent normal myocardium (bipolar voltage #1.5 mV). O
                                                                                                                                                                                                                                                                   abnormal myocardial regions (bipolar voltage between 0.5 and 1.5 mV). The scar is located in the inferior left ventricle (LV). This patient
                                                                                                                                                                                                                                                                   storm despite amiodarone 400 twice per day $ mexiletine 150 three times per day. The entire scar has been targeted with extensive a
                                                                                                                                                                                                                                                                   (EGMs) of representative endocardial mapping sites are shown with white arrows. In each EGM recording, electrocardiogram leads I, V1

       – „DEEP“ (decrement evoked potentials) ablation 3
                                                                                                                                                                                                                                                                   mal (MAP 3-MAP 4) and distal (MAP 1-MAP 2) ablation catheter are shown. Note: the number of ablation dots might overestimate the ac
                                                                                                                                                                                                                                                                   tions, because some dots were acquired during the same radiofrequency application.

• Targeting substrate suggested by imaging modalities: MDCT ->

                                                                                                                                                                      Downloaded from http://ahajournals.org by on September 9, 2018
     „wall thinning“, identifying channels                    4                                                                                                                                                                        Figure 2. A, An example of decremental conduction, unidirectional block, and induction of ventricular tachycardia (VT). Bipoles A to K are
                                                                                                                                                                                                                                       located sequentially within the diastolic pathway of the VT circuit. During right ventricular pacing (S1), local abnormal potentials can be
                                                                                                                                                                                                                                       seen on bipoles F, I, and J, and these would be annotated when creating a late potential (LP) map. With the introduction of a premature
                                                                                                                                                                                                                                       stimulus (S2), there is marked delay of the local electrograms across all bipoles from A to J. With S3, there is block (*) of the local poten-
                                                                                                                                                                                                                                       tial on bipole I, and subsequently with S4, there is block (*) at the VT exit site (bipole J). Block at the VT exit site and conduction delay
                                                                                                                                                                                                                                       through the entrance to the diastolic isthmus sets up the environment for the reentrant circuit to begin. Bipoles A to J then span the entire
                                                                                                                                                                                                                                       diastolic limb of the VT circuit. This VT initiation demonstrates the concept of decrement evoked potential mapping; that conduction delay
                                                                                                                                                                                                                                       precedes unidirectional block and the initiation of tachycardia at critical points in the VT circuit. Measurements on S1 and S2 from bipoles
                                                                                                                                                                                                                                       A to F show the degree of delay of the local potential from QRS onset in milliseconds. Substantial delay occurs at bipoles A and B with
                                                                                                                                                                                                                                       the extrastimulus, and minimal additional decrement occurs further down the isthmus from bipoles C to F. B, An enlarged image of bipole
                                                                                                                                                                                                                                       H from A. The split potential following S1 is enlarged to clearly show the polarity of the local component (†). With S4, block to bipole H
                                                                                                                                                                                                                                       occurs through the exit site of the VT isthmus, and this bipole is subsequently activated via the VT entrance site from the opposite direc-
                                                                                                                                                                                                                                       tion. This change in direction of activation leads to an exact polarity change in the local electrogram (‡). C, A corresponding scar map of
                                                                                                                                                                                                                                       the LV with the voltage scale on the right. Apical electrodes are at the center, basal electrodes at the periphery, and spline 0 is oriented
                                                                                                                                                                                                                                       to the anterior interventricular groove. Heterogeneous scar is found at the apex and extends to the inferobasal region. The diastolic path-
                                                                                                                                                                                                                                       way of the VT shown in Figure 2A is drawn (red arrow), and the corresponding electrodes are labeled.

• Targeting a combination of 3D EAM- and MRI- defined substrate 5                                                                                                                                                                      of bipoles). The sensitivity and specificity of the LP and DEEP
                                                                                                                                                                                                                                       maps were calculated individually for each VT and expressed as
                                                                                                                                                                                                                                       the mean±SD. Where multiple VTs occurred in the same patient,
                                                                                                                                                                                                                                                                                                                 these values were averaged to account for intrasubject correlation.
                                                                                                                                                                                                                                                                                                                 Comparison was made using a Wilcoxon signed-rank test. A P value
                                                                                                                                                                                                                                                                                                                 of
MRI-guided VT Ablation in Patients with Ischemic Cardiomyopathy - Philipp Halbfaß - Expert Meeting Berlin
MRI guidance for the optimization of VT ablation                                                                                                1723
               LGE - MRI to identify VT substrate

          Dense scar, border/grey zone and normal myocardial tissue – in MRI and in
  Figure 1 Ex vivo MRI and histology in a porcine chronic infarct heart using Masson’s trichrome staining. Top left panel—slice of ex vivo LGE image
                              histologic
  demonstrating area of hyper-enhanced infarct section
                                               with thin rim of  a porcine
                                                             of normal          chronic
                                                                       myocardium           infarct
                                                                                  at the endocardial    model.
                                                                                                     border. Top right panel—Masson’s trichrome
  stain of histological section demonstrating the area highlighted in the previous panel. Bottom right three panels—Three sections selected in the
  infarct area and control area. Blue represents collagenous scar whilst pink represents normal myocardial tissue in non-infarcted regions. Adapted
          Ability of DE-MRI to identify VT substrate in ICM validated in histologic studies
  with permission from Pashakhanloo et al.26 LGE, late gadolinium enhancement; MRI, magnetic resonance imaging.

                                                                 Pashakanloo et al., J Cardiovasc Magn Reson 2017                               4
MRI-guided VT Ablation in Patients with Ischemic Cardiomyopathy - Philipp Halbfaß - Expert Meeting Berlin
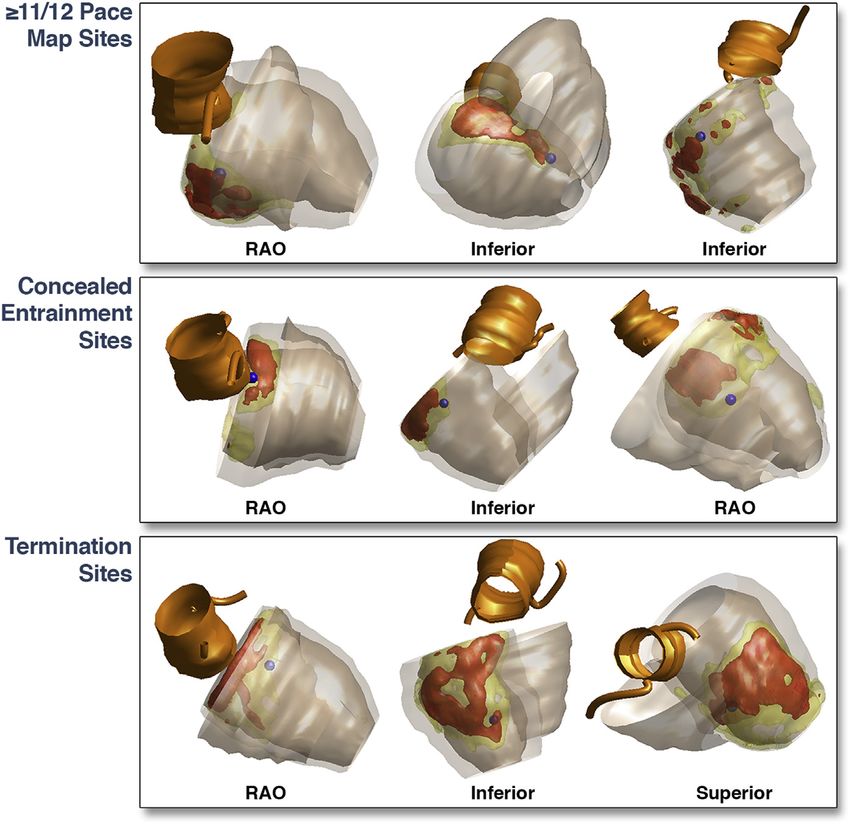
MRI: Imaging Resolution „ex vivo“
         Pashakhanloo et al. Journal of Cardiovascular Magnetic Resonance (2017) 19:9                                                                   Page 8 of 14

N=8 porcine and n=1 human ex vivo hearts / chronic MI; Diffusion Tensor Imaging +
LGE sequences on 3 T scanner à analysis of scar distribution and fiber architecture

          Fig. 4 Visualiation of primary eigenvectors in a short-axis slice of an infarcted porcine heart. A LGE image showing enhanced image intensity in

  cMRI - submillimeter resolution, delineation of fiber orientation and
          the infarcted region. B Map of left ventricle primary eigenvectors (same view as in A) color-coded by the absolute values of the inclination angle.
          The white arc delineates an anterior region of LV that spans from a non-infarcted region (a) to an infarcted region (b) - see Fig. 5. C Eigenvector
          visualization in three regions (red boxes in a). I: Infarcted septal wall, II: transition zone between infarcted and non-infarcted portions of the anterior

                scar microstructure is feasible „ex vivo“
          wall, and III: non-infarcted region in the lateral wall

         wall thickness (r = 0.59, Fig. 6D, E) than scar                                 within the epicardial and midwall portion of the wall
         transmurality.                                                                  (Fig. 7B). Importantly, the average transmural epi-to-
           When the inclination angle of all voxels, fibrotic (n ~                              Pashakanloo
                                                                                         endo profile              et al.,
                                                                                                       of inclination angleJ within
                                                                                                                             Cardiovasc       Magn
                                                                                                                                     the infarcted                      Reson 2017   5

         6.5 × 10⁵), non-fibrotic inside the infarcted segments (n ~                     segments (Fig. 7D) was very similar to that of the control
MRI-guided VT Ablation in Patients with Ischemic Cardiomyopathy - Philipp Halbfaß - Expert Meeting Berlin
also found in scars versus healthy areas.         Because precise scar border delineatio
perator curve (ROC) area measurements,           cally relevant for VT ablation purposes,
     Correlation     of  LV  scar  in  3d-EAM
best predicting the presence of scar were as
                                                  and    LGE-MRI
                                                 on the color-coded MRI map was com
V for unipolar EGM voltage (ROC area:            corresponding infarct area on the CA
            N=10 voltage
or bipolar EGM    pts., 9m, 71+/-10
                          (ROC      yrs,
                                 area:   ischem. bipolar
                                       0.85),    VT, LGE-MRI   + 3D EA
                                                           voltage     mapControlled
                                                                    map.   in SR     iden
    Images below: inferior wall scar (LGE-MRI) underestimated by endocardial 3d-EAM

     Mismatch of infarct size in 3D map compared to MRI in 1/3 of cases
                                                      Codreanu et al. JACC 2008
MRI-guided VT Ablation in Patients with Ischemic Cardiomyopathy - Philipp Halbfaß - Expert Meeting Berlin
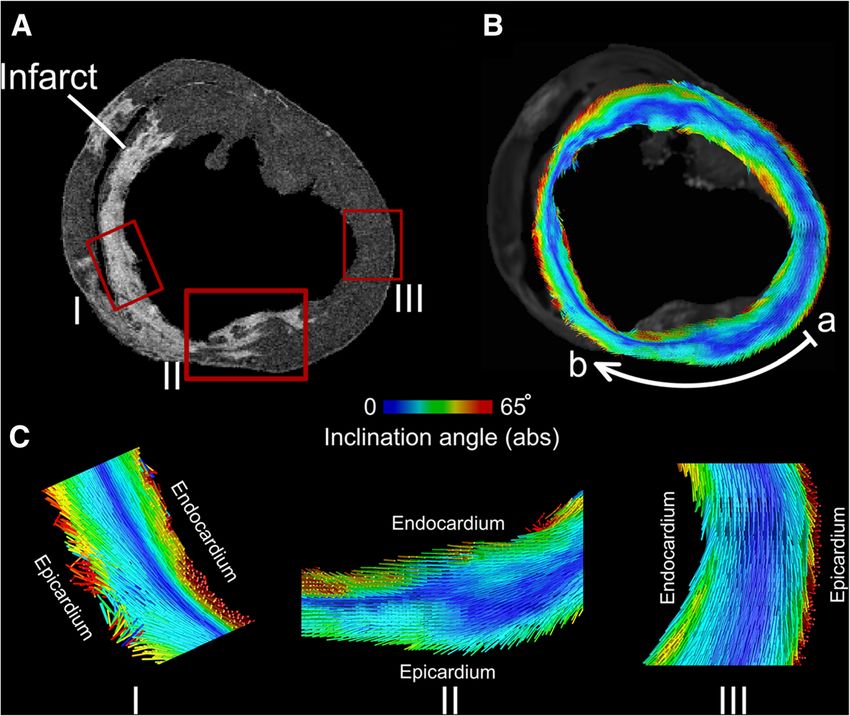
Despite the concordance between MEM and PPM in the identifica-

                                                                                                                                                     p.com/europace/article-abstract/20/3/512/2871236 by ESC Member Access user on 10 September 2018
tricular ejection fraction; NYHA, New York Heart Association.              tion of CCs, the proportion identified by voltage scanning was higher
ation includes anterior, anteroseptal, anterolateral and apical loca-      when using MEM (71.7% vs. 56.3%, respectively; P = 0.024) (see
    HDM(Pentaray): Importance of bipolar voltage thresholds
ardial infarction.
 ion includes inferior, inferoseptal and inferolateral locations of myo-
                                                                           Supplementary material online).
                                                                              With respect to the analysis of EGM-DC, a total of 1104 pairs of
ion.
                                                                           EGM-DC were identified with a distance
MRI-guided VT Ablation in Patients with Ischemic Cardiomyopathy - Philipp Halbfaß - Expert Meeting Berlin
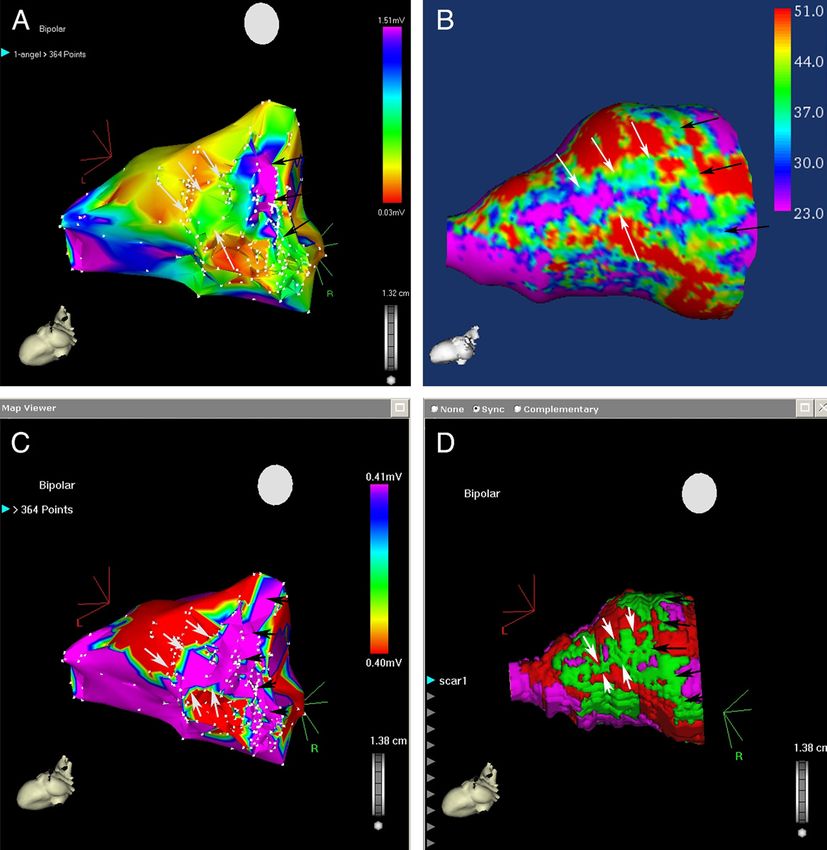
MRI goldstandard to adjust voltage thresholds?
          Comparison of MRI with 3DEAM using a duodecapolar catheter (bipolar, 1mm electrode, different
                    interelectrode spacings and voltage thresholds) in „ex vivo“ porcine hearts

                                                                                                                   1998                                                                                                Heart Rhythm, Vol 13, No 10, October

                   Figure 4    Linear relationship between bipolar voltage thresholds (means between subj
                   magnetic resonance imaging (MRI) scar. Schematic of bipole spacing created from duodeca
                   = endocardial; EPI = epicardial.

               better match for surface scar with a further requisite increase                                             detec
               in the voltage threshold to detect composite scar. With                                                     transm
        Individual voltage thresholds to identify MRI defined myocardial scar
Threshold adjustment to fit magnetic resonance imaging (MRI) with the various surfaces depicted for pig 2 and composite scar. B: Best fit to MRI composite
tlined on the electroanatomic map for pig 1. EPI = epicardial; ENDO = -endocardial; LV = left ventricle; MID = midmyocardial; RV = right ventricle.
               manual threshold fitting, mismatched low-voltage area out-                                           Figure 4
                                                                                                                           57% Linear relationship between bipolar voltage thresholds (means between subjects) and interelectrode spacing using 95% cutpoint and bes

                  à identify  low-voltage„best  fit“ thresholds
                                                           area of 12.3 ± 7.1 cm(mapping-catheter               specific!)
                                                                                                                   magnetic resonance imaging (MRI) scar. Schematic of bipole spacing created from duodecapolar catheter (1-mm electrode, 2-mm interelectrode spacing).
                                                                                                                   = endocardial; EPI = epicardial.
                                                                                                                    2
% thresholds, the endocardial            areas low-voltage                       . When comparing scar area
h 2-mm spacing side      ofcmscar
                 (5.3 ± 3.5             (false defined
                                        2
                               ), 5-mm spacing scar)by endocardial
                                                           exceeded              thewitharea
                                                                      unipolar mapping            within
                                                                                          epicardial bipolar registered    mural
                                                                                                                  better match for surface scar with a further requisite increase                   detect MRI-defined endocardial scar and 62% to
  2
m ), and 8-mm spacing (4.9 ± 3.8 cm ) were all    2
                                                                       low-voltage regions, unipolar
                                                                                                                  in the voltage threshold to detect composite scar. With
                                                                                                             scar manual
                                                                                                                  area exceeded         bipolar
                                                                                                                          threshold fitting,        scar low-voltage
                                                                                                                                            mismatched     on           area out-
                                                                                                                                                                                                   Tung et al, HR 2016
                                                                                                                                                                                                    transmural scar. A threshold o1.5 mV had sensitiv
                                                                                                                                                                                                    57% and 66% for MRI-defined endocardial scar and
MRI-guided VT Ablation in Patients with Ischemic Cardiomyopathy - Philipp Halbfaß - Expert Meeting Berlin
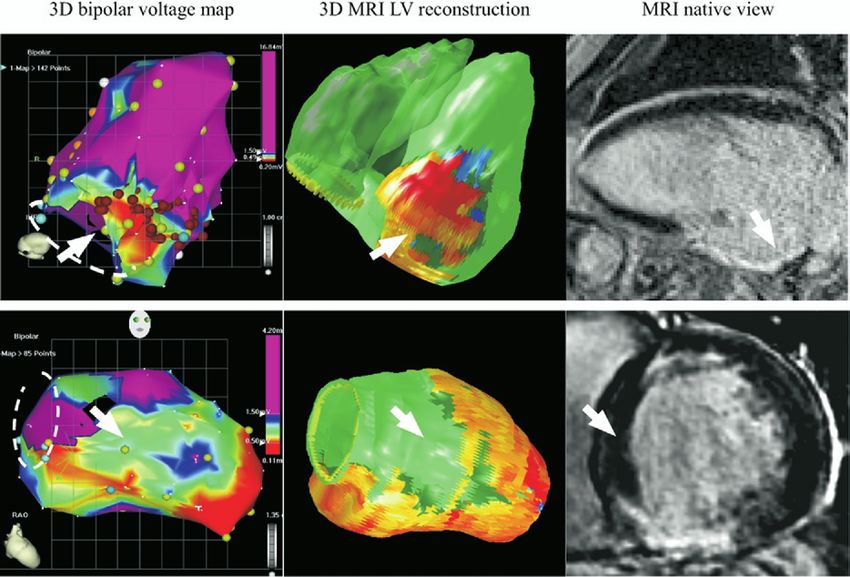
(S-QRS or E-QRS 0% to 30% of VT cycle length).                          were projected onto the CMR-derived 3D scar re-
                   The LV endocardial low bipolar (#1.50 mV) and                         constructions using MATLAB software (example in
                 unipolar (#8.27 mV [11]) voltage areas were measured                    Fig. 2). Scar transmurality was calculated by dividing

       LGE-MRI: Guiding to Critical Isthmus Sites?
                 in all patients, and the epicardial low bipolar (#1.81
                 mV [4]) and unipolar (#7.95 mV [4]) voltage areas
                 were    measured         in    patients      with      NICM       who
                                                                                         scar thickness by wall thickness. The local scar
                                                                                         transmurality and SI at a mapping point were
                                                                                         calculated as the mean value within a 5-mm–radius
                 underwent epicardial mapping. The location of LV                        transmural cylinder around the mapping point. The
                 endocardial critical isthmus sites with respect to the                  local scar transmurality and SI at critical isthmus
N=44 pts., 23 ischemic/21 non-ischemic, 110 VTs inducible, correlation of concealed
                 endocardial low voltage areas was assessed in all                       sites    were     compared     with   the   average   scar

          entrainment and termination sites with LGE-MRI characteristics

   Critical isthmus sites are in close proximity to transition of scar to
                    F I G U R E 2 Examples of Critical Isthmus Sites Projected on CMR-Derived 3D Scar Reconstructions

               border zone and to > 75% scar transmurality
                    RAO ¼ right anterior oblique; other abbreviations as in Figure 1.

                                                                                                                 Piers et al, JACC: Imaging 2014
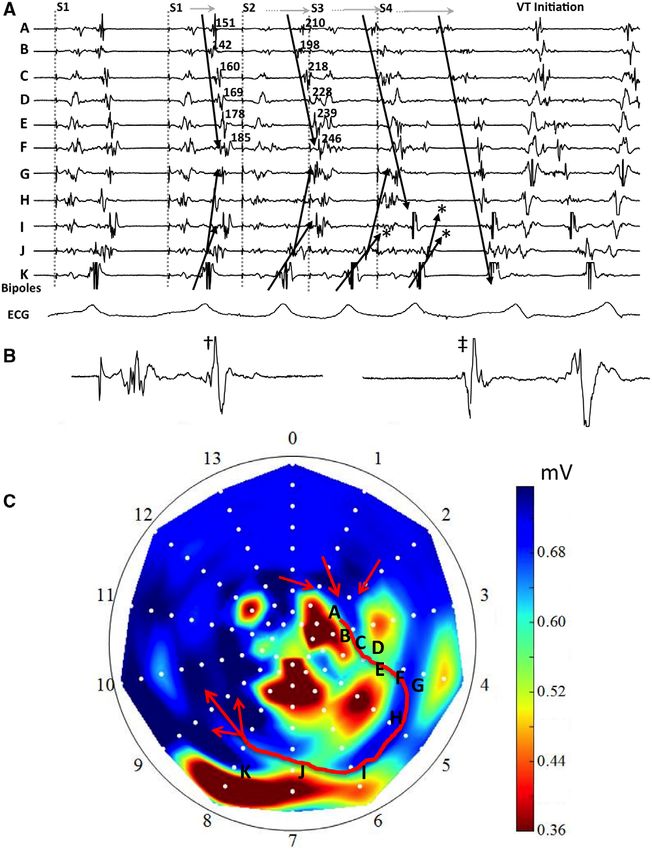
MRI-guided VT Ablation in Patients with Ischemic Cardiomyopathy - Philipp Halbfaß - Expert Meeting Berlin
resonance analysis

                                                                                                                                                                          m https://academic.oup.com/eurheartj/article-abstract/35/20/1316/430113 by Bayerische Staatsbibliothek Muenchen user on 25 December 2019
                Patient sample                                                               Patient-identifying data were removed from ce-CMR images for the
                Patients with a documented VA in a 12-lead surface ECG submitted for         analysis, performed by two-independent cardiologists also blinded to

 Epi-, Endo-, Midmyocardial or transmural Scar?
                ablation and who underwent ce-CMR before the index procedure
                were included in the study. Patients without 12-lead ECG of the clinical
                VA [arrhythmia recorded by the implantable cardioverter defibrillator
                                                                                             any clinical and electrophysiological data. In a case of discordance, a
                                                                                             third observer was required. The ce-CMR images were analysed to
                                                                                             depict the presence of scarred tissue for each left ventricle (LV)
                (ICD) or observed in a 24-h Holter] and an induced VA in the index pro-      segment according to the 17-segment model.13 The right ventricle
                cedure matching the cycle length of the clinical VA were also included.      (RV) septum was divided into three segments: right ventricular outflow
                Patients were considered for VA ablation if they met one of the following    tract (RVOT), right ventricular inflow tract (RVIT), and right ventricular
N=80 pts., ischemic + non-ischemic, successful VT ablation in 77 pts., Hyperenhancement
                criteria: (i) an incessant VT, (ii) repetitive episodes of sustained mono-
                morphic VT, or (iii) symptomatic frequent premature ventricular
                                                                                             apex. Equivalence to the 17-segments model of the RV septum was
                                                                                             as follows: RVOT—Segment 2; RV apex—Segments 8, 9, and 14;

subendocardial: 25%, transmural: 47%, midmyocardial: 10%, epicardial: 14%; epi access ICM: 6%
NICM: 12% of pts.

   endocardial                                                                                                                                                    transmural

   mid-
                                                                                                                                                                  epicardial
   myocardial

                  Figure 1 Pattern distribution of hyper-enhancement in cardiac magnetic resonance images. (A) Endocardial hyper-enhancement. In this case, Seg-

   Especially in NICM, LGE-MRI can localize substrate and plan access
                  ments 13, 14, and 16 (red arrow) presented endocardial hyper-enhancement. (B) Transmural hyper-enhancement. The contrast-enhanced cardiac
                  magnetic resonance of this patient showed a transmural hyper-enhancement in Segment 4 (red arrow) and Segment 5. Segment 3 was also affected by

 needed for ablation (endo- vs- epicardial; LV vs. RV in septal substrate)
                  endocardial hyper-enhancement. (C) Mid-myocardial hyper-enhancement. In this case, mid-myocardial hyper-enhancement affects Segments 2 (red
                  arrow) and 3. Segment 4 is partially affected. (D) Epicardial hyper-enhancement. Red arrows show epicardial hyper-enhancement in Segments 10 and
                  11. In these images, it is also possible to observe mid-myocardial hyper-enhancement in Segments 7 and 8.

                                                                                                                     Andreu et al, Eur Heart J 2014
MRI: Identification of CCs
 N=18 ICM VT Pts. à DE-MRI before VT ablation matched with 18 pts. (no VTs, control);
                   JACC Vol. 57, No. 2, 2011
                   January 11, 2011:184–94

           Identification of conducting channels by signal intensity maps

Signal Intensity Map
Lateral and inferior MI             Figure 6
                                               Corresponding 3D EAM
                                                 Maps From an Inferior and Lateral Infarction and Relation of Voltage and SI Mapping

                                    (Top panels) Endocardial voltage (A) and subendocardial SI (B) maps from an inferior and lateral infarction. (A) The voltage map shows the extension of the scar

                                                                                                                                      SI (MRI) + 3D EA Map
                                    when the voltage   scar6definition
                                                  Figure         Mapswas  set "1.5
                                                                        From        mV. (B)and
                                                                              an Inferior   The SI  map shows
                                                                                                Lateral        a channel
                                                                                                          Infarction  andthat runs parallel
                                                                                                                           Relation         to the mitral
                                                                                                                                       of Voltage   and SIannulus from segments 6 and 10 (black
                                                                                                                                                             Mapping
                                    arrows) and a second channel perpendicular to the mitral annulus between segments 6 to 8 and 5 to 7 (white arrows). (Bottom panels) Relation of voltage and
                                    signal-intensity mapping. The processed SI map was imported and recreated with CARTO Merge for comparison with a voltage map. The channels observed in the
                                                  (Top panels) Endocardial voltage (A) and subendocardial SI (B) maps from an inferior and lateral infarction. (A) The voltage map shows the extension of the scar
                                    voltage map (C) in which the scar voltage definition was set at 0.4 mV are also identified in the SI maps (D). Abbreviations as in Figure 2.
                                                  when the voltage scar definition was set "1.5 mV. (B) The SI map shows a channel that runs parallel to the mitral annulus from segments 6 and 10 (black

- 15 Conducting Channels (MRI) à related to 15 critical VT isthmuses
                                                  arrows) and a second channel perpendicular to the mitral annulus between segments 6 to 8 and 5 to 7 (white arrows). (Bottom panels) Relation of voltage and
                                                  signal-intensity mapping. The processed SI map was imported and recreated with CARTO Merge for comparison with a voltage map. The channels observed in the
                                                  voltage map (C) in which the scar voltage definition was set at 0.4 mV are also identified in the SI maps (D). Abbreviations as in Figure 2.
                                 patients. In 3 patients, no relationship was established      because of noninducibility of documented VT. Additional

- 88% heterogenous tissue channels in VT group / 33% HTC in control
                                 between any VT and a CC. In 1 patient, no CC or SI            RF pulses were delivered over all electrograms with isolated
                                 channels were identified (Patient #6, Table 3).               delayed components.
                                           patients. In 3 patients, no relationship was established       because of noninducibility of documented VT. Additional
                                 RF ablation results. A mean of 20 ! 5 RF lesions were            In the remaining 3 patients in whom no relation between
                                           between any VT and a CC. In 1 patient, no CC or SI             RF pulses were delivered over all electrograms with isolated
                                 applied per patient. Radiofrequency pulses were delivered     CC and VT could be established, ablation was anatomically
                                           channels were identified (Patient #6, Table 3).                delayed components.
                                 over electrograms located in all SMVT-related CC in 15
                                           RF ablation results. A mean of 20 ! 5 RF lesions were
                                 patients. In 10 channels (10 patients), the ablation was
                                                                                                                                              Perez-David et al., JACC 2011
                                                                                               guided toward VT-related electrograms with isolated de-
                                                                                                            In the remaining 3 patients in whom no relation between
                                                                                               layed components (12).
                                                                                                                                                                                                                     11
                                           applied per patient. Radiofrequency pulses were delivered      CC and VT could be established, ablation was anatomically
Limitations of MRI: ICD Artefacts
                               § Large part of LV - antero-
                                 septal + lateral – not visible
                                 due to ICD artefact

                              c/o Halbfass/Deneke/Foldyna/Lehmkuhl
Improving Image Quality in CIED Patients
N=114 MRI studies, 111 pts., 12 pacemakers, 73 ICDs, 29 CRT-D (wideband pulse sequences - LGE)
                                                                                          Page 11
                   „Wideband“ MRI -          „Wideband“ MRI +

        97 studies (87%) à no artefact limiting interpretation of the study
 No relevant advers events apart from descrete lead impedance drop after MRI
                                                           Do et al., Heart Rhythm 2018
LGE-MRI before VT-Ablation

Male pt., 65 yrs, anterior MI, 3 inducible VTs, EF
  45%, no ICD before VT ablation procedure

                                                     c/o Halbfass/Deneke/Foldyna/Lehmkuhl
DE-MRI from endo to epi layers – CC

                              c/o Halbfass/Deneke/Foldyna/Lehmkuhl15
Imaging-guided ablation: preliminary results

                                                            ICM-VT pts. (n=19 CT- /MRI-based dechanneling)
                                                            Age                               65 ± 6 yrs.
                                                            EF                                35 ± 7%
                                                            MI                                Anterior 6 (32%)
                                                                                              Inferior/post. 13 (78%)
                                                            No. of induced VTs                3±1
                                                            No. of identified channels 2.1 ± 1.2
CT:                         MRI:
§ channel detection based   § identify mural distribution   Not inducible after               18/19 (95%)
    on wall thickness         of channels                   dechanneling (acute
                                                            success)
                                                            Additional substrate              17/19 (89%)
                                                            ablation

                                                 in cooperation with the MUSIC-VT group: P. Jais, H. Cochet, Bordeaux, LYRIC   16
cMRI – aided scar dechanneling
N=159 pts., 66±11 y., 95%m, 76% ICM, non-randomized prospecitve, 34% CMR
 poor image quality/wrong sequences (29/83 pts., 35%); cMRI without/before ICD implant

                                          Recurrence 18.5% vs. 43.8%, p=0.002

CE-MRI aided VT ablation results in lower ablation times and higher long-term
          success rates - ablation based on EP signals in all pts.
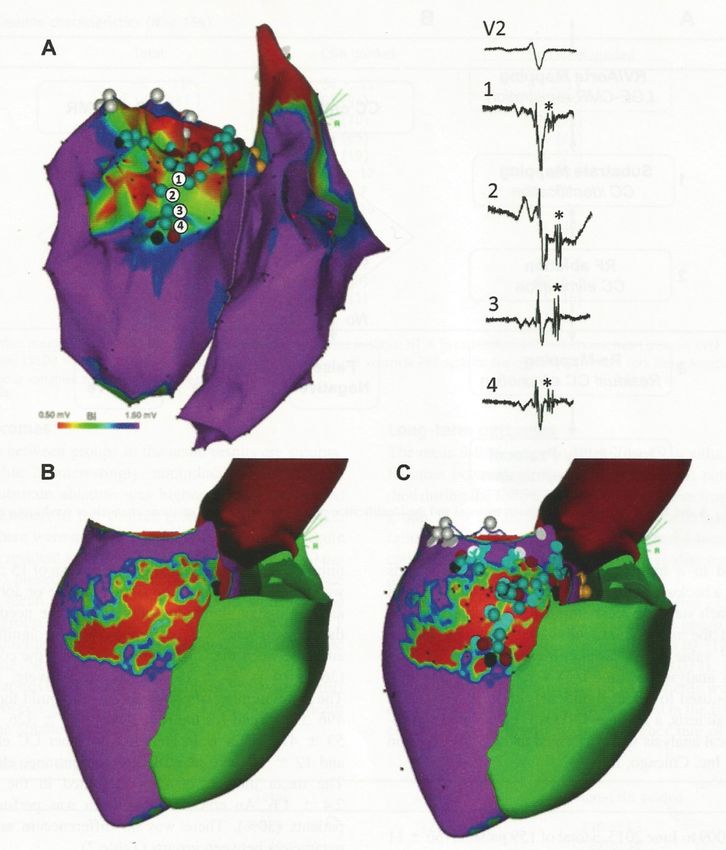
                                                       Andreu et al., Heart Rhythm 2017
VT Ablation using Real-Time MRI Imaging?
                                 N=6 pigs (in vivo), active catheter tracking, epicardial mapping +
                                                                                          Epicardial mapping and ablation under MRI guidance

                             Irrigated ablation (40-60 W), correlation MRI and autopsy post-ablation
                                                                                                                               Real-time MR-thermometry R.K.
        epicardial voltage map                                                                                                        à proton resonance
                                     Acute lesion
         f260
          Using MR catheter                                                                                                     frequency shift technique
                                                                                                                          R.K. Mukherjee et al.

                               Assessment (T1-mapping)
               guiding
         A           A                               1300 ms
                                                                                                                                                 1300 ms

                                                                                                        700 ms

 (A) Representative intracardiac EGM from the epicardium B show-
                                                                                      *
 ) For a low voltage 1.5 mV signal, a noise level of 0.136 mV is pre-
          Real-time MRI: catheter navigation,
                                   *
                                              epicardial voltage and activation mapping;
us rhythm generated using active catheter tracking only in the
1.5 mV. (E) Epicardial voltage map with a threshold set between
                                                                  MR
                                                               1500

      MR thermometry; signal to noise 10:1. à good lesion correlation T1-mapping / autopsy
hole heart sequence from MRI and imported into the iCMR appli-
                                                          ative T1 time (ms)

ells.

                                                                               1000
rograms may be high-pass and low-pass filtered, often requiring                                                                  Mukherjee et al., Europace 2018
ther notch filter to reduce gradient signal-induced noise of
cMRI -> prerequisite for ´Virtual heart
                              arrhythmia ablation´ strategies
CLES                                                                                             NATURE BIOMEDICAL ENGINEERING

            a
                       MRI-Based
                            MRI-based                       Induce                Predict optimal
                                                                                                            Retrospective
                                                                                                       validation of prediction   N., m., ICM, ICD, MRI / ICD artefacts
                         model
                      Model     creation
                            Creation                      arrhythmia               ablation site
                                                                                                        Prospective ablation
                                                                                                            in the clinic

            b

                                                                                                                   CT scan
            Swine 1

                                                                                                           Successful
                                                                                                       experimental ablation
            Swine 3

                                                                                                              Failed
                                                                                                       experimental ablation

                                           Non-injured   Scar     Grey zone   Ablation targets

                                   0 ms                                        225 ms

 VAAT protocol and results from the animal study. a, A flowchart summarizing the protocol (arrowed steps) and the retrospective and
                                              Prakosa et al., Natur Biomed Engin 2018
  studies. b, In silico models and predictions for one case of successful mapping-guided ablation in swine 1 (top), and one case of failed
uided ablation in swine 3 (bottom). Columns, left to right: reconstructed ventricular model with different remodelled regions (with the top panel
e LGE-MRI stack for swine 1); endocardial electrical activation maps of the infarct-related VTs, with white arrowheads showing the direction
                                                                                                                                    In cooperation with Trayanova et al.
 ion of the excitation wave, and the inset in the top panel showing the zoomed-in propagation waves through channels in the scar in swine 1;
 es correspond to in silico predicted ablation targets on the ventricular endocardial surface; CARTO XP ventricular geometry from post-ablation
o-registered with the MRI-based model for comparison of the predicted ablation targets with experimental mapping-based endocardial ablation
where red dots correspond to location of the tip of the catheter during ablation. The panel frame colours correspond to the protocol steps
 a. Non-injured, scar and grey zone tissues and VAAT ablation targets are shown in red, yellow, grey and purple respectively. The colour scale                             19
  tivation times for column 2; black indicates tissue regions that did not activate.
Conclusion

- LGE-MRI reliably identifying ischemic scar and borderzone in VT
  patients (validated in histopathol. studies, not comparable to EAM!)

- Scar size in LGE-MRI and EAM correlates when individualized voltage
  thresholds are used („best-fit“ thresholds)

- Targeting of MRI defined CC/HTC: feasible + effective

- Limitations: cardiac implantable devices –> CI (abandoned leads),
  artefacts limiting imaging quality; long acquisition times

      à prospective randomized studies needed….

- In the future: Real-time MRI-guided? MRI-based virtual heart
  models?
                                                                      20
Improving Image Quality in CIED Patients
 37 yrs, m., ICM, MRI to exclude constrictive pericarditis, S-ICD in place (MRI conditional); 1.5 T,
                       Precaution: specific absorption rate (SAR) < 2 W/kg

  Conventional MRI
     sequences:

   „Wideband“ MRI
     sequences:

 Wideband MRI substantially improving image quality in case of CIED artefacts.
                     Fig. 1. (A) Chest X-ray of a 37-year old man with an MR-conditional S-ICD implanted on the left side. (B) Scout image in a short axis view the patient showing
                     significant signal voids induced by the S-ICD. (C and D) Standard LGE images in short-axis and 2-chamber planes. (E and F) The corresponding wideband LGE images
                     in short-axis and 2-chamber planes. Arrows point to image artifact induced by the S-ICD. MRI images were obtained with standard imaging parameters, including
                     spatial resolution, inversion time, and gradient echo readout.
                                                                                                                  Rhasepar et al., Clin Imaging 2018
                     wideband LGE MRI to suppress image artifacts in a patient with an MR-             fraction of 25%. As shown in Fig. 1A, an MR-conditional S-ICD (Boston
Correlation DE-MRI - HD-map (Orion/Rhythmia)
                             N=5 dogs: chronic anterior infarct
                             HIGH-RESOLUTION MAPPING OF CANINE INFARCT SCAR
                 à LGE MRI (1 and 5 mm from endocardium) and 3d EA map
                            A. Bipolar Voltage Map       B.    LGE-MRI                    C.            2D MRI
                                                              (1 mm Depth)
                                                                                                        Ant Wall

                                                                                           Septum
                                                                                                            LV
                                                                                                                      PM    Lat Wall

                                                                                                           Post Wall

                                                                                  PM
                                                                                 Groove                  Ant Wall

                                                                                               Septum
                                                 20 mV                                                      LV
                                         2 mV                                   265                                         Lat Wall
                                                                                                                       PM
                                                                          177
                                  Bipolar 1 mV
                                                               Signal
                                  Voltage
                                                              Intensity                                   Post Wall
                                             0.01 mV                      45
                                                                                 0

                  § bipolar voltage ≤ 2mV correlated with scar on DE-MRI
 Figure 4. Comparison of the endocardial bipolar voltage map to the late gadolinium enhancement cardiac MRI
 (LGE MRI) in dog# 5. (A) Left ventricular endocardial bipolar voltage map showing an anterolateral scar (8,930
                  § bipolar voltage ≤ 1mV correlated with transmural scar
 electrograms, map resolution 2.7 mm). Red represents bipolar voltages !1 mV and purple represents voltages "2 mV.
 (B) 3D reconstructed image (signal intensity map) from the LGE MRI at 1 mm from the blood pool surface (endocardial
                      unipolar
 LGE) showing the§large            voltage
                         anterolateral scar (red≤area).
                                                  15mV      ≈
                                                        Color  transmural
                                                              corresponds      scar
                                                                          to signal intensity, with low intensity in purple
 and high intensity in red (scar). Note the close correlation between the endocardial low-voltage area (!1 mV or red
 area) in panel (A) and the scar (red area) on the LGE MRI signal intensity map at 1-mm    Thajudeen
                                                                                                depth inetpanel
                                                                                                           al., PACE  2015
                                                                                                                 (B). (C) 2D
 slices from the LGE MRI corresponding to the locations of the yellow and blue lines in panel (B). The upper (yellow)
Virtually Induced VTs

      VT Exit 4

                                  VT Exit 3
                                    VT Exit 2
      VT Exit 5
                  Pacing site
                                VT Exit 1

                                                •   5 VT exits observed
                                                •   3 VT exits are part of 3
                                                    sustaining VT circuits
                                                    (VT exit 1, 2, 3)
                                                •   2 VT exits are part of
                                                    non-sustained VTs (VT
                                                    exit 4, 5)
www.Clinicaltrials.gov

                     24
MRI: Characterizing Arrhythmogenic Substrate
urgery: recent insights into valvular regurgitation / YIA Session Clinical Science           413
       N=174 pts., 64+/10 y., 85%m., EF 31%, LGE-MRI before ICD implantation, FU: VTs
 l chord length and

                                                                                                    Pt. with VTs during FU:

                                                                                                    Downloaded from https://academic.oup.com/eurheartj/article-abstract/38/supp
moderate and                                                                                        Higher SI inhomogeneity
arge-scale

 llema 1 , R.T. Hahn 2 ,
, J.J. Bax 1 . 1 Leiden
en, Netherlands;
es of America                                                                                                                                                                       Signal intensities in
of progression from
 This study aims to                                                                                                                                                                 scar (grey)
d serial echocardio-
& echocardiographic
as none (n=363) or
ogression time (fast
t associates of fast
                                                                                                    Pt. without VTs during FU:
 .3y; p
SI of the voxels over the LV reconstruction and sometimes
                                                                                    showing CC with a length close to the spatial resolution of the
                                                                                    CMR sequence (see Figure 4). In addition, a previous study described
        MRI: Identification of CCs
                            Slice C
                                                                                    the capability of a 2D sequence similar to that used in this study and
                                                                                    with the same spatial resolution to identify CC related to VT isth-
                                                                                    muses.22 In that study, 100% of the CCs identified in the EAM were
N=23 pts. ICM / 7 NICM; 24 pts.         LV with VTs/6pts.
                                                        RV       944with scar-related
                                                                                    observed PVCs,         prior to
                                                                                                in the LGE-CMR           ablation
                                                                                                                     images.    The reason     LGE-MRIfor the mismatch    –
                                                                                    between that study and our results was mainly due to differences in
SSFP (single shot inversion recovery steady state free precession)                                or GRE ( inversion
                                                                                    methodology. All CCs identified in         the EAM
                                                                                                                           2D-SSFP
                                                                                                                                      recovery
                                                                                                                                      provided  bythePérez-David
                                                                                                                                                        lowest sensitivityet  in al.
                                                                                                                                                                                 iden
gradient echo)                                                              Slice A were voltage CCs, whereas in our
                                                                                                                           centage    of false   positives
                                                                                                                              study both voltage and LP CCs
                                                                                                                           sequences.
                                                                                                                                                             (!20%)       was  very

                                                                                    were considered
                                                                                                Ao      for the comparative   Theanalysis.
                                                                                                                                   results from this study support that the hi
                                                                                        Although most of the CCs observed in isthe
                                                                                                                           detection          EAMat can
                                                                                                                                         obtained              beofidentified
                                                                                                                                                         the cost      longer acqui
                                               90%                                  using
                                                                                                                           times,  especially  with  the  3D-GRE      sequence.    Th
                                                                                       LV the 3D-GRERV    sequence, nearlycould
                                                                                                                             20%provide
                                                                                                                                     of CCs       still not visible in the
                                                                                                                                            an alternative because of its capa
                                         Mitral annulus                             3D LV reconstructions. Higher LGE-CMR  60% of CC with  spatial
                                                                                                                                                 lowerresolution
                                                                                                                                                          acquisition and   could
                                                                                                                                                                              proce
                                                                                    improve the identification capacity.cases in which the acquisition time of 3D-GR
                                                                                                                           could be problematic (e.g. claustrophobia, brea
                                                                                        3 T scans provide a higher signal level,  reducing
                                                                                                                           ties), the 2D-SSFPtime         scans
                                                                                                                                                   sequence         and/or
                                                                                                                                                                could          im-
                                                                                                                                                                        be a useful
                                                                            Slice B
                                                                                    proving the quality of the images obtained           byofmeans
                                                                                                                           the sensitivity                 of reducing
                                                                                                                                                this sequence     is modest. the
                       Slice A                                                                                                In some cases, the length/width of the CC id
                                                                                    voxel size. This theoretically results in an increased number of CCs
                                                                                                                           the spatial resolution of the sequence because th
                       Slice B                                                      identified in the CMR images. However,           as used
                                                                                                                                          these
                                                                                                                           tions were           for CMR        studies
                                                                                                                                                     observation      of CC, were
                                                                                                                                                                               rathe
                       Slice C                                                      not also done in a 1.5 T scan, we do not have data to support this state-
                                                                                      LV           RV                      images.  The   trilinear  interpolation      applied  to t
                                                                                                                           made this possible, smoothing the transition b
                                                                                    ment. Nevertheless, the sequencesSIdescribed              can be performed in a
                                                                                                                               of the voxels over the LV reconstruct
                                                                                    1.5 T scan, although the results of CC      depiction
                                                                                                                           showing    CC withmight a lengthbeclose
                                                                                                                                                                 different.
                                                                                                                                                                       to the spat

                                                                            Slice C     Point density in the EAM is critical to obtain detailed informationa prev
                                                                                                                           CMR    sequence    (see  Figure  4). In addition,     of
                                                                                                                           the capability of a 2D sequence similar to that u
                                                                                    the tissue. Sometimes certain areaswith  of the    LV are
                                                                                                                                 the same          poorly
                                                                                                                                             spatial            mapped
                                                                                                                                                       resolution              and
                                                                                                                                                                     to identify   CC
                                                                                    this may result in losing importantmuses.
                                                                                                                            information
                                                                                                                                   22
                                                                                                                                                  about
                                                                                                                                      In that study,    100%the     presence/
                                                                                                                                                               of the   CCs identifi
                                                                                                   RV
                                                                                    absence
                                                                                      LV       of CC. In fact, this may beobserved
                                                                                                                              criticalin for
                                                                                                                                           the LGE-CMR images. The reaso
                                                                                                                                                 the ablation success.
                                                                                                                           between that study and our results was mainly
                                                                                    In this context, the CMR could not          only correlate
                                                                                                                           methodology.                    with the
                                                                                                                                             All CCs identified       in theEAM,
                                                                                                                                                                              EAM b
                                                                                                                           were   voltage   CCs,    whereas
                                                                                    but also to show additional tissue details to the EAM. This is why        in   our   study  both
                                                                                                                                                                                   a
                                                                                                                           were considered for the comparative analysis.
                                                                                    perfect match should probably not be           pursued
                                                                                                                              Although    most of asthetheCCsendpoint,
                                                                                                                                                                observed in butthe E
             Figure 4 Identification of CCs in the original LGE-CMR images.                 90%
                                                                                    an acceptable similarity.
  3D scar Three
          reconstruction                    using images from GRE sequence improves
                                                                                                                           using the 3D-GRE sequence, nearly 20% of CCs
                 consecutive slices are shown in this image. The 3D LV re-                                                                3D LV reconstructions. Higher LGE-CMR spa
                                                                                                         Mitral annulus
          construction shown corresponds to the 90% layer of case A,                                                                      improve the identification capacity.
                                                                              Limitations
                       delineation                  of    CC     prior
          Figure 2. The area marked by a white dotted circle in the
          LGE-CMR image corresponds to the white dotted circle region      to VT   ablation.Slice A
                                                                                                                                             3 T scans provide a higher signal level, reducing
                                                                                                                                          proving the quality of the images obtained by m
                                                                              Our study has several limitations. In 3.2% of the cases, the 3D-GRE
                                                                                                                                          voxel size. This theoretically results in an incre
                     in the 3D LV reconstruction, related to CC number 5 identifiedSlice B            could not be completed due to respiratory
                                                                                                                                          identified in themotion
                                                                                                                                                            CMR images.or However,
                                                                                                                                                                            excessively as thes
                     in the electroanatomic map (Figure 2). The area marked by aSlice C                                   Andreu et al Europace 2015                               26
                                                                                                                                          not also done in a 1.5 T scan, we do not have data
                                                                                                      long acquisition time. Factors related   to patient cooperation and ar-
                                                                                                                                          ment. Nevertheless, the sequences described c
Virtual Heart Approach: Bad Neustadt Case

            N., m., ICM, ICD, MRI with ICD artefacts

                                                       27
Virtual Heart Approach: Bad Neustadt Case

                  Reconstructed Model

                                            Non-Infarcted
                                                Scar
                                             Gray Zone
VT Circuit 1

VT Circuit 1
VT Circuit 1
Ablation Target
VT Circuit 2

Pacing site   VT Circuit 2
VT Circuit 2
Ablation Target
Predicted and actual ablation targets
Limitations of MRI: ICD Artefacts

       Wideband +                 Wideband -

                       Arrhythmia & Electrophysiology Review 2017;6(3):118–24
Strategies to Improve MR Image Quality                                                                                            Rutz et al. Journal of Cardiovascular Magnetic                                                        Page 2 of 3
                                                                                                                                   Resonance 2015, 17(Suppl 1):Q121
                                                                                                                                   http://www.jcmr-online.com/content/17/S1/Q121

• Self-navigated free-breathing isotropic 3D whole
                                                   FIG. 5. Example of the contrast-scout sequence in the LV short-axis plane, and resulting DB-LGE image in a patient (61-year-old male)
                                                   with a large primarily LV scar (arrow) secondary to infarction of the mid–left anterior descending coronary artery. A total of 21 low-
                                                   resolution, single-slice images are acquired to finely sample a range of Dt1 values after setting Dt2 and Dt3 constant. The image that

  heart inversion revovery
                     Basha et al. MR for scar delineation
                                                   best nulls both the blood and normal myocardium is visually identified, and the Dt1 value used to create that image is applied to create
                                                   the DB-LGE image (right). With one quick scouting sequence, the optimal sequence timing is identified.                  Page 14

    Rutz et al., J Card MagnBasha
                             Reson         2015
                                  et al.scout       (Poster)
                                              sequence fixes Dt /Dt         2   3 at 35/150 ms and samples             Discrepancies in identification of presence/absence Page                                                        of          14
                                                   Dt1 between 15 and 115 ms with 5-ms increments, yield-              scar arose because isolated papillary muscle hyperen-
                     Author Manuscript

                                                   ing 21 images with different tissue contrast. To select the         hancement was missed in two patients on the indepen-
                                                   correct timing, the technologist visually identifies the            dent read. Agreement on the presence/absence of scar
                               Author Manuscript

                                                   image with suppressed blood pool and normal myocardi-               was reached on the consensus reading, and scoring was
                                                   um, and calculates the associated timing parameter (ie,             performed accordingly. Despite the expected loss of SNR

• 3D-LGE + Low-dimensional Self-learning and       Dt1) value (Fig. 5). We note that because the T1/T2 values
                                                   of vials in phantom were static, the phantom experiment
                                                                                                                       as a result of T2 Prep use in the DB-LGE sequence, the
                                                                                                                       overall image quality scores were similar between the

  Thresholding (LOST) - > improving scar resolution
                                                   did not replicate physiological gadolinium washout and              two sequences. The qualitative scar–blood contrast
                                                   required slightly different sequence parameters than the            scores (Table 1) from both readers were significantly
                                                   in vivo studies because of differences in T1 and T2.                greater in DB-LGE (P < 0.05). In the quantitative analysis
    Basha et al., J Magn Reson Imaging 2017        In Vivo Imaging
                                                                                                                       of the patients with LV scar and LGE scans available for
                                                                                                                       comparison (n ¼ 17), the scar–blood ratio was signifi-
                                                   The operator identified the suitable timing on the cantly
                                                                                                        Figure  1 Examples            higher
                                                                                                                           for detection            inscarDB-LGE
                                                                                                                                         of myocardial                        for1A) both
                                                                                                                                                            in the septal (figure    and inferiorinfarcted
                                                                                                                                                                                                  wall (figure 1B) by swine         and
                                                                                                                                                                                                                      2D (left) and 3D (right) late
                                                                                                        gadolinium enhancement in 2 patients.
                                                   contrast-scout scan in all cases. In the swine models, the
                                                   myocardium is nulled by both sequences (Fig. 6). A high

• Dark Blood-Late Gadolinium Late Enhancement      dose of contrast agent (0.2 mmol/kg of Gd-BOPTA)
                                                   resulted in high blood signal and reduced contrast

  Sequence à improvement of Scar-Blood Contrast
                                                   between the blood pool and the scar in the swine stud-
                                                   ies. Although the blood pool is not completely nulled in
                     Author Manuscript

                                                   the DB-LGE images, the scar is brighter than the blood
    Basha et al., Magnetic Resonance in Madicine 2018
                                                   pool, which more readily allows for robust scar–blood
                                                   delineation. In patients who received 0.1 mmol/kg of
                               Author Manuscript

                                                   Gd-BOPTA, areas of hyperenhancement reflect the poor
                                                   scar–blood contrast often seen in LGE/PSIR images. In
                                                   comparison, the blood pool and normal myocardium are
                                                   completely nulled to improve scar–blood contrast in DB-
                                                   LGE images (Figs. 7a–7d, Supporting Videos S1 and Figure
                                                                                                         S2).2 Correlation of volume of scar determined by 2D and 3D late gadolinium enhancement
                                                      Representative line intensity profiles (Fig. 8) demon-
                                                   strate the abrupt change in signal intensity at the border
                                                   between scar and blood in DB-LGE images as compared
                                                   with LGE. In the qualitative assessment (Table 1), reader
                                                   1 identified all scans to be diagnostic, whereas reader 2
                                                   identified 5 of 42 of LGE and 2 of 42 DB-LGE to be non-
                                                   diagnostic. Those with nondiagnostic images had motion
                                                   artifacts or incomplete nulling of myocardium. Hyperen-
                                                                                                                                                    FIG. 6. Comparison of DB-LGE (bottom row) and LGE (top row)
VT Ablation using Real-Time MRI Imaging?
       On-Site MRI Imaging Guidance (transcatheter ethanol-injection)

                                                   Rogers et al., CircAE 2016
Preprocedural cMRI – Outcome VT Ablation

                        N=96 pts., retrospective, n=41 pts. with / n=55 pts. without LGE-MRI;
                               Rate of epicardial access comparable in both groups
 tis et al        Outcomes with Preablation MRI inHeart
                                                   DCM     VT Vol 14, No 10, October 2017
                                                        Rhythm,                                                                                                                              1491

e 2 Association of patient and procedural variables with
plete procedural success in multivariate logistic regression
ysis
 ble                                   OR (95% CI)                              P value
                                       1.01 (0.96–1.06)                          .70
 gender                                0.25 (0.05–1.20)                          .08
 VT ablation*                          0.64 (0.34–1.22)                          .18
blation LGE-MRI                        7.86 (2.50–24.74)                        ,.001
                                       1.04 (0.98–1.10)                          .22
 orm/incessant VT                      1.01 (0.31–3.31)                          .98
 nduced VTs                            0.81 (0.70–0.94)                          .005
dds ratio (OR) .1 indicates that the variable is positively associated
complete procedural success.
I 5 confidence interval; LGE-MRI 5 late gadolinium enhancement
         Figure 1 Distribution of procedural success status according to the use of preablation magnetic resonance imaging.
 etic resonance imaging; LVEF 5 left ventricular ejection fraction;
  ventricular tachycardia.                                                                                                  Figure 2 Kaplan–Meier curve of unadjusted survival free of ventricular
nother     cMRI guided VT ablation à significantly lower rate of VT recurrence/HTx/death
 luding 1 study    of nondiagnostic quality because of
            institution.
  a); 1 patient did not undergo MRI because of severe
                                                                     Procedural characteristics
                                                                     The imaging group had a higher number of documented
                                                                                                                            tachycardia (VT) recurrence, heart transplantation (HTx), or death in the
                                                                                                                            group with
                                                                                                                                    clin-and the group without preablation magnetic resonance imaging.

                                    No but 6impact
hobia. Among 45 patients who underwent ablation
er April 2012, 40 patients had an MRI,       of         on long-term                   outcome;
                                                                                          (median 6 vs 6.5 in retrospective study!
                                                ical VTs (P 5 .005), but there was no difference in the num-
                                                ber of induced VTs between the 2 groups
ble    2). Thetestassociation
  a nondiagnostic      because of severeremained
                                          CIED arti-   significant
                                                        the imaging and   in nologistic
                                                                                    imaging groups, respectively)
  patients did not have an MRI because of advanced
ession       that was      additionally
                                                        (Supplementary Table 2). None of the induced
                                                adjustedclearly
                                                           for triggered
                                                                the year       of abla-                group     (HR
                                                                                                           VTs had   a 0.72, 95% CI 0.34–1.52, P 5 .39) and in the an-
 ease precluding    gadolinium   use, body habitus
 ible with the MRI scanner, or presence of a left ven-
                                                                          or automatic  mechanism; rather, all were
                                                        most likely due to reentry. Epicardial ablationalyses     limited to  the    Siontisof
                                                                                                                                  subgroup   et patients
                                                                                                                                                al, HR 2017
                                                                                                                                                         with CIED (HR
 (OR 7.40, 95% CI 1.95–28.12, P 5 .003). Results were                                                   using a percu-
8
         LAVA Ablation:
       Yamashita et al
                             Long-Term
                 New Technologies and Approaches for VT Ablation

                                                                              In this study, the integration of anatomy and scar from
                                                                     N=142
                                                                        imaging procedures      in 125
                                                                                   was associated     withpts.,
                                                                                                           a 2-fold reduction in VT recur-
                                                                        rence. The superior outcome in patients with image inte-
                                                                     64+/-11
                                                                        grationyrs.,
                                                                                   might7 f.;
                                                                                           be explained by the ability of imaging to
                                                                        comprehensively describe the structural substrate of VT,
                                                                     „real-time      image aintegration“
                                                                        thereby enabling        more focused in    38%: on critical areas,
                                                                                                                mapping
                                                                        at the same time ensuring that no abnormal myocardium is
                                                                     MRIleftinunexplored.
                                                                                39% / MDCT        in 93% we identified a higher number
                                                                                            Interestingly,
                                                                        of LAVA sites in patients with real-time image integration
                                                                        despite a similar number of mapping points. This obser-
                                                                        vation confirms
                                                                     Predictors              that mapping
                                                                                    of freedom        from VT is more   efficiently focused
                                                                                                                 recurrence:
                                                                        toward critical areas when guided by imaging data. Of note,
                                                                         LAVA elimination
                                                                     • however,      the identification of more LAVA RR 0.52
                                                                                                                           did not translate
                                                                        into higher rates of complete LAVA elimination. Therefore,
                                                                         Multipolar
                                                                     • the     impact of catheter      use
                                                                                           image integration         RR 0.75seems to be
                                                                                                                 on outcome
                                                                        mediated by a more comprehensive treatment of VT sub-
                                                                         Real-time
                                                                     • strate;          image
                                                                                  however,    the integration        RR 0.49
                                                                                                   issue of unreachable     targets remains
                                                                        (midwall circuits and coronary interposition).24 In this study,
                                                                        VT-free survival rates in the population without image inte-
                                                                        gration were comparable to those reported in the VTACH
                                                                        study (Ventricular Tachycardia Ablation in Coronary Heart
                                                                        Disease),13 whereas the outcome in patients treated with
                                                                        image integration was more favorable. However, this lat-
Figure 4. Ventricular tachycardia (VT)–free survival in procedures
    Image integration strongest predictor of long-term VT ablation success !
with and without real-time image integration.                           ter outcome was similar to a previous study by Deneke et
                                                                        al14 that did not use image integration (77% VT-free sur-
efficacy of post-MI VT ablation. Using constant procedural              vival rate during a Yamashita
                                                                                                 median follow-up     of 16
                                                                                                              et al., Circ AEmonths).
                                                                                                                               2016 This
                                                                        is likely because of differences in patient characteristics
EP Properties of CC not only defined by Substrate

High Density Map of the same CC used by two VTs (1 inferior / 1 superior axis)
      Author Manuscript
      Author Manuscript   Anter et al.                                                                                                Page 20

                                         Figure 5. Conduction velocities in the isthmus are influenced by the vector of propagation
      Author Manuscript

Conduction velocity slowest at the entrance à conduction velocity NOT
                                         Example of two ventricular tachycardias (VTs) with opposite axis sharing one isthmus. VT-1
                                         had a right bundle branch block pattern with an inferior axis while VT-2 had a right bundle
                                         branch block pattern with a superior axis. The tachycardia cycle length was similar at 460
        substrate-related but functional (slowest at entrance)
                                         and 463ms, respectively (left and right lower panels). The isochronal map of VT-1 shows
                                         maximal isochronal density, suggestive of slowest conduction velocity, at the proximal
                                         curvature (entrance). Once the wavefront reaches the common channel “isthmus”,
                                         conduction velocity is increased as marked by lower isochronal density (solid arrow). At the
                                         distal curvature (exit), conduction velocity is slowed again as suggested by increased
                                                                                                                                       Anter et al., Circulation 2016   39
Correlation MRI – EAM bipolar voltage
     N = 15 pts w/ post-infcartion VT
   DE-MRI              EAM – bipolar
                         voltage
   normal                 ≥ 1.8mV
   myocardium
   transmural scar     0.4 to 1.3mV
   ≥ 25%                  < 1.5mV
   transmural scar
   subendocardial/   1.1 to 2.5mV +
   midmyocardial    unipolar reduced
   scar
  § 33% mismatch in size
  § DE-MRI identifies non-transmural
    scars not detected by EAVM according
    to the currently used voltage criteria
                                             Wijnmalen et al., Eur Heart J 2011
Conclusion
- xxxx

                41
termination. After a total radiofrequency time of 32 minutes gration                                                                                                    VT-free survival rates in the population without image inte-
                                                                                                                                                          were
                                                                                                                                                    istics.   Amongcomparable
                                                                                                                                                                          procedural   to characteristics,
                                                                                                                                                                                           those reported low-voltagein the VTACH    zone and
                                                                     (interquartile range, 20–50), complete LAVA elimination was studydense                                                                                                  gration were comparable to those reported in the VTACH
                                                                                                                                                       (Ventricular
                                                                                                                                                              scar zoneTachycardia
                                                                                                                                                                             tended to beAblation associated   in with
                                                                                                                                                                                                                   CoronaryfailureHeart
                                                                                                                                                                                                                                    to achieve
                                                                                                                                                                                                                                             study (Ventricular Tachycardia Ablation in Coronary Heart
                                                                     achieved in 79 cases (60% of patients with LAVA). At the end Disease),                 13
                                                                                                                                                                 whereas the
                                                                                                                                                    LAVA elimination,                outcome
                                                                                                                                                                                  although           in patientsdid
                                                                                                                                                                                                the association          treated    withsignif-
                                                                                                                                                                                                                             not reach       Disease),13 whereas the outcome in patients treated with

                                                                                  LAVA Ablation: Long-Term
                                                                     of the procedure, VT inducibility was not tested in 30 out of image                 integration
                                                                                                                                                    icance     after       was more
                                                                                                                                                                     Bonferroni             favorable.
                                                                                                                                                                                       correction       to    However,
                                                                                                                                                                                                           account       for    this lat-testing
                                                                                                                                                                                                                              multiple
                                                                 Figure 4. Ventricular tachycardia (VT)–free survival in procedures                                                                                                          image integration was more favorable. However, this lat-
                                                                 with142
                                                                       andpatients   (21%) because
                                                                            without real-time                                                ter 4.
                                                                                                       of the induction of poorly toler-Figure
                                                                                              image integration.                                  outcome
                                                                                                                                                      Ventricular
                                                                                                                                                    (P=0.006      was   similar
                                                                                                                                                                         P=0.005,to(VT)–free
                                                                                                                                                                     tachycardia
                                                                                                                                                                   and                   a previous         study
                                                                                                                                                                                                     survival
                                                                                                                                                                                        respectively).                 by Deneke
                                                                                                                                                                                                                 in procedures
                                                                                                                                                                                                              Baseline                 et was
                                                                                                                                                                                                                             inducibility    ter outcome was similar to a previous study by Deneke et
                                                                     ated VTs requiring cardioversion >2 times during the proce-withaland      14 without real-time image integration.
                                                                                                                                                    that did not
                                                                                                                                                    associated      withusea lower
                                                                                                                                                                                imagerate integration         (77% VT-free
                                                                                                                                                                                                of noninducibility                   sur-of the
                                                                                                                                                                                                                             at the end      al14 that did not use image integration (77% VT-free sur-
                                                                     dure. Of
                                                                 efficacy       the remaining
                                                                            of post-MI          112 cases
                                                                                         VT ablation.      who constant
                                                                                                         Using   underwent    programmed vivalprocedure
                                                                                                                          procedural                  rate during        a   median
                                                                                                                                                                    (P=0.002).           follow-up
                                                                                                                                                                                      TotalUsing           of
                                                                                                                                                                                               radiofrequency   16    months).      This
                                                                                                                                                                                                                       and procedure time    vival rate during a median follow-up of 16 months). This
                                                                                                                                         efficacy of post-MI           VTofablation.                   constant      procedural
                                                                 endstimulation,
                                                                       points in athe   end point
                                                                                     cohort        of VT VT
                                                                                             of post-MI    noninducibility
                                                                                                               patients, wewas    achieved is likely
                                                                                                                               demon-               were     because
                                                                                                                                                             also  associated    differences
                                                                                                                                                                                     with   lower   inrates
                                                                                                                                                                                                         patient
                                                                                                                                                                                                               of     characteristicsat the
                                                                                                                                                                                                                    noninducibility          is likely because of differences in patient characteristics
                                                                                                                                         end points instudies  a cohortbecause
                                                                                                                                                                             of post-MI VTsVT         patients,     we demon-
                                                                                                   N=125 Pat. 2009-13, 64+/-11J., epi: 37%, multipol. Mappingkath. 51%,
                                                                     in 93
                                                                 strate      outcomplete
                                                                          that    of 112 patients
                                                                                            LAVA (83%).      Eight patients
                                                                                                     elimination,             had pericar- between
                                                                                                                    scar integration                end   of   the procedure        (P=0.0003     with
                                                                                                                                                                                                     and   suspected
                                                                                                                                                                                                            P=0.002,         epicardial
                                                                                                                                                                                                                           respectively).    between studies because VTs with suspected epicardial
                                                                                                                                         strate that complete LAVA elimination, scar integration
                                                                 fromdialimaging,
                                                                           bleedingand(5 related  to epicardial
                                                                                          high-density    mappingapproach).    One patient origin, noninducible clinical VTs, and ongoing VTs dur- origin, noninducible clinical VTs, and ongoing VTs dur-
                                                                                                                     with multipolar
Downloaded from http://ahajournals.org by on September 6, 2019

                                                                                                                                         fromingimaging,
                                                                                                                                                   the procedure and high-density
                                                                                                                                                                          were excluded      mapping
                                                                                                                                                                                                   in the with
                                                                                                                                                                                                             studymultipolar
                                                                                                                                                                                                                       by Deneke et

                                                                                                                                       Downloaded from http://ahajournals.org by on September 6, 2019
                                                                     requiredaresurgery,
                                                                 catheters                whereaspredictors
                                                                                   independent      the othersofresolved   spontaneously.
                                                                                                                   postablation,   VT-
                                                                 freePermanent                                         Imageintegration 38%, all ICM
                                                                                                                                             al. 14 Factors
                                                                                                                                         catheters
                                                                       survival. atrioventricular block occurred in 1 patient. Therefree survival.
                                                                                                                                                        are
                                                                                                                                                     Moreover,
                                                                                                                                                    Results from
                                                                                                                                                                  Associated
                                                                                                                                                               independent
                                                                                                                                                                     in   this   study,
                                                                                                                                                                          univariable
                                                                                                                                                                                       With
                                                                                                                                                                                   predictors
                                                                                                                                                                                          poorly
                                                                                                                                                                                            and
                                                                                                                                                                                                   Clinical
                                                                                                                                                                                                     oftolerated
                                                                                                                                                                                                     multivariable
                                                                                                                                                                                                                  Outcome
                                                                                                                                                                                                          postablation,
                                                                                                                                                                                                                      VTs       VT-
                                                                                                                                                                                                                              requiring
                                                                                                                                                                                                                            analyses
                                                                                                                                                                                                                                             ing the procedure were excluded in the study by Deneke et
                                                                                                                                                                                                                                       for al.the Moreover, in this study, poorly tolerated VTs requiring
                                                                                                                                                                                                                                                14

                                                                     were no strokes, phrenic palsies, coronary injuries, or proce-          cardioversion         >2   times      during     the   procedure         were     observed      cardioversion   >2 times during the procedure were observed
                                                                                                                                             in 21% prediction
                                                                                                                                                          of cases,  of VT
                                                                                                                                                                         which   recurrence
                                                                                                                                                                                     suggestsare         summarized
                                                                                                                                                                                                    a severe       condition  in Table
                                                                                                                                                                                                                                  in the3. in On
                                                                     dure-related
                                                                 Impact     of LAVA deaths.
                                                                                        Elimination                                                                                                                                              21%  of cases,  which suggests a severe condition in the
                                                                                                                                         Impact     multivariable
                                                                                                                                             included of LAVA            analysis, 3 characteristics were associated with
                                                                                                                                                                      Elimination
                                                                                                                                                            population.
                                                                 Complete LAVA elimination was associated with a 2-fold Complete                    theLAVA
                                                                                                                                                          outcome:      (1) the ability          to achieve with complete        LAVA elimi- included  population.
                                                                                                                                                                    elimination        was associated                     a 2-fold
                                                                 reduction in risk of VT recurrence in our cohort. VT nonin- reduction              nation
                                                                                                                                                        in risk   2
                                                                                                                                                                    =0.29;
                                                                                                                                                                (R of           P
Decrement-Evoked Potential Mapping (DEEP)

Prosp. Multizentr. Studie, n=20 Pat., ICM, LPs identifiziert à PES à
    decrement? à Gezielte DEEP Ablation à Re-Induktion...

   DEEP – Potentiale mit Extrastimulus evoziertem Dekrement -
    hohe Spezifität für funktionell relevante (Spät-) Potentiale
                                           Porta-Sanchez et al. JACC Clin EP 2018
Decrement-Evoked Potential Mapping (DEEP)

              N=6 Patienten ICM, endokardiale Maps mit „Multielektroden-
              Mappingballon“, Ablation nach Aktivierungsmap, retrospective
436                    Bewertung der Relevanz von DEEP and LP
      Circ Arrhythm Electrophysiol   December 2015

                                                     Downloaded from http://ahajournals.org by on September 9, 2018

                                                                                                                      Figure 2. A, An example of decremental conduction, unidirectional block, and induction of ventricular tachycardia (VT). Bipoles A
                                                                                                                      located sequentially within the diastolic pathway of the VT circuit. During right ventricular pacing (S1), local abnormal potentials ca

                   DEEPs (dekrement evoked potentials) spezifischer für die
                                                                                                                      seen on bipoles F, I, and J, and these would be annotated when creating a late potential (LP) map. With the introduction of a prem
                                                                                                                      stimulus (S2), there is marked delay of the local electrograms across all bipoles from A to J. With S3, there is block (*) of the local
                                                                                                                      tial on bipole I, and subsequently with S4, there is block (*) at the VT exit site (bipole J). Block at the VT exit site and conduction d
                                                                                                                      through the entrance to the diastolic isthmus sets up the environment for the reentrant circuit to begin. Bipoles A to J then span th

                 Identifizierung des kritischen VT Isthmus als Late Potentials.
                                                                                                                      diastolic limb of the VT circuit. This VT initiation demonstrates the concept of decrement evoked potential mapping; that conducti
                                                                                                                      precedes unidirectional block and the initiation of tachycardia at critical points in the VT circuit. Measurements on S1 and S2 from
                                                                                                                      A to F show the degree of delay of the local potential from QRS onset in milliseconds. Substantial delay occurs at bipoles A and B
                                                                                                                      the extrastimulus, and minimal additional decrement occurs further down the isthmus from bipoles C to F. B, An enlarged image o
                                                                                                                      H from A. The split potential following S1 is enlarged to clearly show the polarity of the local component (†). With S4, block to bip
                                                                                                                      occurs through the exit site of the VT isthmus, and this bipole is subsequently activated via the VT entrance site from the opposite
                                                                                                                      tion. This change in direction of activation leads to an exact polarity change in the local electrogram (‡). C, A corresponding scar m
                                                                                                                      the LV with the voltage scale on the right. Apical electrodes are at the center, basal electrodes at the periphery, and spline 0 is or
                                                                                                                                                              Jack et al., Circ AE 2015
                                                                                                                      to the anterior interventricular groove. Heterogeneous scar is found at the apex and extends to the inferobasal region. The diastol
                                                                                                                      way of the VT shown in Figure 2A is drawn (red arrow), and the corresponding electrodes are labeled.
Bad Neustadt „Approach“

- Zugang: transseptal + retrograd wann immer möglich (simultan)
- Substratorientierte Ablation unter Berücksichtigung der
  induzierten VTs (AI möglichst 700, besser 1000; 45 Watt; z.B.
  SmartTouch SF)
- Ablation LAVA und Spätpotentiale, ggf. Anbindung anatomischer
  Strukturen (Mitralring…)
- Abschließende programmierte Stimulation 500, 400 ms Grund-CL
  bis 4 ES von RV und LV
- Erneute programmierte Stimulation über ICD vor Entlassung:
  Konsequenz??

                                                                  45
Vivek Y. Reddy et al. JACEP 2019;5:778-786

2019 The Authors
Vivek Y. Reddy et al. JACEP 2019;5:778-786

2019 The Authors
Vivek Y. Reddy et al. JACEP 2019;5:778-786

2019 The Authors
Vergleich Multielektrodenkatheter vs. Nav Map                                                                                                                                       9      Tschabrunn et al          High-Resolution Mapping of Ventricular Scar

  Tschabrunn et al          High-Resolution Mapping of Ventricular Scar

                                                                                                                          Vgl. n=3 gesunde, n=11 Schweine mit MI, mapping                                 Figure 8. Difference in electrogram amplitude between multielectrode and linear catheters. Both the linear and the multielectrode cath-
                                                                                                                                                                                                          eters were placed at a site with diastolic electric activity during ventricular tachycardia. Although the multielectrode catheter recorded
                                                                                                                                                                                                          narrow electrograms with near-normal bipolar voltage amplitude (0.62–1.42 mV), the linear catheter, placed at similar position and with a
                                                                                                                                                                                                          tissue contact force of 15 g recorded a fractionated very low amplitude signal (0.08 mV).

                                                                                                                          mit Map (3,5-1-1) und PentaRay (2-6-2) sequentiell.

                                                                                                                                        Downloaded from http://ahajournals.org by on September 10, 2018
                                                                                                                                                                                                          (Pentaray) in the ventricle of normal and postinfarction swine.          electrodes, rather than a measure of the underlying tiss
                                                                                                                                                                                                          In addition, it compared the mapping resolution between                  (healthy versus scar). It is influenced by multiple variabl
                                                                                                                                                                                                          standard linear (Thermocool) and multielectrode (Pentaray)               including electrode size, interelectrode spacing, angle
                                                                                                                                                                                                          catheters within scar tissue during sinus rhythm and VT using            incidence (catheter orientation relative to the surface), t
                                                                                                                                                                                                          EAM, CMR, and histology.                                                 vector of wave propagation, and filtering.9–11 Their com
                                                                                                                                                                                                              The major findings are as follows:

                                                                                                                        - Bipolares Voltage gleich in gesundem Myokard
                                                                                                                                                                                                                                                                                   bined effect is associated with significant variations in t
                                                                                                                                                                                                                                                                                   recorded bipolar voltage amplitude at any single recordin
                                                                                                                                                                                                              1. Bipolar voltage amplitude in the healthy ventricle is
                                                                                                                                                                                                                 similar between linear and multielectrode catheters with          point. Bipolar voltage recorded with standard catheters c
                                                                                                                                                                                                                                                                                   differentiate dense scar (
3           3,44             0,13              88            1,91 ± 0,65       0,88 ± 0,95     1,01 ± 0,96     3,22 ± 1,70     3,66 ± 1,65
4           1,74             0,56              91            2,07 ± 0,66       1,10 ± 0,97     1,34 ± 1,37     3,06 ± 1,66     3,30 ± 1,77
ean     2.42 ± 1.07      0.42 ± 0.27     71.25 ± 22.35       2.05 ± 0.16       0.96 ± 0.12      1.2 ± 0.18     3.30 ± 0.87     3.59 ± 0.91
1
2
3
            1,47
            2,01
            5,32
                Vergleich Multielektrodenkatheter vs. Nav Map
                             0,64
                             1,36
                             2,44
                                               70
                                               17
                                               18
                                                             2,01 ± 0,69
                                                             2,02 ± 0,52
                                                              2,04 0,53
                                                                               1,65 ± 1,99
                                                                               0,64 ± 0,76
                                                                               1,07 ± 0,95
                                                                                               1,98 ± 2,67
                                                                                               1,95 ± 1,00
                                                                                               1,87 ± 2,40
                                                                                                               5,69 ± 4,54
                                                                                                               1,57 ± 0,63
                                                                                                               3,78 ± 2,14
                                                                                                                               5,85 ± 5,03
                                                                                                                               2,62 ± 0,77
                                                                                                                               4,64 ± 2,56
4           5,24             2,47              14            2,37 ± 0,46       1,34 ± 0,91     1,72 ± 1,58     5,01 ± 3,84     6,81 ± 5,34
5           9,35             1,97              17            2,55 ± 0,59       0,78 ± 1,27     0,83 ± 1,36     3,87 ± 3,44     4,06 ± 3,94
6           17,6              1,4              17            2,16 ± 0,59       2,28 ± 2,42     2,44 ± 3,23     5,95 ± 2,76     6,14 ± 2,97
7          12,06               5              182            1,98 ± 0,64       1,64 ± 2,22     1,89 ± 2,48     3,58 ± 2,64     3,72 ± 2,71
8
9             Tiermodell (n=4 Schafe) und 9 Patienten (53 +/-14 J, 8 m, 6 ICM): Sequentielles
            3,32
             2,6
                              0,6
                             0,52
                                               48
                                              150
                                                             1,95 ± 0,69
                                                             2,23 ± 0,61
                                                                               2,11 ± 2,69
                                                                               1,45 ± 1,86
                                                                                               2,26 ± 3,57
                                                                                               1,96 ± 1,94
                                                                                                               5,16 ± 3,30
                                                                                                               6,05 ± 2,88
                                                                                                                               5,76 ± 4,37
                                                                                                                               6,49 ± 5,36

                                Mapping mit Navistar, dann mit Pentaray
ean     6.55 ± 5.43      1.82 ± 1.41     59.22 ± 63.88       2.15 ± 0.20       1.44 ± 0.55     1.88 ± 0.45     4.52 ± 1.46     5.12 ± 1.43

               Pentaray vs. Nav: Mapping-Punkte Dichte 3,2 vs. 0,7 Punkte/cm2;
 pair analysis (!3 mm of distance between a PentaRay and Navi-Star point) from 2 examples by manual signal analysis in 2 different patients
trate maps are put at 100% transparence. LAVA using PR (in purple) and NAV (in white) are tagged in different colors on different maps.
en tags is measured using distance measurement tool in the mapping system. A red arrow indicates a clear LAVA visible with PR mapping but

                      Farfield bipolar 1,43 vs. 1,64; LAVA voltage 0,48 vs. 0,31mV;
sible with NAV mapping.

      höhere „Nearfield“andSensitivität;                                           geringeres „Farfield“ Signal mit größeren
  adapted bipolar voltage maps were created in       When all 818 point pairs were analyzed for each voltage
 ing the conventional thresholds (0.5 – 1.5 mV)   threshold region: normal tissue and low voltage (border zone
etween a PR and NAV map was in the scar area           dense scar), there was no bipolar voltage difference (PR

                                                                           Substratarealen
we lowered the thresholds in both animals and     vs. NAV; bipolar; 3.29 ± 2.07 mV vs. 3.11 ± 2.87 mV, P =
nnels (cf. above), scar heterogeneity, and border 0.294). However, unipolar   voltage was lower with PR versus
etter defined with PR than NAV. Three examples    NAV mapping in normal tissue (PR vs. NAV; 6.49 ± 3.51 mV
Figure 3.
         à geringe Übereinstimmung                                              Pentaray                –andNavistar
                                                  vs. 7.25 ± 4.84 mV, P = 0.003; n = 241). In the border zone
                                                  of the low-voltage area, a significantly lower bipolar      a      bei gleichen Grenzen
Unipolar Far-Field and Near-Field EGM                           trend toward lower unipolar voltage was observed with PR
                                                                (PR vs. NAV; bipolar: 0.92 ± 0.29 mV vs. 1.46 ± 1.33 mV,                      Berte et al. 2015, JCE
                                                                P < 0.001; unipolar: 4.25 ± 2.46 mV vs. 4.42 ± 2.54 mV,
You can also read