Multi-alleles predict primary non-response to infliximab therapy in Crohn's disease - Oxford Academic Journals
←
→
Page content transcription
If your browser does not render page correctly, please read the page content below
Gastroenterology Report, 9(5), 2021, 427–434

                                                                                doi: 10.1093/gastro/goaa070
                                                                                Advance Access Publication Date: 29 December 2020
                                                                                Original Article

ORIGINAL ARTICLE

Multi-alleles predict primary non-response to

                                                                                                                                                           Downloaded from https://academic.oup.com/gastro/article/9/5/427/6055042 by guest on 03 December 2021
infliximab therapy in Crohn’s disease
Cai-Bin Zhang1,†, Jian Tang2,3,†, Xue-Ding Wang1, Kun-Sheng Lyu4,
Min Huang1,* and Xiang Gao2,3,*
1
 Institute of Clinical Pharmacology, School of Pharmaceutical Sciences, Sun Yat-sen University, Guangzhou,
Guangdong, P. R. China; 2Department of Gastroenterology, The Sixth Affiliated Hospital of Sun Yat-sen
University, Guangzhou, Guangdong, P. R. China; 3Guangdong Provincial Key Laboratory of Colorectal and
Pelvic Floor Diseases, The Sixth Affiliated Hospital of Sun Yat-sen University, Guangzhou, Guangdong, P. R.
China; 4Southern China Center for Statistical Science School of Mathematics, Sun Yat-sen University,
Guangzhou, Guangdong, P. R. China
*Corresponding author. Min Huang, School of Pharmaceutical Sciences, Sun Yat-sen University, 132 East Circle at University City, Guangzhou 510006, P. R.
China. Tel: þ86-20-39943027; Fax: þ86-20-87335429; Email: huangmin@mail.sysu.edu.cn; Xiang Gao, Department of Gastroenterology, The Sixth Affiliated
Hospital of Sun Yat-sen University, No. 26 Yuancun Road II, Tian He District, Guangzhou, Guangdong 510000, P. R. China. Tel: þ86-13502405878; Fax: þ86-
20-38254101; Email: helengao818@163.com
†
 These authors contributed equally to this work.

Abstract
Background: Infliximab (IFX) is the first-line treatment for patients with Crohn’s disease (CD) and is noted for its relatively
high cost. The therapeutic efficacy of IFX has noticeable individual differences. Known single-gene polymorphisms (SNPs)
are inadequate for predicting non-response to IFX. In this study, we aimed to identify new genetic factors associated with
IFX-therapy failure and to predict non-response to IFX by developing a multivariate predictive model.
Methods: In this retrospective study, we collected and analysed the data of Chinese patients with CD who received IFX ther-
apy at one hospital between June 2013 and June 2019. Primary non-response (PNR) and non-durable response (NDR) were
evaluated using a simple endoscopic score for CD (SES-CD). A total of 125 SNPs within 44 genes were genotyped. A multivari-
ate logistic-regression model was established to predict non-response to IFX. An area-under-the-receiver-operating-
characteristics curve (AUROC) was applied to evaluate the predictive model performance.
Results: Forty-two of 206 (20.4%) patients experienced PNR and 15 of 159 (9.4%) patients experienced NDR. Nine SNPs were
associated with PNR (P < 0.05). A PNR predictive model was established, incorporating 2-week high-sensitivity C-reactive
protein (hs-CRP), rs61886887, rs61740234, rs357291, rs2269330, and rs111504845, and the AUROC on training and testing data
sets were 0.818 (P < 0.001) and 0.888 (P < 0.001), respectively. At week 14, hs-CRP levels  2.25 mg/L were significantly associ-
ated with NDR (AUROC ¼ 0.815, P < 0.001). PNR-associated SNPs were not mutually associated with NDR, suggesting distinct
mechanisms between PNR and NDR.
Conclusion: Genetic polymorphisms are significantly associated with response to IFX among Chinese CD patients.

Submitted: 6 April 2020; Revised: 18 June 2020; Accepted: 28 July 2020
C The Author(s) 2020. Published by Oxford University Press and Sixth Affiliated Hospital of Sun Yat-sen University
V
This is an Open Access article distributed under the terms of the Creative Commons Attribution Non-Commercial License (http://creativecommons.org/
licenses/by-nc/4.0/), which permits non-commercial re-use, distribution, and reproduction in any medium, provided the original work is properly cited.
For commercial re-use, please contact journals.permissions@oup.com

                                                                                                                                               427
428 | C.-B. Zhang et al.
Key words: infliximab; Crohn’s disease; single nucleotide polymorphism; therapeutic response
Introduction measured by using an enzyme-linked immunosorbent assay
(Immundiagnostik AG, Germany) according to the manufac-
Crohn’s disease (CD) is a complex chronic inflammatory disease
turer’s instructions.
of the gastrointestinal tract that can induce progressive bowel
damage and disability [1]. Infliximab (IFX), a chimeric monoclo-
nal antibody, is now firmly established as an effective therapeu- Genotyping
tic approach for inflammatory bowel disease (IBD) despite its Patients’ DNA was extracted from ethylene diamine tetraacetic
high cost [2]. However, 15%–40% of IBD patients experience pri- acid blood samples using the TIANamp Genomic DNA Kit
mary IFX-treatment failure [3, 4] and secondary loss of response (Tiangen Biotech, Beijing, China) and was stored at 80 C until
is estimated to occur at a rate of 13% per year [5]. The high cost use. We analysed 125 tag SNPs within 44 genes (IBD-susceptibil-
of treatment and the high rate of resistance to therapy make it
Downloaded from https://academic.oup.com/gastro/article/9/5/427/6055042 by guest on 03 December 2021
ity genes, inflammatory-related genes, apoptosis-related genes,
imperative to identify patients who are likely to fail IFX therapy IGg Fc-receptor family genes). The characteristics of all tag SNPs
as soon as possible and change their treatment to a more cost- are shown in Supplementary Table 1. Tag SNPs were genotyped
effective alternative. using the MassArray Analyzer system (Sequenom, Inc., San
Despite large inter-individual differences in the therapeutic Diego, CA, USA) according to the manufacturer’s instructions.
efficacy of IFX, few practical and accurate indicators are avail- The linkage disequilibrium was calculated using Haploview bio-
able to predict IFX therapeutic efficacy. Many clinical and ge- informatics software version 4.2 (Broad Institute, Cambridge,
netic factors have been observed to affect the therapeutic MA, USA), as previously described [17]. The Hardy–Weinberg
efficacy of IFX [6–11]. However, only one study, by Barber et al. equilibrium and inherence model was analysed by SNPStats
[12], has integrated clinical characteristics and genetic factors, [18]. The best model for a specific SNP depends on the lowest
and treated subjects with multiple monoclonal antibodies, in- Akaike’s Information Criterion value.
cluding adalimumab and infliximab. A recent study by
Quistrebert et al. [13] showed that the cumulative incidence of
anti-drug antibody (ADA) varied significantly between patients Definitions of therapeutic outcomes
treated with adalimumab and infliximab. However, the ADA Simple endoscopic score for Crohn’s disease (SES-CD) values
level influences the clinical outcomes of monoclonal-antibodies were reported by endoscopists. Primary non-response (PNR)
therapy [14–16]. Therefore, the predictors provided in the study was evaluated at week 14 and non-durable response (NDR) was
by Barber et al. [12], which are based on heterozygous patients evaluated at weeks 22–52, which were defined as a decrease
(treated with different antibodies), may not be accurate enough from baseline in SES-CD of < 50% with simultaneous SES-CD >
for patients treated with IFX alone. 2 [19].
In this study, we comprehensively analysed the clinical
characteristics and genetic factors of CD patients who received
Statistical analysis
IFX alone, aiming to explore the practical genetic biomarkers
that can indicate IFX therapeutic efficacy and identify patients Descriptive statistics were provided with median and interquar-
non-responsive to IFX therapy. Also, by establishing a multige- tile range (IQR) or 95% confidence interval (CI) for continuous
netic predictive model and individualizing IFX therapy, we non-normally distributed variables, or with mean and standard
aimed to potentially reduce patients’ healthcare costs. deviation (mean 6 SD) for normally distributed data, respec-
tively. The Mann–Whitney U test (two groups) and the Kruskal–
Patients and methods Wallis test (more than two groups) were applied to compare
continuous non-normal variables and the unpaired t-test (two
Patients and data collection
groups) was used to analyse normal variables. Fisher’s exact or
This retrospective study included Chinese patients with CD who Chi-square test was used to analyse discrete variables. All sta-
were scheduled for IFX induction therapy at the Sixth Affiliated tistical analyses were performed using SPSS version 24.0 (IBM
Hospital of Sun Yat-sen University (Guangzhou, China) between 1 Corp., Armonk, NY, USA).
June 2013 and 1 June 2019. All patients were treated with 5 mg/kg In order to establish a predictive model, all patients were
of IFX at weeks 0, 2, and 6 during induction therapy, and 5 or randomly divided into training data sets (60%) and testing (40%)
10 mg/kg of IFX every 8 weeks during maintenance therapy. We data sets. This data-set-splitting process was repeated 100
collected and analysed patients’ demographic and clinical data, times to eliminate the randomness and, therefore, we obtained
including sex, age, body mass index (BMI), disease duration, dis- 100 training data sets and 100 testing data sets. Each training
ease behavior and location, perianal lesions, previous bowel sur- data set was fitted using the least absolute shrinkage and selec-
gery, co-administration with thiopurine immunosuppressive tion operator (LASSO) [20] to perform variable selection. Then,
therapy, and laboratory values including serum albumin and the frequency of the variables included in the LASSO procedure
high-sensitivity C-reactive protein (hs-CRP) levels. The study pro- were counted and added one after another into the logistic-
tocol was approved by the ethics committee of the Sixth Affiliated regression model according to their frequency from high to low
Hospital of Sun Yat-sen University, Guangzhou, China (IRB ap- in 100 training data sets, until the mean area-under-the-
proval number: 2018ZSLYEC-091). All patients provided signed in- receiver-operating-characteristic curve (AUROC) had no obvious
formed consent. increase. Thereafter, the split with an AUROC closest to the av-
erage for the logistic-regression model was chosen as a repre-
Concentrations of infliximab and ADAs sentative split. The multivariate model was established in
We collected serum samples at week 14 to detect the concentra- representative training data sets and validated in representative
tions of IFX and ADAs. Concentrations of IFX and ADAs were testing data sets. A receiver-operating-characteristic (ROC)Alleles predict non-response to infliximab | 429
curve was applied to evaluate the performance of the multivari- hs-CRP levels at week 14 (9.6 mg/L [1.7–14.2] vs 1.2 mg/L [0.4–2.6],
ate model, the optimal threshold predictive value of the median and IQR; P < 0.001), lower IFX levels at week 14 (1.5 lg/
multivariate-regression model was identified using maximum ml [0.6–3.5] vs 3.8 lg/ml [1.7–6.7], median and IQR; P < 0.001), and
Youden’s index. Multivariate-regression-model analysis was greater likelihood of ADAs (odds ratio ¼ 3.78, P ¼ 0.001) (Table 1).
performed using the statistical language R (version 3.4.1, A higher hs-CRP level at week 14 is an indicator of durable re-
Foundation for Statistical Computing, Vienna, Austria). sponse to IFX therapy. Compared with hs-CRP levels in patients
with a durable response to IFX, NDR patients had higher hs-CRP
levels at week 14 (4.8 mg/L [2.0–12.3] vs 1.0 mg/L [0.4–2.3], me-
Results dian and IQR; P < 0.001). Other clinical characteristics had no
associations with NDR status (P > 0.05) (Supplementary Table 2).
Patients’ characteristics
A total of 206 eligible Chinese patients with CD were included in
Genotypes and PNR
this study. Disease and patient characteristics are depicted in
Table 1. Of these patients, 42 (20.4%) experienced PNR during A total of 125 tag SNPs within 44 genes were detected. Of these,
Downloaded from https://academic.oup.com/gastro/article/9/5/427/6055042 by guest on 03 December 2021
IFX induction therapy and 164 (79.6%) achieved primary re- 2 SNPs had no minor allele and 12 SNPs were not in the Hardy–
sponse. Among the 164 patients who achieved primary re- Weinberg equilibrium, so they were excluded from subsequent
sponse to IFX, 159 received colonoscopy at weeks 22–52; 15 of analysis, as shown in Supplementary Table 1. Chi-square-tests
159 (9.4%) patients were NDR to IFX therapy. No effects of analysis showed that 9 of the remaining 111 tag SNPs were sig-
patients’ sex, age, BMI, disease characteristics, previous bowel nificantly associated with PNR (P < 0.05), as listed in Table 2.
surgery, and co-administration with thiopurine on primary re- None of the other 102 SNPs was potentially associated with PNR
sponse to IFX were observed (P > 0.05). Patients’ serum albumin (Supplementary Table 3).
and high-sensitivity C-reactive protein (hs-CRP) levels were
recorded at weeks 2 and 14, as well as IFX levels and ADAs at
week 14. Compared with patients with a primary response to
Multivariate predictive model for PNR
IFX, PNR patients had higher hs-CRP levels at week 2 (2.1 mg/L To establish a multivariate predictive model for PNR, we used
[1.0–8.2] vs 1.0 mg/L [0.4–3.0], median and interquartile range the LASSO method to select variables as listed in Table 2 and
[IQR]; P < 0.001), lower albumin levels at week 14 (41.0 g/L [36.9– Supplementary Table 3. The frequencies of those SNPs from the
42.7] vs 43.6 g/L [41.1–46.6], median and IQR; P < 0.001), higher LASSO procedure were counted and added one after another
Table 1. Relationships between patients’ characteristics and PNR
Demographic and clinical characteristic Primary non-responders Primary responders P-valuea
(n ¼ 42) (n ¼ 164)
Sex – – 0.475
Male, n (%) 33 (78.6) 120 (73.2) –
Female, n (%) 9 (21.4) 44 (26.8) –
Age, years, median [IQR] 23.5 [16.8–33.5] 23.0 [18.0–27.6] 0.312
BMI, kg/m2, median [IQR] 17.4 [16.1–19.3] 18.3 [16.7–19.7] 0.105
Disease duration, month, median [IQR] 12.0 [6.0–42.0] 12.0 [6.0–36.0] 0.826
Disease behavior, n (%) – – 0.238
B1 30 (71.4) 134 (81.7) –
B2 6 (14.3) 13 (7.9) –
B3 5 (11.9) 12 (7.3) –
B2þ B3 1 (2.4) 5 (3.0) –
Disease location, n (%) – – 0.611
L1 2 (4.8) 12 (7.3) –
L2 2 (4.8) 5 (3.0) –
L3 33 (78.6) 125 (76.2) –
L1þ L4 0 (0) 7 (4.3) –
L2þ L4 0 (0) 0 (0) –
L3þ L4 5 (11.9) 15 (9.1) –
Perianal lesions, n (%) 29 (69.0) 124 (75.6) 0.385
Previous bowel surgery, n (%) 8 (19.0) 25 (15.2) 0.549
Combined with thiopurine, n (%) 20 (47.6) 86 (52.4) 0.868
hs-CRP at baseline, mg/L, median [IQR] 11.6 [8.2–29.8] 11.5 [6.8–15.5] 0.284
Albumin at week 2, g/L, median [IQR] 40.2 [36.5–44.0] 42.6 [38.8–45.2] 0.061
hs-CRP at week 2, mg/L, median [IQR] 2.1 [1.0–8.2] 1.0 [0.4–3.0]430 | C.-B. Zhang et al.
Table 2. Genotypes and primary non-response to infliximab
Gene rs number Genotype Inherence model P-valuea OR 95% CI
C1orf106 rs61740234 CCþTT vs CT Overdominant 0.010 4.49 1.31–15.32
CCDC88B rs61886887 TTþTC vs CC Dominant 0.002 0.08 0.01–0.61
NF-kB1 rs7674004 GGþAA vs GA Overdominant 0.039 0.47 0.23–0.97
IL1RN rs396201 TTþCC vs TC Overdominant 0.035 2.18 1.05–4.56
IL17RA rs2241046 TTþTC vs CC Recessive 0.012 0.17 0.04–0.80
OSMR rs357291 AAþAC vs CC Recessive 0.005 0.33 0.15–0.73
TRIM21 rs2269330 GGþGA vs AA Dominant 0.006 0.35 0.16–0.75
RIPK1 rs9378763 AAþAC vs CC Dominant 0.047 2.11 1.00–4.48
FCGR3A rs111504845 GGþGA vs AA Dominant 0.047 2.50 1.00–6.33
a
Chi-square tests.
Downloaded from https://academic.oup.com/gastro/article/9/5/427/6055042 by guest on 03 December 2021
OR, odds ratio; CI, confidence interval.
C1orf106, chromosome 1 open reading frame 106; CCDC88B, coiled-coil domain containing 88B; NF-kB1, nuclear factor kappa B subunit 1; IL1RN, interleukin 1 receptor
antagonist; IL17RA, interleukin 17 receptor A; OSMR, oncostatin M receptor; TRIM21, tripartite motif containing 21; RIPK1, receptor interacting serine/threonine kinase 1;
FCGR3A, Fc fragment of IgG receptor IIIa.
the combined genetic–clinical predictive model in the represen-
tative testing data set was 0.888 (95% CI: 0.812–0.963, P < 0.001)
(Figure 2D). The AUROCs of the genetic–clinical model were su-
perior to those of the genetic model in both the representative
testing data set and the training data set. Therefore, we chose
the genetic–clinical model for further analysis.
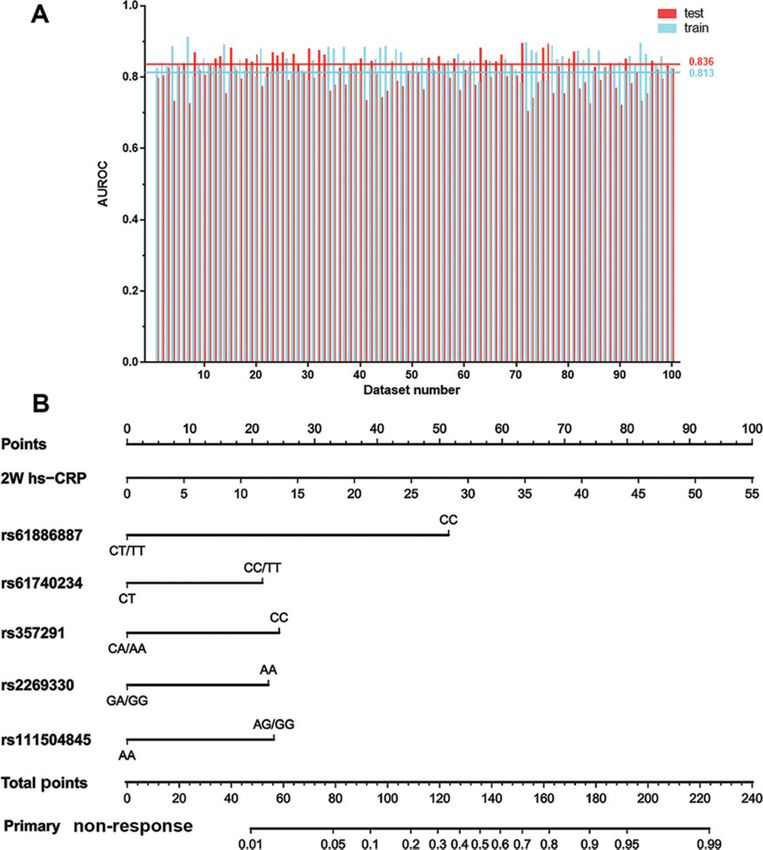
Stability and convenience of the combined genetic–
clinical predictive model
To evaluate the stability of the combined genetic–clinical
model, all AUROCs of 100 training data sets and 100 testing data
sets obtained from 100 data-set splitting were calculated, as
shown in Figure 3A. For the 100 training data sets and the 100
testing data sets, the AUROCs were 0.813 6 0.044 and
0.836 6 0.029, respectively. Most AUROCs for the training data
sets were close to those for the testing data sets, with a differ-
ence in mean AUROC of 0.02. Therefore, the combined genetic–
Figure 1. Mean accumulated area-under-the-receiver-operating-characteristic
clinical model is stable and has no overfitting.
curve (AUROC) in 100 test data sets of single-gene polymorphisms (SNPs) added To develop the most accurate genetic–clinical predictive
one after another into a logistic-regression model. The sequence of SNPs model for future use, multivariate logistic-regression analysis
depended on their frequency (obtained from the Least Absolute Shrinkage and was performed using the entire data set, which allows the cal-
Selection Operator [LASSO] procedure) from high to low (the order of the top culation of variables and determination of relative importance
eight SNPs is as follows: rs61886887, rs61740234, rs357291, rs2269330,
(Table 3). A score nomogram based on the entire data set was
rs111504845, rs7446274, rs5746059, rs6682925). When rs7446274 was added into
the model, the mean accumulated AUROC did not increase obviously.
created and could be used easily and simply to calculate PNR to
IFX therapy. It was developed using hs-CRP values at week 2
(rs61886887, rs61740234, rs357291, rs2269330, and rs111504845)
into a logistic-regression model according to their frequency
(Figure 3B).
from high to low (the order of the top 8 SNPs is as follows:
rs61886887, rs61740234, rs357291, rs2269330, rs111504845,
rs7446274, rs5746059, rs6682925), until the mean accumulated High-sensitivity C-reactive protein predicts NDR
AUROC in 100 training data sets had no obvious increase. When Although no SNPs were associated with NDR (Supplemental
adding rs7446274 into the model, the mean accumulated Table 4), we found that the 14-week hs-CRP level was signifi-
AUROC had no obvious increase (Figure 1). Therefore, the top cantly associated with NDR (Table 1). In estimating the accurate
five SNPs were selected to fit the genetic predictive model in a threshold level of 14-week hs-CRP to predict NDR, ROC-curve
representative training data set. The AUROC of the genetic pre- analysis was conducted on the entire data set. The optimal
dictive model that fitted the training data set was 0.794 (95% CI: threshold level of 14-week hs-CRP was 2.25 mg/L, AUROC was
0.682–0.905, P < 0.001); its sensitivity and specificity were 81.8% 0.815 (95% CI: 0.721–0.909, P < 0.001), and sensitivity and specif-
and 72.0%, respectively (Figure 2A). The genetic model was also icity were 78.6% and 74.8%, respectively (Figure 4). This result
verified in a representative testing data set, with an AUROC of indicates that the 14-week hs-CRP level is a valuable predictor
0.812 (95% CI: 0.714–0.910, P < 0.001) (Figure 2B). The hs-CRP level of NDR.
was added at week 2 to improve the performance of the genetic
predictive model. The AUROC of this combined genetic–clinical
predictive model in the representative training data set was Discussion
0.818 (95% CI: 0.716–0.921, P < 0.001), with sensitivity and specif- IFX is a mainstay therapy for moderate to severe IBD [21, 22],
icity of 86.9% and 72.0%, respectively (Figure 2C). The AUROC of but the high incidence of PNR and NDR hinders its effectiveAlleles predict non-response to infliximab | 431
Downloaded from https://academic.oup.com/gastro/article/9/5/427/6055042 by guest on 03 December 2021
Figure 2. Receiver-operating characteristic curve analysis of the performance of a multivariate logistic-regression model in representative training data sets and repre-
sentative testing data sets. (A) The AUROC of the genetic predictive model fitted into the training data set was 0.794 (95% CI: 0.682–0.905, P < 0.001). (B) The genetic
model was verified in the testing data set, AUROC ¼ 0.812 (95% CI: 0.714–0.910, P < 0.001). (C) The AUROC of the combined genetic–clinical predictive model in the train-
ing data set was 0.818 (95% CI: 0.716–0.921, P < 0.001). (D) The AUROC of the combined genetic–clinical predictive model in the testing data set was 0.888 (95% CI: 0.812–
0.963, P < 0.001).
clinical application. In the present study, a combined genetic– week 2 in predicting response to IFX. As expected, the genetic–
clinical model (with hs-CRP, C1orf106 rs61740234, CCDC88B clinical predictive model incorporating 2-week hs-CRP levels
rs61886887, OSMR rs357291, TRIM21 rs2269330, and FCGR3A predicted significant IFX response at week 14, with an AUROC of
rs111504845) for PNR had superior discriminatory power, with 0.818 (95% CI: 0.716–0.921, P < 0.001) compared to an AUROC of
an AUROC in the representative training and testing data sets of 0.794 (95% CI: 0.682–0.905, P < 0.001) in the genetic predictive
0.818 and 0.888, respectively. Furthermore, 14-week hs-CRP lev- model.
els were demonstrated to be a useful predictor of NDR However, in the present study, no associations were found
(AUROC ¼ 0.815). between SNPs and NDR (Supplementary Table 4). PNR-
Potentially relevant parameters have been explored exten- associated SNPs were not mutually associated with NDR, imply-
sively in previous studies and several clinical risk factors were ing that the mechanisms of PNR and NDR are distinctive. A total
found to be associated with the therapeutic efficacy of IFX, in- of 31 SNPs reported to be significantly associated with response
cluding sex [6], duration of disease [7], albumin [8], and CRP lev- to IFX by Barber et al. [12], Burke et al. [27], Prieto-Perez et al. [10],
els [9, 23]. However, the results are inconsistent between and Linares-Pineda et al. [11] (Supplementary Table 5) were ana-
studies. In particular, the effect of CRP, an important indicator lysed in the present study. However, none of these was associ-
for inflammation intensity, on therapeutic response was still ated with IFX response in Chinese patients (Supplementary
very controversial. Morita et al. [24] showed that CRP levels at Tables 3 and 4), which may be explained by ethnic differences
week 2 were significantly lower in the responders than those in in genetic polymorphisms in response to IFX and by the use of
the non-responders, but the same results were not found by Lee multiple monoclonal antibodies in the included subjects rather
et al. [25] or Ferrante et al. [26]. In the present study, no differen- than using only IFX.
ces were found in the baseline levels of hs-CRP between pri- The present study was strengthened by including a large
mary responders and primary non-responders to IFX. However, number of patients whose primary endpoint was defined by en-
surprisingly, significant differences were observed in the levels doscopy. Endoscopic results are reproducible and correlate reli-
of hs-CRP at week 2 between the two groups of the study popu- ably with clinical activity. Many previous studies defined
lation, indicating that the levels of hs-CRP were significant at therapeutic outcomes based on the CD activity index or the432 | C.-B. Zhang et al.
Downloaded from https://academic.oup.com/gastro/article/9/5/427/6055042 by guest on 03 December 2021
Figure 3. Stability and convenience of the combined genetic–clinical predictive model. (A) All AUROCs of the combined genetic–clinical model in 100 training data sets
and 100 testing data sets obtained from a process of splitting the data set 100 times. The mean AUROCs of the training and testing data sets were 0.813 6 0.044 and
0.836 6 0.029 (mean and SD), respectively. The differences in mean AUROC between the training and testing data sets was 0.02. (B) A score nomogram based on the en-
tire data set was developed with the inclusion of high-sensitivity C-reactive protein (hs-CRP) at week 2 (rs61886887, rs61740234, rs357291, rs2269330, and rs111504845).
Harvey–Bradshaw index. However, it must be noted that some further exploration of underlying response mechanisms. We
of these indices are open to subjective interpretation [28]. In also developed a combined genetic–clinical model with good
contrast, SES-CD has good reproducibility and low subjectivity discriminatory power and high performance to predict PNR.
[19], which help to assure the accuracy of the end points. Results of the present study indicate that the 14-week hs-CRP
Nevertheless, this study has several limitations. Although level is a competent predictor of NDR. Findings of this study
nine SNPs were found to be significantly associated with PNR to may help to identify patients who are PNR and NDR to IFX ther-
IFX, additional mechanistic and clinical investigations are war- apy and may potentially reduce patients’ healthcare costs via
ranted to verify the relationships. In addition, although we personalized IFX therapy.
tested the performance of our predictive model in a representa-
tive testing data set, a prospective study is still needed to vali-
date the discriminatory power of this model.
Supplementary data
In summary, in the present retrospective study, which
includes a large number of CD patients, nine SNPs were identi- Supplementary data is available at Gastroenterology Report
fied as potential indicators of PNR to IFX, providing a basis for online.Alleles predict non-response to infliximab | 433
Table 3. Multivariate logistic-regression analysis in entire data set Conflicts of interest
Variable b P-value OR 95% CI None declared.
hs-CRP at week 2 0.095 0.010 1.10 1.02–1.18
rs61740234 CCþTT vs CT 1.130 0.054 3.10 0.98–9.80
References
rs61886887 TTþTC vs CC 2.685 0.012 0.07 0.01–0.55
rs357291 AAþAC vs CC 1.269 0.011 0.28 0.11–0.75 1. Baumgart DC, Sandborn WJ. Crohn’s disease. Lancet 2012;380:
rs2269330 GGþGA vs AA 1.180 0.009 0.31 0.13–0.74 1590–605.
rs111504845 GGþGA vs AA 1.226 0.023 3.41 1.19–9.77 2. Mitrev N, Vande Casteele N, Seow CH et al. Review article:
consensus statements on therapeutic drug monitoring of
Factors were statistically analysed by multivariate logistic-regression analysis; anti-tumour necrosis factor therapy in inflammatory bowel
constant is 0.839. diseases. Aliment Pharmacol Ther 2017;46:1037–53.
hs-CRP, high-sensitivity C-reactive protein; OR, odds ratio; CI, confidence
3. Buhl S, Steenholdt C, Rasmussen M et al. Outcomes after pri-
interval.
mary infliximab treatment failure in inflammatory bowel dis-
Downloaded from https://academic.oup.com/gastro/article/9/5/427/6055042 by guest on 03 December 2021
ease. Inflamm Bowel Dis 2017;23:1210–7.
4. Ben-Horin S, Kopylov U, Chowers Y. Optimizing anti-TNF
treatments in inflammatory bowel disease. Autoimmun Rev
2014;13:24–30.
5. Ben-Horin S, Chowers Y. Review article: loss of response to
anti-TNF treatments in Crohn’s disease. Aliment Pharmacol
Ther 2011;33:987–95.
6. Papamichael K, Rakowsky S, Rivera C et al. Association be-
tween serum infliximab trough concentrations during main-
tenance therapy and biochemical, endoscopic, and histologic
remission in Crohn’s disease. Inflamm Bowel Dis 2018;24:
2266–71.
7. Roblin X, Boschetti G, Duru G et al. Distinct thresholds of
infliximab trough level are associated with different thera-
peutic outcomes in patients with inflammatory bowel dis-
ease: a prospective observational study. Inflamm Bowel Dis
Figure 4. ROC curves of the association of 14-week high-sensitivity C-reactive 2017;23:2048–53.
protein (hs-CRP) level with non-durable response (NDR) to IFX. The optimal 8. Suzuki Y, Matsui T, Ito H et al. Circulating interleukin 6 and al-
threshold level of 14-week hs-CRP was 2.25 mg/L and the AUROC was 0.815 (95% bumin, and infliximab levels are good predictors of recover-
CI: 0.721–0.909, P < 0.001). Sensitivity and specificity were 78.6% and 74.8%,
ing efficacy after dose escalation infliximab therapy in
respectively.
patients with loss of response to treatment for Crohn’s dis-
ease: a prospective clinical trial. Inflamm Bowel Dis 2015;21:
2114–22.
9. Wong U, Cross RK. Primary and secondary nonresponse to
Authors’ contributions infliximab: mechanisms and countermeasures. Expert Opin
C.B.Z. and J.T. contributed to the study design, research perfor- Drug Metab Toxicol 2017;13:1039–46.
mance, sample collection, acquisition of data, and manuscript 10. Prieto-Perez R, Almoguera B, Cabaleiro T et al. Association be-
writing; X.D.W. contributed to the study design, data analysis, tween genetic polymorphisms and response to anti-TNFs in
and revision of the draft; K.S.L. contributed to the study design, patients with inflammatory bowel disease. Int J Mol Sci 2016;
data analysis, and revision of the draft; M.H. and X.G., as the co- 17:225.
corresponding authors, were involved in the study design and 11. Linares-Pineda TM, Canadas-Garre M, Sanchez-Pozo A et al.
revision of the draft. All authors read and approved the final Pharmacogenetic biomarkers of response in Crohn’s disease.
version of this paper. Pharmacogenomics J 2018;18:1–13.
12. Barber GE, Yajnik V, Khalili H et al. Genetic markers predict
primary non-response and durable response to anti-TNF bio-
Funding logic therapies in Crohn’s disease. Am J Gastroenterol 2016;
This study was supported by the National Natural Science 111:1816–22.
Foundation of China [Grant No. 81573507, 81473283, 13. Quistrebert J, Hassler S, Bachelet D et al. Incidence and risk
factors for adalimumab and infliximab anti-drug antibodies
81173131, and 81320108027], the Natural Major Projects for
in rheumatoid arthritis: a European retrospective multico-
science and technology development from Science and
hort analysis. Semin Arthritis Rheum 2019;48:967–75.
Technology Ministry of China [Grant No. 2012ZX09506001-
14. Kennedy NA, Heap GA, Green HD et al. Predictors of anti-TNF
004], the Major Scientific and Technological Project of
treatment failure in anti-TNF-naive patients with active lu-
Guangdong Province [Grant No. 2011A080300001], and the
minal Crohn’s disease: a prospective, multicentre, cohort
Medical Scientific Research Foundation of Guangdong study. Lancet Gastroenterol Hepatol 2019;4:341–53.
Province of China [Grant No. A2020123]. 15. Hambardzumyan K, Hermanrud C, Marits P et al. Association
of female sex and positive rheumatoid factor with low serum
infliximab and anti-drug antibodies, related to treatment fail-
Acknowledgements ure in early rheumatoid arthritis: results from the SWEFOT
None declared. trial population. Scand J Rheumatol 2019;48:362–6.434 | C.-B. Zhang et al.
16. Vermeire S, Gils A, Accossato P et al. Immunogenicity of bio- 23. Tang J, Zhang C-B, Lyu K-S et al. Association of polymor-
logics in inflammatory bowel disease. Therap Adv phisms in C1orf106, IL1RN, and IL10 with post-induction
Gastroenterol 2018;11:1756283X1775035. infliximab trough level in Crohn’s disease patients.
17. Gabriel SB, Schaffner SF, Nguyen H et al. The structure of hap- Gastroenterol Rep (Oxf) 2019, 10.1093/gastro/goz056.
lotype blocks in the human genome. Science 2002;296:2225–9. 24. Morita Y, Bamba S, Takahashi K et al. Prediction of clinical
18. Sole X, Guino E, Valls J et al. SNPStats: a web tool for the analy- and endoscopic responses to anti-tumor necrosis factor-
sis of association studies. Bioinformatics 2006;22:1928–9. alpha antibodies in ulcerative colitis. Scand J Gastroenterol
19. Vuitton L, Marteau P, Sandborn WJ et al. IOIBD technical re- 2016;51:934–41.
view on endoscopic indices for Crohn’s disease clinical trials. 25. Lee KM, Jeen YT, Cho JY et al. Efficacy, safety, and predictors
Gut 2016;65:1447–55. of response to infliximab therapy for ulcerative colitis: a
20. Tibshirani R. Regression shrinkage and selection via the Korean multicenter retrospective study. J Gastroenterol Hepatol
lasso. J R Stat Soc Series B Stat Methodol 1996;58:267–88. 2013;28:1829–33.
21. Brandse JF, Mathot RA, van der Kleij D et al. Pharmacokinetic 26. Ferrante M, Vermeire S, Katsanos KH et al. Predictors of early
features and presence of antidrug antibodies associate with response to infliximab in patients with ulcerative colitis.
Downloaded from https://academic.oup.com/gastro/article/9/5/427/6055042 by guest on 03 December 2021
response to infliximab induction therapy in patients with Inflamm Bowel Dis 2007;13:123–8.
moderate to severe ulcerative colitis. Clin Gastroenterol Hepatol 27. Burke KE, Khalili H, Garber JJ et al. Genetic markers predict pri-
2016;14:251–8.e2. mary nonresponse and durable response to anti-tumor ne-
22. Miligkos M, Papamichael K, Vande Casteele N et al. Efficacy crosis factor therapy in ulcerative colitis. Inflamm Bowel Dis
and safety profile of anti-tumor necrosis factor-a versus anti- 2018;24:1840–8.
integrin agents for the treatment of Crohn’s disease: a net- 28. Papay P, Ignjatovic A, Karmiris K et al. Optimising monitoring
work meta-analysis of indirect comparisons. Clin Ther 2016; in the management of Crohn’s disease: a physician’s per-
38:1342–58.e6. spective. J Crohns Colitis 2013;7:653–69.You can also read