Multi-GPA-Tree: Statistical Approach for Pleiotropy Informed and Functional Annotation Tree Guided Prioritization of GWAS Results
←
→
Page content transcription
If your browser does not render page correctly, please read the page content below
multi-GPA-Tree: Statistical Approach for Pleiotropy Informed and
                                          Functional Annotation Tree Guided Prioritization of GWAS Results
                                             Aastha Khatiwada1 , Ayse Selen Yilmaz2 , Bethany J. Wolf3 , Maciej Pietrzak2 , and Dongjun Chung2,4,*

                                                        1
                                                         Department of Biostatistics and Bioinformatics, National Jewish Health, Denver, CO, USA
                                                         2 Department
arXiv:2302.01982v1 [stat.ME] 3 Feb 2023

                                                                         of Biomedical Informatics, The Ohio State University, Columbus, Ohio, USA
                                                    3 Department of Public Health Sciences, Medical University of South Carolina, Charleston, SC, USA
                                             4 Pelotonia Institute for Immuno-Oncology, The James Comprehensive Cancer Center, The Ohio State University
                                                                     * To whom correspondence should be addressed (chung.911@osu.edu).

                                                                                             Abstract
                                                 Genome-wide association studies (GWAS) have successfully identified over two hundred thousand
                                             genotype-trait associations. Yet some challenges remain. First, complex traits are often associated
                                             with many single nucleotide polymorphisms (SNPs), most with small or moderate effect sizes, making
                                             them difficult to detect. Second, many complex traits share a common genetic basis due to ‘pleiotropy’
                                             and and though few methods consider it, leveraging pleiotropy can improve statistical power to detect
                                             genotype-trait associations with weaker effect sizes. Third, currently available statistical methods are
                                             limited in explaining the functional mechanisms through which genetic variants are associated with
                                             specific or multiple traits. We propose multi-GPA-Tree to address these challenges. The multi-GPA-Tree
                                             approach can identify risk SNPs associated with single as well as multiple traits while also identifying the
                                             combinations of functional annotations that can explain the mechanisms through which risk-associated
                                             SNPs are linked with the traits.
                                                 First, we implemented simulation studies to evaluate the proposed multi-GPA-Tree method and com-
                                             pared its performance with an existing statistical approach.The results indicate that multi-GPA-Tree
                                             outperforms the existing statistical approach in detecting risk-associated SNPs for multiple traits. Sec-
                                             ond, we applied multi-GPA-Tree to a systemic lupus erythematosus (SLE) and rheumatoid arthritis
                                             (RA), and to a Crohn’s disease (CD) and ulcertive colitis (UC) GWAS, and functional annotation data
                                             including GenoSkyline and GenoSkylinePlus. Our results demonstrate that multi-GPA-Tree can be a
                                             powerful tool that improves association mapping while facilitating understanding of the underlying ge-
                                             netic architecture of complex traits and potential mechanisms linking risk-associated SNPs with complex
                                             traits.
                                             Availability: The multiGPATree software is available at https://dongjunchung.github.io/multiGPATree/.

                                             1         Introduction
                                             Increasing interest in identifying genomic regions associated with complex traits has resulted in a substan-
                                             tial increase in the number of reported GWAS studies and genotype-trait associations (https://www.ebi.ac.uk/gwas/)
                                             [1]. Identification of previously unknown genotype-trait associations has improved estimation of heri-
                                             tability (genetic variation within a trait) for many complex traits. However, two major challenges persist.
                                             First, some proportion of heritability remains missing for many traits due to unidentified genotype-trait

                                                                                                  1
associations [2, 3, 4]. Polygenicity, a phenomenon that causes genetic variants to be associated with traits
with weak or moderate effect sizes [5, 6] is a plausible explanation for missing heritibility. The impact of
polygenicity can theoretically be reduced by recruiting a larger GWAS sample size to increase statistical
power to detect weak and moderate associations; however, large sample recruitment often requires more
resources and is not always feasible due to limited trait prevalence in the population [7]. An alternative
to increasing sample size to improve statistical power is to exploit the pleiotropic relationship (shared
genetic basis) between two or more traits by simultaneously integrating GWAS association summary
statistics for multiple traits [8, 9, 10]. GWAS summary statistics are readily available to use as input
through public data repositories [1, 11] and are good proxy to using individual-level genotype-phenotype
data that are harder to obtain. Second, majority of the GWAS identified loci are located in the non-
coding regions [12], making it difficult to understand the functional mechanisms related to identified
genotype-trait associations. For example, in autoimmune diseases, about 90% of the causal genetic vari-
ants lie in non-coding regions, a bulk of which are located in regulatory DNA regions [14, 13]. As such,
utilizing genomic functional annotation information that can provide information related to different
types of histone modifications, epigenetic and cell- and tissue-specific changes, etc. can be useful to de-
code the functional mechanisms linking risk-associated genetic variants to traits [16, 17, 15]. Therefore,
integrative analysis of genetic data with genomic functional annotation data is a promising direction.
   Statistical methods built on the foundation of data integration approaches not only utilize informa-
tion that are readily available in public data repositories but also overcome the challenges posed by
polygenicity while simultaneously providing insights about underlying functional mechanisms related to
one or more traits. Therefore, they are more advantageous and efficient. In recognizing the potential to
enhance statistical power to detect associations through data integration approaches, several statistical
methods focused on GWAS summary statistics have been developed [16, 17, 8, 10, 19, 20]. These methods
can broadly be classified into three distinct categories.
   The first category of methods exploit the pleiotropic relationship between two or more distinct traits
by simultaneously integrating multiple GWAS association p-values together. Two favored methods in
this category are the pleiotropy-informed conditional FDR approach [8] and the graph-GPA approach
[10]. The unifying goal of the two methods is to improve statistical power to prioritize one or more
trait risk-associated SNPs. The conditional FDR approach shows improved detection of risk-associated
SNPs for two psychiatric disorders, schizophrenia and bipolar disorder. Despite easy implementation
of this approach, the lack of a model-based framework in estimating conditional FDR compromises
the power to detect non-null associations and also to infer the properties of the non-null distribution.
Moreover, this approach can only integrate a small number of GWAS traits. In contrast, graph-GPA can
integrate large number of GWAS traits using a hidden Markov random field framework and its usefulness
is demonstrated by integrating 12 traits (five psychiatric disorders, three autoimmune traits, two lipid-
related traits and two cardiovascular traits) where clinically related traits form closely connected clusters.
However, both methods fail to inform about functional relevance of risk-associated SNPs due to their
inability to integrate functional annotations in their application.
   The second category of methods integrate individual GWAS data with genotype-related functional
annotation data. Two cutting-edge approaches in this category include the latent sparse mixed model
(LSMM) approach [16] and the covariate modulated false discovery rate (cmFDR) approach [17]. In
LSMM, functional annotations are integrated using a logistic mixed effects model framework where
genic- and cell-type specific functional annotations are assumed to respectively have fixed and random
effects and a sparse structure is imposed on the random effects to adaptively select cell-type specific
functional annotations that may be relevant to a trait etiology. Through application of LSMM, Ming et al.
discovered substantial enrichment of blood-related cell-type specific annotations for autoimmune diseases
like systemic lupus erythematosus, rheumatoid arthritis, ulcerative colitis and Crohn’s disease. Similar

                                                      2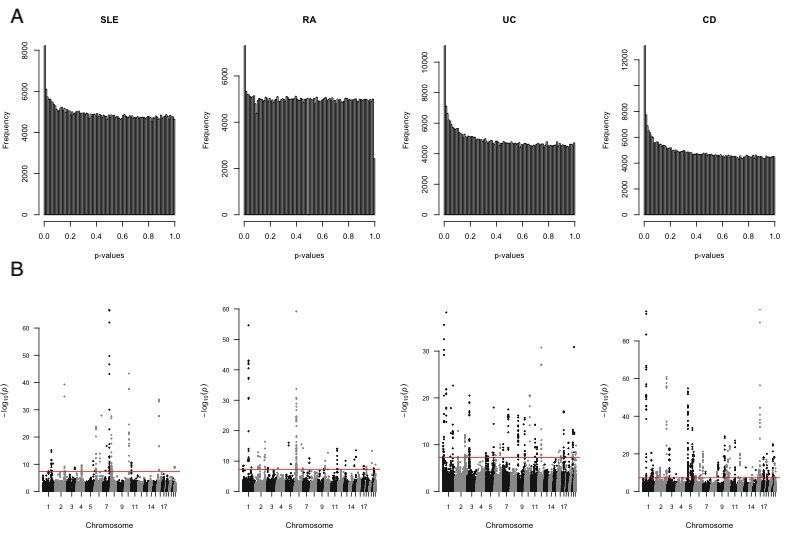
to LSMM, the cmFDR approach is a parametric method that integrates GWAS summary statistics and
functional annotation information where functional annotation information provide ‘prior information’ in
a parametric two-group mixture model. The cmFDR approach assumes that compared to SNPs that are
not functionally relevant, SNPs that are functionally relevant have a lower false discovery rate, and are
associated with the trait. However, both cmFDR and LSMM do not exploit the pleiotropic relationship
between traits with similar etiology to improve power to detect associations.
   Finally, the third category of statistical methods combine the first two category criteria and inte-
grate multiple GWAS trait data together with genotype-related functional annotation data. Two well
known methods in this category include the genetic analysis incorporating pleiotropy and annotation
(GPA) approach [19] and the more recent latent probit model (LPM) approach [20]. GPA employs a
unified statistical framework to integrate genetically correlated GWAS traits by leveraging pleiotropy
and functional annotation data to perform joint analysis of multiple traits. Similar to GPA, the three
main goals of LPM are to identify the pleiotropic relationship between multiple traits by estimating the
correlation between the traits, to identify the effect of functional annotations, and to improve the power
to identify risk-associated SNPs for one or more traits. In both methods, the number of parameters that
are included in the model increases significantly as the number of GWAS traits and functional annota-
tions increase, rendering their implementation statistically and computationally challenging. Moreover,
although methods in the second and third category can perform enrichment analysis on individual anno-
tations, these methods do not consider interactions between the annotations, and therefore are limited
in informing about the combined functional pathways through which genetic variants are associated with
one or more traits. While some of these methods can theoretically be extended to include interactions
between functional annotations to evaluate the combined functional effect of annotations, they retain the
burden of knowing a priori the interactions that are of interest. Therefore, a method that can perform
variable selection to identify relevant functional annotations or combinations of functional annotations
from a large group of annotations that are linked to genetic variants associated with one or more traits
is vitally important.
   To address the statistical challenges and limitations described above, our team recently published a
novel statistical approach called GPA-Tree [21] that simultaneously performs association mapping and
identification of interactions between functional annotations. However, GPA-Tree does not exploit the
pleiotropic relationship between two or more traits to improve association mapping power. In this work,
we address the limitations of the GPA-Tree approach by proposing a new approach called multi-GPA-
Tree. The multi-GPA-Tree approach is a novel statistical method based on a hierarchical modeling
architecture, integrated with a multivariate regression tree algorithm [22]. It exploits the pleiotropic
relationship between traits with similar etiology to prioritize one or more trait-associated SNPs while
simultaneously identifying key combinations of functional annotations related to the mechanisms through
which one or more trait-associated SNPs influence the trait/s. Our comprehensive simulation studies
and real data applications show that multi-GPA-Tree consistently improves statistical power to detect
one or more trait-associated SNPs and also effectively identifies biologically important combinations of
functional annotations. The multi-GPA-Tree approach takes GWAS summary statistics for multiple traits
and functional annotation information for the GWAS genetic variants as input, and can be implemented
using the R package ‘multiGPATree’.

                                                    3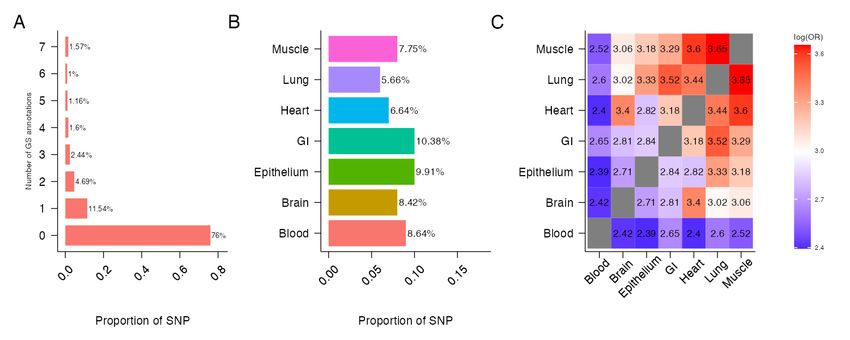
Materials and methods
Overview of the multi-GPA-Tree approach
Let YM ×D be a matrix of genotype-trait association p-values for i = 1, 2, · · · , M SNPs and d =
1, 2, · · · , D traits where Yid denotes the p-value for the association of the ith SNP with the dth trait.
y11 ... y1D
. .. ..
Y = (Y.1 , . . . , Y.D ) = ..
. .
yM 1 ... yM D
M ×D
We also assume K binary annotations (A) for each SNP.
a11 ... a1K
. .. ..
A = (A.1 , . . . , A.K ) = ..
. .
, where
aM 1 ... aM K
M ×K
0, if ith SNP is not annotated in the kth annotation
aik =
1, if ith SNP is annotated in the kth annotation
To improve the power to identify risk-associated SNPs for one or more traits, GWAS association p-
values for D traits (Y) are integrated with functional annotations data (A). The impact of functional
annotations in modeling the relationship between GWAS traits and SNPs is characterized by defining a
matrix ZM ×2D ∈ {0, 1} of latent binary variables where Zi is a vector of length 2D and indicates whether
the ith SNP is null or non-null for the D traits. Here, we present the model for the case of two GWAS
traits (D = 2) to simplify notations.
Let Y ∈ RM ×2 be the matrix of GWAS association p-values for two traits where Yi1 and Yi2 are the
p-values for the association between the ith SNP and traits 1 and 2, respectively. The latent binary vector
is defined as Zi = {Zi00 , Zi10 , Zi01 , Zi11 } for the ith SNP, where Zi00 = 1 indicates the ith SNP is null for
both traits, Zi10 = 1 indicates the ith SNP is non-null for trait 1 and null for trait 2, Zi01 = 1 indicates
the ith SNP is null for trait 1 and non-null for trait 2 and Zi11 = 1 indicates the ith SNP is non-null for
P
both traits. We assume that a SNP can only be in one of the four states such that Zil = 1.
l∈{00,10,01,11}
The densities for SNPs in the null and non-null groups for both traits are assumed to come from U [0, 1]
and Beta(αd , 1) distributions, where 0 < αd < 1 and d = 1, 2, as proposed in Chung et al.[19]. The
distributions are defined as shown below.
Yi1 |Zi00 = 1 ∼ U [0, 1] Yi2 |Zi00 = 0 ∼ U [0, 1]
Yi1 |Zi10 = 1 ∼ Beta(α1 , 1) Yi2 |Zi10 = 1 ∼ U [0, 1]
Yi1 |Zi01 = 1 ∼ U [0, 1] Yi2 |Zi01 = 1 ∼ Beta(α2 , 1)
Yi1 |Zi11 = 1 ∼ Beta(α1 , 1) Yi2 |Zi11 = 1 ∼ Beta(α2 , 1),
where 0 < α1 , α2 < 1. Finally, the functional annotation data A is integrated with the GWAS summary
statistics data Y by defining a function f that is a combination of functional annotations A and relating
it to the multivariate expectation of latent Z as given in Eq 1.
P (Zil = 1; ai1 , . . . , aiK ) = f(ai1 , . . . , aiK ), where l ∈ {00, 10, 01, 11} (1)
For notational convenience we let θ = (α1 , α2 ) and denote P (Zil = 1; ai1 , . . . , aiK ) as π.l , where
4l ∈ {00, 10, 01, 11} such that π .00 are the prior probabilities that the SNPs are null for both traits, π .10
are the prior probabilities that the SNPs are non-null for trait 1 and null for trait 2, π .01 are the prior
probabilities that the SNPs are null for trait 1 and non-null for trait 2, and π .11 are the prior probabilities
that the SNPs are non-null for both traits. Then assuming that the SNPs are independent, the joint
distribution of the observed data P r(Y, A) and the incomplete and complete data log-likelihood can be
written as shown in Eqs 2, 3 and 4, respectively.
M
Q P
P r(Y, A) = P (Zil = 1)P (Yi1 , Yi2 |Zil = 1)
i=1 l∈{00,10,01,11}
M
(2)
Q P
= πil P (Yi1 , Yi2 |Zil = 1)
i=1 l∈{00,10,01,11}
M
P P
`IC = log πil P (Yi1 , Yi2 |Zil = 1) (3)
i=1 l∈{00,10,01,11}
M
P P
`C = Zil log πil P (Yi1 , Yi2 |Zil = 1) (4)
i=1 l∈{00,10,01,11}
Algorithm
Given the approach described above, parameter estimation is implemented using an Expectation-Maximization
(EM) algorithm [23]. The function f in Eq 1 is estimated by using a multivariate regression tree
algorithm[22] that can identify combinations of functional annotations related to risk-associated SNPs
for specific and multiple traits. The described approach is computationally implemented in two stages
based on simulation study findings that showed improved parameter estimation and model stability when
using a two-stage approach. Specifically, in Stage 1, we first estimate the parameters α1 and α2 without
identifying a combination of functional annotations. Then, in Stage 2, we identify key combinations of
functional annotations (f (A)) while the parameters α1 and α2 are kept fixed as the value obtained in
Stage 1. Detailed calculation steps are illustrated below.
(0) (0) 1
Stage 1: In Stage 1, we initialize αd = 0.1, d = 1, 2 and πil = 2D
, D = 2 (the number of traits). In the
(t)
tth iteration of the E-step, define Zil , l ∈ {00, 10, 01, 11} for the ith SNP as:
(t)
E − step : zil = P (Zil = 1|Y, A; θ (t−1) )
(t−1)
πil P (Yi1 ,Yi2 |Zil =1; θ (t−1) ) (5)
= (t−1)
P (Yi1 ,Yi2 |Zil0 =1; θ (t−1) )
P
π 0
il
l0 ∈{00,10,01,11}
In the tth iteration of the M-step, π i. , α1 and α2 are updated as:
M − step : Fit a multivariate linear regression model as
(t) (t) (t) (t)
Zi. = β0 + β1 ai1 + · · · + βK aiK + i (t)
Update π i. as the predicted value from the multivariate linear
regression model.
M
P (t) (t) M
P (t) (t)
(zi10 + zi11 ) (zi01 + zi11 )
(t) i=1 (t) i=1
Update α1 = − M
and α2 = − M
P (t) (t) P (t) (t)
(zi10 + zi11 )(logYi1 ) (zi01 + zi11 )(logYi2 )
i=1 i=1
(t) (t)
where βk , k = 0, · · · , K are the regression coefficients and i is the error term. The E and M steps are
repeated until the incomplete log-likelihood and the α1 and α2 estimates converge. Then, α1 , α2 and
π i. estimated in this stage are used to fix α1 , α2 and initialize π i. , respectively, in Stage 2.
Stage 2: In stage 2, we implement another EM algorithm employing the multivariate regression tree
algorithm, which allows for identification of union, intersection, and complement relationships between
5(t)
functional annotations in estimating π i. . In the tth iteration of the E-step, define Zil , l ∈ {00, 10, 01, 11}
th
for the i SNP as shown in Eq 5, except α1 and α2 are fixed as αˆ1 and αˆ2 , which are the final estimates
of α1 and α2 obtained from Stage 1.
(t)
E − step : Define Zil , l ∈ {00, 10, 01, 11} as in Eq 5, except α1 and α2 are
fixed as αˆ1 and αˆ2 , the final estimates of α1 and α2 from Stage 1.
In the tth iteration of the M-step, π i. is updated as:
M − step : Fit a multivariate regression tree model as shown below.
(t) (t)
Zi. = f (t) (ai1 , · · · , aiK ) + i , where i is the error term.
(t)
(6)
Update π i. as the predicted values from the multivariate regression
tree model.
In the M-step, the complexity parameter (cp) of the multivariate regression tree is the key tuning parame-
ter and defined as the minimum improvement that is required at each node of the tree. Specifically, in the
multivariate regression tree model, the largest possible tree (i.e., a full-sized tree) is first constructed and
then pruned using cp. This approach allows for the construction of the accurate yet interpretable multi-
variate regression tree that can explain relationships between functional annotations and risk-associated
SNPs for one or more traits. The E and M steps are repeated until the incomplete log-likelihood con-
verges. The pruned tree structure identified by the multivariate regression tree model upon convergence
of the Stage 2 EM is the f in Eq 1.
We note that unlike the standard EM algorithm, the incomplete log-likelihood in Stage 2 is not
guaranteed to be monotonically increasing. Therefore, we implement Stage 2 as a generalized EM
algorithm by retaining only the iterations in which the incomplete log-likelihood increases compared to
the previous iteration.
Prioritization of marginal and joint risk-associated SNPs and identifica-
tion of relevant functional annotations
Following parameter estimation, we can prioritize one or more trait risk associated SNPs using local false
discovery rate or f dr. As shown in Eq 7, for marginal associations with a specific trait, we define f dr
as the marginal posterior probability that the ith SNP belongs to the non-risk-associated group for the
specific trait given its GWAS association p-values for all traits and functional annotation information.
Likewise, for joint associations between traits, we define f dr as the joint posterior probability that the ith
SNP belongs to the non-risk-associated group for the traits given its GWAS association p-values for all
traits and functional annotation information. Next, we utilize the ‘direct posterior probability’ approach
[24] to control the global false discovery rate (FDR).
P (Yi1 ,Yi2 ,Zi00 +Zi01 =1; θ̂)
f dr1 (Yi. , Ai. ) = P (Zi00 + Zi01 = 1|Yi. , Ai. , θ̂) = P (Yi1 ,Yi2 ; θ̂)
,
P (Yi1 ,Yi2 ,Zi00 +Zi10 =1; θ̂)
f dr2 (Yi. , Ai. ) = P (Zi00 + Zi10 = 1|Yi. , Ai. , θ̂) = P (Yi1 ,Yi2 ; θ̂)
,
P (Yi1 ,Yi2 ,Zi00 +Zi10 +Zi01 =1; θ̂)
f dr1,2 (Yi. , Ai. ) = P (Zi00 + Zi10 + Zi01 = 1|Yi. , Ai. ) = P (Yi1 ,Yi2 ; θ̂)
,
where
P
P (Yi1 , Yi2 ; θ̂) = π̂il P (Yi1 , Yi2 |Zil , Ai. ; θ̂), (7)
l∈{00,10,01,11}
P
P (Yi1 , Yi2 , Zi00 + Zi01 = 1; θ̂) = π̂il P (Yi1 , Yi2 |Zil , Ai. ; θ̂),
l∈{00,01}
P
P (Yi1 , Yi2 , Zi00 + Zi10 = 1; θ̂) = π̂il P (Yi1 , Yi2 |Zil , Ai. ; θ̂),
l∈{00,10}
P
P (Yi1 , Yi2 , Zi00 + Zi10 + Zi01 = 1; θ̂) = π̂il P (Yi1 , Yi2 |Zil , Ai. ; θ̂),
l∈{00,10,01}
6Finally, relevant combinations of functional annotations are inferred based on the combination of
functional annotations selected by the multivariate regression tree model upon convergence of the Stage
2 EM algorithm.
Results
Simulation study
Figure 1: Simulation setting. The graphical scenario is presented for M = 10, 000 SNPs; K = 25
annotations; % of annotated SNPs in A1 -A6 (u) = 10%; % of overlap between A1 -A2 , A3 -A4 , A5 -A6 (v)=
50%; A7 –A15 are noise SNPs, approximately 20% of which are randomly annotated; blue SNPs are non-null
for trait P1 and their GWAS p-values are generated from Beta(α1 = 0.4, 1) distribution; orange SNPs are
non-null for trait P2 and their GWAS p-values are generated from Beta(α2 = 0.4, 1) distribution; all other
SNPs are null for both traits and their GWAS p-values are generated from U [0, 1] distribution for both traits.
We conducted a simulation study to evaluate the performance of the proposed multi-GPA-Tree ap-
proach. Fig 1 provides a graphical depiction of the simulation setting. For all simulation data, the
number of SNPs was set to M = 10, 000, the number of annotations was set to K = 25, SNPs that are
marginally associated with the first trait (P1 ) were assumed to be characterized with the combinations
of functional annotations defined by L1 = A1 ∩ A2 , SNPs that are marginally associated with the second
trait (P2 ) were assumed to be characterized with the combinations of functional annotations defined by
L2 = A3 ∩ A4 , SNPs that are jointly associated with traits P1 and P2 were assumed to be characterized
with the combinations of functional annotations defined by L3 = A5 ∩ A6 , all the remaining functional
7annotations (Ak , k = 7, . . . , 25) were considered to be noise annotations. Approximately 10% of SNPs
were assumed to be annotated for annotations A1 − A6 , and v% where v = 35%, 50% and 75% of those
annotated were assumed to overlap between the true combinations of functional annotations. For noise
annotations A7 − A25 , approximately 20% of SNPs were annotated by first generating the proportion
of annotated SNPs from U nif [0.1, 0.3] and then randomly setting this proportion of SNPs to one. For
trait P1 , the SNPs that satisfied the functional annotation combination in L1 or L3 were assumed to be
risk-associated SNPs and their p-values were simulated from Beta(α1 , 1) with α1 = 0.4. Similarly, for
trait P2 , the SNPs that satisfied the functional annotation combination in L2 or L3 were assumed to be
risk-associated SNPs and their p-values were simulated from Beta(α2 , 1) with α2 = 0.3. The SNPs that
did not satisfy the required condition for association with P1 or P2 were assumed to be non-risk SNPs
and their p-values were simulated from U [0, 1].
We simulated 50 datasets and compared the performance of multi-GPA-Tree with LPM [20] using
the simulation parameters defined above. The metrics for comparing the methods included (1) area
under the curve (AUC) for marginal and joint associations, where the curve was created by plotting
the true positive rate (sensitivity) against the false positive rate (1-specificity) to detect one or more
trait risk-associated SNPs when global FDR was controlled at various levels; (2) statistical power to
identify marginal and joint risk-associated SNPs when local FDR (lf dr) was controlled at the nominal
level of 0.20; (3) predicted lf dr when lf dr was controlled at the nominal level of 0.20; and (4) estimation
accuracy for αd parameters in the Beta(αd , 1), d = 1, 2 distribution used to generate the p-values of risk-
associated groups for traits P1 and P2 . For multi-GPA-Tree, we also examined the accuracy of detecting
the correct functional annotation tree based on (1) the proportion of simulation data for which all relevant
functional annotations in L1 , L2 and L3 , i.e, annotation A1 − A6 , were identified simultaneously; (2)
the average proportion of noise functional annotations (A7 − A25 ) among the functional annotations
identified by multi-GPA-Tree; and (3) the average proportion of true functional annotations (A1 − A6 )
among the functional annotations identified by multi-GPA-Tree. Here we especially investigated how
the the overlap between SNPs annotated in A1 − A2 , A3 − A4 and A5 − A6 (v) impacted multi-GPA-
Tree’s ability to separate relevant functional annotations from noise annotations for one or more trait
risk-associated SNPs.
• AUC: Fig 2A compares the distribution of AUCs returned by multi-GPA-Tree and LPM. For all
v, multi-GPA-Tree showed consistently higher AUC relative to LPM for both marginal and joint
association. LPM showed higher AUC for marginal associations relative to joint association.
• Statistical power: Fig 2B compares the distribution of power to detect true marginal and joint
risk-associated SNPs when local FDR (lf dr) was controlled at 0.20 between multi-GPA-Tree and
LPM. The multi-GPA-Tree approach showed higher statistical power to detect true marginal and
joint risk-associated SNPs relative to LPM for all v. LPM showed higher power for marginal asso-
ciations relative to joint association. LPM showed greater variability in statistical power compared
to multi-GPA-Tree overall while multi-GPA-Tree showed more variability in power for higher v.
• Predicted local fdr (lfdr): Fig 2C compares the distribution of predicted lf dr between multi-
GPA-Tree and LPM when lf dr was controlled at the nominal level of 0.20. Although LPM showed
higher perdicted lf dr compared to multi-GPA-Tree, both multi-GPA-Tree and LPM showed con-
sistently controlled lf dr under 0.20 at the 0.20 level for all v.
• Estimation of α parameters: Fig 2D shows the distribution of α parameter estimates for traits 1
and 2 (P1 and P2) using multi-GPA-Tree and LPM. LPM was on average more accurate than multi-
GPA-Tree in estimating α for both traits. The multi-GPA-Tree approach generally overestimated α
and this was most notable for smaller v. As v increased, α estimates from multi-GPA-Tree became
closer to the true value. We note that overestimation of α by multi-GPA-Tree did not impact the
8Figure 2: Simulation results. Comparison of (A) AUC, (B) statistical power to detect true marginal and
joint risk-associated SNPs when local FDR (lf dr) is controlled at the nominal level of 0.20, (C) predicted
local FDR (lf dr) when controlled at the nominal level of 0.20, and (D) estimated α1 and α2 parameter for
traits P1 and P2 between multi-GPA-Tree and LPM; and (E) proportion of simulated data for which only
true annotations (A1 −A6 ) are simultaneously selected (red line), the average proportion of noise annotations
(A7 − A25 ) among the functional annotations identified by multi-GPA-Tree (green line), and the average
proportion of true annotations A1 − A6 among the annotations identified by multi-GPA-Tree (blue line). We
note that the blue and red lines are overlaid in the plot. The results are presented for different proportions of
the overlap between SNPs annotated in A1 − A2 , A3 − A4 and A5 − A6 (v; x-axis). M = 10, 000, K = 25, and
αd = 0.4 in Beta(αd , 1), d = 1, 2. Results are summarized from 50 replications. Results related to marginal
associations are presented using suffix * P1 and * P2 and results related to joint associations are presented
using suffix * P1 P2.
method’s ability to identify the true combinations of functional annotations or the marginal and
joint risk-associated SNPs, which are the main objectives of multi-GPA-Tree.
• Selection of relevant and noise annotations: The red line in Fig 2E shows the proportion of
times only functional annotations in the true combination L1 , L2 and L3 (A1 − A6 ) were simulta-
neously identified by multi-GPA-Tree. The red line aligned exactly with the blue line which shows
the mean proportion of true annotations (A1 − A6 ) among all selected annotations. Finally, the
green line shows the proportion of noise annotations (A7 − A25 ) among the selected annotation.
The alignment of the red and blue lines and the horizontal green line at 0 suggest that only and all
relevant annotations were selected by multi-GPA-Tree. These results demonstrate the potential of
9multi-GPA-Tree to correctly identify true annotations from noise annotations.
Real data application
We obtained a combined dataset including the SLE [30] and RA [31], and CD and UC [32] GWAS.
Summary statistics in the SLE and RA GWAS was profiled for 18, 264 (6, 748 cases and 11, 516 controls)
and 58, 284 (14, 361 cases and 43, 923 controls) individuals of European ancestry, respectively. Summary
statistics in the CD and UC GWAS was profiled from 8, 467 (4, 686 cases and 3, 781 controls) individuals
of European ancestry. Following quality control and exclusion of SNPs in the MHC region, approximately
492, 557 SNPs were utilized in the final analysis and integrated with functional annotation data from
GenoSkyline (GS) [33] and GenoSkylinePlus (GSP) [34]. The Manhattan plots and p-value histogram
plots for the four GWAS data are presented in Fig 3A and 3B, respectively.
Figure 3: GWAS summary statistic plots. (A) GWAS p-value histogram and (B) Manhattan plots for
the four GWAS. Genome-wide significance level (−log10 (5 × 10⁻⁸ )) is indicated by the red line.
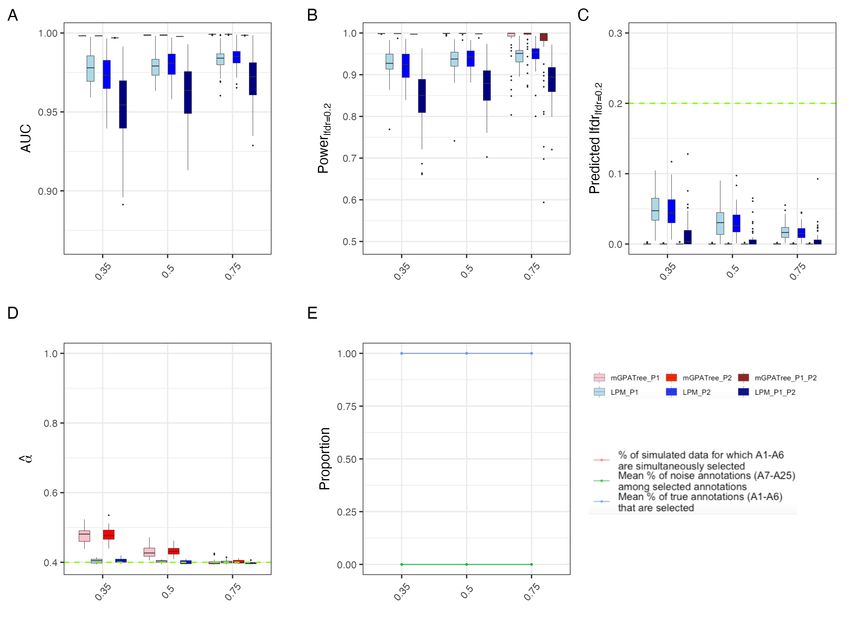
We descriptively investigated the functional potential of the 492, 557 SNPs using seven tissue-specific
GS annotations (Fig 4) and ten blood-related cell-type specific GSP annotations (Fig 5). With a GS and
GSP score cutoff of 0.5, 24% of SNPs were annotated in at least one of the seven tissue types (Fig 4A) and
15.4% of SNPs were annotated in at least one of the 10 blood related cell-type specific annotations (Fig
5A). The percentage of annotated SNPs ranged from 5.66% for lung tissue to 10.38% for GI tissue (Fig
4B) and from 3.43% for primary T CD8+ memory cells to 6.99% for primary T regulatory cells (Figure
5B). We also measured the overlap in SNPs annotated in different tissue-types and cell-types using log
odds ratio (Fig 4C and 5C). Consistent with the literature stipulating that muscle and lung tissues
10show higher levels of eQTL sharing while blood shows the lowest [18, 33], our findings show that SNPs
annotated for muscle, lung and heart tissues overlap more with other tissue types while SNPs annotated
for blood tissue overlap less (Fig 4C). Finally, we observed the different types of T cells (Primary helper
memory, helper naive, effector/memory enriched, regulatory, CD8+ naive and CD8+ memory T cells)
overlap more with each other while neutrophils, primary B and natural killer cells overlap less (Fig 5C).
Figure 4: Characteristics of 492, 557 SNPs when integrated with seven GenoSkyline (GS) annotations. (A)
Number of GS tissues in which SNPs are annotated. (B) Proportion of SNPs that are annotated for each
GS tissue type. (C) Overlap of SNPs annotated by seven GS tissue types, calculated using log odds ratio.
Figure 5: Characteristics of 492, 557 SNPs when integrated with 10 blood related GenoSkylinePlus (GSP)
annotations. (A) Number of GSP tissues in which SNPs are annotated. (B) Proportion of SNPs that are
annotated for each blood related GSP annotations. (C) Overlap of SNPs annotated by 10 blood related GPS
annotations, calculated using log odds ratio.
11Integration of Systemic Lupus Erythematosus (SLE) and Rheumatoid Arthritis (RA)
GWAS
Tissue-level investigation using GenoSkyline (GS) annotations
We applied the multi-GPA-Tree approach to the SLE and RA GWAS and tissue-specific GS annotations
to identify SNPs that are marginally and jointly associated with SLE and RA, and to characterize the
functional annotations relevant to single and multiple trait risk-associated SNPs. At the nominal global
FDR level of 0.05, multi-GPA-Tree identified 394 SNPs that are jointly associated with both SLE and
RA, 1087 SNPs that are marginally associated with SLE and 791 SNPs that are marginally associated
with RA (Table 1).
Figure 6: Real data application results. Trees returned by multi-GPA-Tree models when (A) SLE
(P1), RA (P2) and GenoSkyline annotations are integrated, (B) SLE (P1), RA (P2) and GenoSkylinePlus
annotations are integrated, (C) UC (P1), CD (P2) and GenoSkyline annotations are integrated, and (D) UC
(P1), CD (P2) and GenoSkylinePlus annotations are integrated.
In the joint analysis of SLE and RA with tissue-specific GS annotations, the original multi-GPA-Tree
model identified blood tissue at the root node and included 2 leaves (Fig. 6A). Further investigation
showed that 156 SNPs that were jointly associated with both SLE and RA, 336 SNPs that were marginally
associated with SLE and 306 SNPs that were marginally associated with RA were also annotated for
blood tissue. Of the 156 jointly associated SNPs that were also annotated for blood tissue, 118 SNPs
were protein-coding such that chromosomes 1, 6, 2 and 17 had the most number of protein-coding SNPs.
The PLCL1 gene in chromosome 2, IL2RA gene in chromosome 10 and UHRF1BP1 gene in chromosome
6 had the most number of protein-coding SNPs with 5 SNPs related to coding the PLCL1 gene and 4
12Data integra- Approach # # # jointly as- Selected annotation
tion marginally marginally sociated with
associated associated P1 and P2
with P1 with P2 (SLE+RA/
(SLE/UC) (RA/CD) UC+CD)
SLE+RA+GS multi-GPA-Tree 1087 791 394 Blood
SLE+GS GPA-Tree 696 - - Blood
RA+GS GPA-Tree - 470 - Blood
SLE+RA+GSP multi-GPA-Tree 1065 760 383 Regulatory T
SLE+GSP GPA-Tree 830 - - Primary B
Regulatory T
Helper memory T
RA+GSP GPA-Tree - 634 - Regulatory T
Helper memory T
Natural killer
UC+CD+GS multi-GPA-Tree 5430 5041 5041 Blood
UC+GS GPA-Tree 1566 - - Blood
CD+GS GPA-Tree - 3185 - Blood
UC+CD+GSP multi-GPA-Tree 4995 4912 4576 Natural killer
UC+GSP GPA-Tree 1654 - - Natural killer
Monocytes
Effector/Memory
enriched T
Regulatory T
CD+GSP GPA-Tree - 3232 - Natural killer
Monocytes
Effector/Memory
enriched T
Primary B
Regulatory T
Table 1: Real data application results summary. Number of jointly and marginally associated SNPs
when systemic lupus erythematosus (SLE) and rheumatoid arthritis (RA), and Crohn’s disease (CD) and
ulcertive colitis (UC) GWAS are integrated with the GenoSkyline (GS) and GenoSkylinePlus (GSP) an-
notations when jointly and individually analyzed using the multi-GPA-Tree and the GPA-Tree approach.
All analysis included 492, 557 SNPs and 7 tissue-specific GS and 10 blood-related cell-type specific GSP
annotations. Inference is based on global FDR control at the nominal level of 0.05.
SNPs each related to coding the IL2RA and UHRF1BP1 genes. The PLCL1 gene is known to promote
inflammatory response by regulating the NLRP3 inflammasomes, a component of the immune system
related to activation and secretion of proinflammatory cytokines [35]. Similarly, IL2RA gene expression
has been reported on activated T and B cells, regulatory T cells, activated monocytes, and natural killer
cells [36, 37], and the UHRF1BP1 gene plays a role in non-conservative amino-acid change and is related
to RNA processing complex that is targeted by SLE autoantibodies [38].
We also discovered 3 SNPs each in chromosomes 4, 17, 3, 3, and 16 known to code the BANK1, PGAP3,
PLCL2, RASA2, and TXNDC11 genes, respectively. BANK1 is primarily expressed in CD19+ B cells
and is a known SLE and RA susceptibility gene [39, 40]; in animal studies, the PGAP3 gene knockout has
been associated with reduced apoptotic cell clearance, a causal pathway for autoimmunity [41]; PLCL2
is known to encode a negative regulator of B cell receptor signalling important in controlling immune
responses and is a known susceptibility gene for RA [42]. Finally, although not explored in the context
of SLE and RA, RASA2 variants are known to be associated with combined allergy diseases [43] and
TXNDC11 is known to play a role in thyroid hormone biosynthesis [44].
13We additionally implemented the GPA-Tree approach by integrating the GS annotations to the SLE
and RA GWAS individually. Validating our multi-GPA-Tree results, blood tissue was identified at the
root node in the separate GPA-Tree analysis for both SLE and RA. In the individual GPA-Tree analysis,
we identified 696 SNPs to be associated with SLE and 470 SNPs to be associated with RA with 229 SLE
associated and 224 RA associated SNPs also annotated for blood tissue. Of the top 3 genes identified in
the joint analysis of SLE and RA, one or more protein-coding SNPs related to the IL2RA and PLCL1
genes were also identified in the single trait analysis of both SLE and RA. However, protein-coding SNPs
related UHRF1BP1 gene were identified for SLE but not for RA in single trait analysis.
Cell-type-level investigation using GenoSkylinePlus (GSP) annotations
Based on the observed relationship between GS annotation for blood tissue and SLE and RA, in the
second phase of the analysis, we applied the multi-GPA-Tree approach to the SLE and RA GWAS
and 10 blood related cell-type specific GSP annotations to identify SNPs that were marginally and
jointly associated with SLE and RA, and to characterize the blood related GSP functional annotations
relevant to single and multiple trait risk-associated SNPs. At the nominal global FDR level of 0.05,
multi-GPA-Tree identified 383 SNPs that were jointly associated with SLE and RA, 1, 065 SNPs that
were marginally associated with SLE and 760 SNPs that were marginally associated with RA (Table 1).
The joint analysis also identified primary T regulatory cells at the root node (Fig. 6B) with 95 SNPs
that were jointly associated with both SLE and RA, 191 SNPs that were marginally associated with
SLE and 176 SNPs that were marginally associated with RA also annotated for regulatory T cells. Of
the 95 jointly associated SNPs that were also annotated for regulatory T cells, 69 were protein coding
such that chromosomes 1, 6, 16 and 2 had the most number of protein-coding SNPs. The PLCL1 gene
in chromosome 2, IL2RA gene in chromosome 10 and TXNDC11 gene in chromosome 16 had the most
number of protein-coding SNPs with 3 different protein-coding SNPs related to coding each of the 3 genes.
The individual analysis using the GPA-Tree approach identified primary B, regulatory T and helper
memory T cells with primary B cell at the root node for SLE. Similarly, we identified regulatory T, helper
memory T and natural killer cells with regulatory T cells at the root node for RA. In the individual GPA-
Tree analysis, we identified 830 SNPs to be associated with SLE and 634 SNPs to be associated with RA.
Of those associated with SLE, 176 were annotated for primary B, 122 were annotated for regulatory T,
and 43 were annotated for helper memory T cells. Among SNPs associated with RA, 132 were annotated
for both regulatory T and natural killer cells, 148 were annotated for regulatory T and not for natural
killer cells, 32 were annotated for natural killer but not for regulatory T cells and 35 were annotated
for helper memory T cells. Among the top 3 genes identified in the joint analysis of SLE, RA and GSP
annotations, one or more protein-coding SNPs related to the IL2RA gene were also identified in the
single trait analysis of both SLE and RA. However, protein-coding SNPs related to the PLCL1 gene
were identified for SLE only while protein-coding SNPs related to the TXNDC11 gene were identified
for RA only.
Integration of Ulcerative Colitis (UC) and Crohn’s Disease (CD) GWAS
Tissue-level investigation using GenoSkyline (GS) annotations
We also applied the multi-GPA-Tree approach to the UC and CD GWAS and tissue-specific GS annota-
tions to identify SNPs that were marginally and jointly associated with UC and CD, and to characterize
the functional relevance of the single and multiple trait risk-associated SNPs. At the nominal global FDR
level of 0.05, multi-GPA-Tree identified 5, 041 SNPs that were jointly associated with both UC and CD,
145, 430 SNPs that were marginally associated with UC and 5, 041 SNPs that were marginally associated
with CD (Table 1). In this joint analysis, the original multi-GPA-Tree model identified blood tissue at
the root node and included 2 leaves (Fig. 6C). Further investigation showed that 1, 319 SNPs that were
jointly associated with both UC and CD, 1, 453 SNPs that were marginally associated with UC and
1, 319 SNPs that were marginally associated with CD were also annotated for blood tissue. Of the 1, 319
jointly associated and blood annotated SNPs, 990 were protein-coding. Chromosomes 1 and 2 had the
most number of protein-coding SNPs, followed by chromosomes 17 and 5. The THADA and ATG16L1
genes in chromosome 2, C5orf56 gene in chromosome 5 and IKZF3 gene in chromosome 17 had the
most number of protein-coding SNPs with 9 SNPs each related to coding the THADA and IKZF3 genes,
and 8 SNPs each related to coding the ATG16L1 and C5orf56 genes. Although not directly implicated
in the pathogenesis of UC or CD, the THADA gene is known to influence metabolic mechanisms like
adipogenesis [45]. In contrast, genetic variants of the ATG16L1 gene are some of the most studied in
the pathogenesis of Crohn’s disease, playing a role in pathogen clearance, cytokine production, protein
regulation and endoplasmic stress response control [46, 47]. Similarly, increased expression of IKZF3,
a transcription factor that plays an important role in the regulation of B lymphocyte proliferation and
differentiation, has been observed in patients with CD and UC [48, 49], and C5orf56 is known to influ-
ence the immune stimulus specific enhancer for IRF1, a gene established in the pathogenesis of Crohn’s
disease [50, 51, 52].
We also discovered 7 SNPs each in chromosomes 5, 6 and 9 known to code the FYB, BACH2 and
DOCK8 genes, and 6 SNPs each known to code the BANK1, LEF1, and NFKB1 genes in chromosome
4. The FYB gene is related to T cells signaling and plays a role in IL-2A expression, and is known to
be associated with some autoimmune regulation [53, 54]. Likewise, BACH2 is a critical gene for B cell
regulatory activity and T cell function and differentiation and is a known susceptibility locus for CD and
UC [55, 56]; DOCK8 is known to regulate diverse immune sub-types including lymphocytes and plays a
role in immune synapse formation and pathogen proliferation [57]; and NFKB1 is a known transcription
regulator of immune response, apoptosis and cell proliferation and is up-regulated in both UC and CD
patients [58]. On the contrary, although BANK1 is a B cell gene known to be associated with SLE and
RA [40, 39], only few studies linking specific BANK1 variants to CD has been published [59, 60] and it’s
role in the pathogenesis of both CD and UC remains understudied. This is also true for the LEF1 gene,
a known mediator in the Wnt signaling pathway [61].
In the individual trait analysis for UC and CD using the GPA-Tree approach, we identified blood,
GI and epithelium tissues for UC, and blood and epithelium tissues for CD with blood tissue at the root
node for both traits. GPA-Tree identified 1, 566 SNPs to be associated with UC and 3, 185 SNPs to be
associated with CD with 540 UC associated and 960 CD associated SNPs also annotated for blood tissue.
Among the top 4 genes identified in the joint analysis of UC, CD and GS annotations, one or more SNPs
related to the THADA, IKZF3 and C5orf56 genes were also identified in the single trait analysis of both
UC and CD. However, SNPs related to ATG16L1 gene were identified for CD only.
Cell-type-level investigation using GenoSkylinePlus (GSP) annotations
In the second phase of the analysis, we combined the UC and CD GWAS and 10 blood related cell-type
specific GSP annotations using the multi-GPA-Tree approach. At the nominal global FDR level of 0.05,
multi-GPA-Tree identified 4, 576 SNPs that were jointly associated with UC and CD, 4, 995 SNPs that
were marginally associated with UC and 4, 912 SNPs that were marginally associated with CD (Table
1). The original multi-GPA-Tree model fit identified primary natural killer cells at the root node and
included 2 leaves (Fig. 6D). Further investigation showed that 507 SNPs that were jointly associated
with both UC and CD, 579 SNPs that were marginally associated with UC and 554 SNPs that were
15marginally associated with CD were annotated for natural killer cells. Of the 507 jointly associated
and natural killer cells annotated SNPs, 360 were protein-coding. Chromosomes 1 and 2 had the most
number of protein-coding SNPs, followed by chromosomes 5 and 17. The C5orf56 and IRF1 genes
in chromosome 5 and FAM53B gene in chromosome 10 had the most number of protein-coding SNPs
with 8 SNPs related to coding the C5orf56 gene, 5 SNPs related to coding the IRF1 gene and 4 SNPs
related to coding the FAM53B gene. We also discovered 3 SNPs each known to code the ATG16L1
and THADA genes in chromosome 2, IKZF3 and PGAP3 genes in chromosome 17, DOCK8 gene in
chromosome 9, TSPAN14 gene in chromosome 10 and ETS1 gene in chromosome 11. FAM53B is known
to be associated with humoral immune reponse, regulation of immune effector process, and regulation
of lymphocyte activation [62]; reduced expression of PGAP3 is known to be related to impaired clear-
ance of apoptotic cells and has been observed in CD and UC patients [49]; TSPAN14 is expressed in
immune cell types participating in immunity and inflammation, and is positively correlated with mi-
crophages and neutrophils and negatively correlated with T cells CD8 [63]; and finally, ETS1 is known
to be over-expressed in intestinal epithelial cells of patients with UC [64], and has also been linked to
fistula formation, an epithelial defect caused by destructive inflammation, in the pathogenesis of CD [65].
The individual analysis using the GPA-Tree approach identified primary natural killer, monocytes,
effector/memory enriched T and regulatory T cells with natural killer cells at the root node for both UC
and CD. Additionally, primary B cells was also identified for CD. In the individual GPA-Tree analysis,
we identified 1, 654 SNPs to be associated with UC and 3, 232 SNPs to be associated with CD. Of those
associated with UC, 186 were annotated for both natural killer and effector/memory enriched T cells, 134
were annotated for natural killer cells but not for effector/memory enriched T cells, 112 were annotated
for monocytes and 127 were annotated for regulatory T cells. Similarly, of those associated with CD,
278 were annotated for both natural killer and effector/memory enriched T cells, 211 were annotated for
natural killer cells but not for effector/memory enriched T cells, 181 were annotated for monocytes, 161
were annotated for regulatory T and 132 were annotated for primary B cells. Among the top 3 genes
identified in the joint analysis of UC, CD and GSP annotations, one or more protein-coding SNPs related
to the C5orf56, IRF1 and FAM53B genes were also identified in the single trait analysis of both UC and
CD.
Discussion
Over the past 20 years, several GWAS have been conducted, leading to successful identification of over
two hundred thousand trait risk-associated genetic variants [1]. The advancement in complexity of
newer statistical approaches to exploit the richness in GWAS data even further has been helpful in
identifying many previously unknown genetic variants and it is expected that newer discoveries are
forthcoming. Current findings have been crucial in identifying treatment therapies and for new drug
discoveries [66, 67, 68]. Yet, a crucial gap that needs to be filled with new variant discovery is in our
understanding of the functional mechanisms and pathways through which genetic variants influence traits.
It is well known that complex traits are often caused by an amalgamation of functional mechanisms that
can be described by multiple functional annotations [69, 70]. Therefore, identifying the combinations of
functional annotations that are associated with the traits can provide valuable insight into trait etiology.
However, to the best of our knowledge, we are currently lacking statistical methodologies that identify the
combinations of functional annotations that act in unison to influence traits. We propose the discussed
multi-GPA-Tree approach to fill in this gap.
In comparison to existing methods, the overall strength of the multi-GPA-Tree approach is that it
can automatically select the combinations of functional annotations from a group of annotations without
16excessively increasing the complexity of the model and be used to benefit our understanding of the
functional mechanisms related to a single or multiple traits. The multi-GPA-Tree approach achieves that
goal by following a hierarchical architecture that combines an iterative procedure (EM algorithm) and
a multivariate decision tree algorithm. During simulation study, the multi-GPA-Tree approach showed
consistently better performance than the LPM approach in terms of AUC, statistical power and type-I
error control in identifying trait risk-associated variants for single and multiple traits and also distinctly
identified relevant annotations from noise annotations with great accuracy (Fig 2).
In real data application, multi-GPA-Tree showed increased efficiency in identifying risk-associated
SNPs for both traits when two traits are jointly analyzed and validated some annotational findings already
established in literature (Table 1, Fig 6). We compared the real data application findings from multi-
GPA-Tree to findings from our recently published method ‘GPA-Tree’ [21], a statistical approach that
does not exploit the pleiotropic relationship between traits and prioritizes variants that are marginally
associated with a single trait. Our comparison demonstrated that multi-GPA-Tree consistently identified
more marginally risk-associated variants for both traits when the traits are analyzed jointly. Evidently,
while GPA-Tree identified more annotations to be relevant with a specific trait, multi-GPA-Tree identified
annotations that are largely common between the two jointly analyzed traits. For instance, blood tissue
was identified in both joint and individual analysis of SLE and RA, and UC and CD. Similarly, regulatory
T cells was identified as a relevant annotation when SLE and RA were jointly analyzed which was also
a common annotation identified when SLE and RA are individually analyzed. Likewise, natural killer
cells was identified as a relevant annotation when UC and CD were jointly analyzed, again a common
annotation also identified for both UC and CD when individually analyzed. Overall, these results are
consistent with previous literature indicating connections between autoimmune diseases like SLE, RA,
UC and CD and blood tissue [71, 72, 73], and SLE and RA and regulatory T cells [74, 75, 76, 77, 78], and
UC and CD and natural killer cells [79, 80, 81, 82]. Moreover, in addition to identifying a few candidate
genes (RASA2, TXNDC11, THADA) for SLE, RA, UC and CD that have previously been linked to
other allergy, thyroid or metabolic traits, we also validated previous findings linking the PLCL1, IL2RA
and UHRF1BP1 genes to SLE and RA [83, 84, 85, 87, 86, 38, 88, 89], and the ATG16L1, C5orf56 and
IKZF3 genes to UC and CD [90, 91, 92, 50, 93, 51, 49, 94].
From the statistical modeling perspective, several assumptions are made in multi-GPA-Tree. First,
we assume that the genetic variants are conditionally independent given its functional information which
greatly simplifies our model and leads to efficient computation of the parameter estimates. Although this
assumption omits the linkage disequilibrium (LD) structure present between SNPs in the same genomic
region, it still allows us to conservatively infer risk-associated variants by modestly controlling the type-I
error rate by potentially also identifying SNPs that are in LD with each other to be risk-associated.
Second, we assume that signal in the GWAS association p-values are related to the functional potential
of a SNP, so some functional signal should be present in the GWAS and annotation data for the multi-
GPA-Tree approach to work efficiently. Simulation results suggest that at least 10% of variants should
be functionally annotated for at least one feature to achieve valid parameter estimates and controlled
type-I error at the nominal level.
Here we have presented a novel statistical approach, named multi-GPA-Tree, that can exploit pleiotropic
relationship between multiple GWAS data and integrate GWAS data and tissue and cell-type specific
functional annotation data in an efficient manner. Compared to some existing approaches which require
genotype data at the individual level and annotation data that follows certain distributional assumption,
multi-GPA-Tree only requires summary statistics for GWAS data and binary annotation data for anal-
ysis. These features make multi-GPA-Tree an attractive and effective tool for the integrative analysis
of GWAS data with functional annotation data. Despite the promising statistical improvements made
by multi-GPA-Tree, the biological implications need to be independently replicated and newly identified
17variants need to be independently validated. Two limitations of multi-GPA-Tree are that it cannot han-
dle continuous or count annotation data and scaling multi-GPA-Tree to more than two traits can still
be computationally challenging. Addressing issues related to integrating multiple GWAS and multiple
types of annotation data are important areas of our future work.
Acknowledgments
We thank Dr. Paula S. Ramos, Dr. Andrew Lawson and Dr. Kelly J. Hunt from the Medical University of
South Carolina and Dr. Hang J. Kim from the University of Cincinnati for useful discussion related to the
topic, and for their guidance and support in completing this work. This work has been supported through
grant support from the National Institute of General Medical Sciences (R01 GM122078), National In-
stitute on Drug Abuse (U01 DA045300), National Human Genome Research Institute (R21 HG012482),
National Institute on Aging (U54 AG075931), and the Pelotonia Institute of Immuno-Oncology (PIIO).
The content is solely the responsibility of the authors and does not necessarily represent the official views
of the funders.
Conflict of Interest
None declared.
References
[1] Buniello A, MacArthur JA, Cerezo M, Harris LW, Hayhurst J, Malangone C, McMahon A, Morales
J, Mountjoy E, Sollis E, Suveges D. The NHGRI-EBI GWAS Catalog of published genome-wide
association studies, targeted arrays and summary statistics 2019. Nucleic acids research. 2019 Jan
8;47(D1):D1005-12.
[2] Manolio TA, Collins FS, Cox NJ, Goldstein DB, Hindorff LA, Hunter DJ, McCarthy MI, Ramos
EM, Cardon LR, Chakravarti A, Cho JH. Finding the missing heritability of complex diseases.
Nature. 2009 Oct;461(7265):747-53.
[3] Lee SH, Wray NR, Goddard ME, Visscher PM. Estimating missing heritability for disease from
genome-wide association studies. The American Journal of Human Genetics. 2011 Mar 11;88(3):294-
305.
[4] Maher B. Personal genomes: The case of the missing heritability. Nature. 2008 Nov 6;456(7218):18-
22.
[5] Nikpay M, Goel A, Won HH, Hall LM, Willenborg C, Kanoni S, Saleheen D, Kyriakou T, Nelson
CP, Hopewell JC, Webb TR. A comprehensive 1000 Genomes-based genome-wide association meta-
analysis of coronary artery disease. Nature Genetics. 2015;47(10):1121.
[6] Price AL, Spencer CC, Donnelly P. Progress and promise in understanding the genetic ba-
sis of common diseases. Proceedings of the Royal Society B: Biological Sciences. 2015 Dec
22;282(1821):20151684.
[7] Kundaje A, Meuleman W, Ernst J, Bilenky M, Yen A, Heravi-Moussavi A, Kheradpour P, Zhang
Z, Wang J, Ziller MJ, Amin V. Integrative analysis of 111 reference human epigenomes. Nature.
2015 Feb;518(7539):317-30.
[8] Andreassen OA, Djurovic S, Thompson WK, Schork AJ, Kendler KS, O’Donovan MC, Rujescu
D, Werge T, van de Bunt M, Morris AP, McCarthy MI. Improved detection of common variants
18You can also read