NEANDERTAL INTROGRESSION SHEDS LIGHT ON MODERN HUMAN ENDOCRANIAL GLOBULARITY - MPG.PURE
←
→
Page content transcription
If your browser does not render page correctly, please read the page content below
Report

Neandertal Introgression Sheds Light on Modern
Human Endocranial Globularity
Highlights                                                                  Authors
d   We use fossil skull data to derive an index of endocranial              Philipp Gunz, Amanda K. Tilot,
    shape in human MRI scans                                                Katharina Wittfeld, ..., Fabio Macciardi,
                                                                            Hans J. Grabe, Simon E. Fisher
d   In 4,468 Europeans, we screen introgressed Neandertal SNPs
    for association with the index                                          Correspondence
d   Lead SNPs consistently associate with reduced globularity in            gunz@eva.mpg.de (P.G.),
                                                                            simon.fisher@mpi.nl (S.E.F.)
    five separate subsamples

d   These SNPs affect neural expression of two genes linked to              In Brief
    neurogenesis and myelination                                            Gunz, Tilot et al. combine
                                                                            paleoanthropology, archaic genomics,
                                                                            neuroimaging, and gene expression to
                                                                            study biological foundations of the
                                                                            characteristic modern human
                                                                            endocranial shape. They find
                                                                            introgressed Neandertal alleles that
                                                                            associate with reduced endocranial
                                                                            globularity and affect expression of
                                                                            genes linked to neurogenesis and
                                                                            myelination.

           Gunz et al., 2019, Current Biology 29, 120–127
           January 7, 2019 ª 2018 The Authors. Published by Elsevier Ltd.
           https://doi.org/10.1016/j.cub.2018.10.065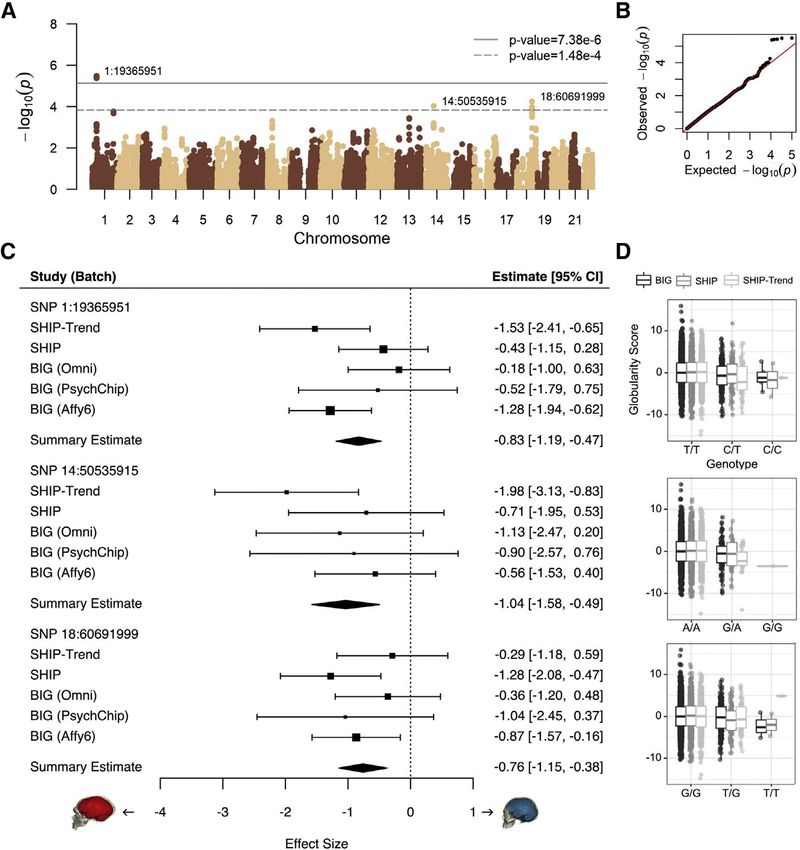
Current Biology

                                                                                                                 Report

Neandertal Introgression Sheds Light
on Modern Human Endocranial Globularity
Philipp Gunz,1,20,* Amanda K. Tilot,2,20 Katharina Wittfeld,3,4 Alexander Teumer,5 Chin Yang Shapland,2
Theo G.M. van Erp,6 Michael Dannemann,7 Benjamin Vernot,7 Simon Neubauer,1 Tulio Guadalupe,2 Guille      n Fernández,8
Han G. Brunner,  9,10 Wolfgang Enard, James Fallon, Norbert Hosten, Uwe Völker, Antonio Profico,15
                                      11               12                 13            14

Fabio Di Vincenzo,15,16 Giorgio Manzi,15 Janet Kelso,7 Beate St. Pourcain,2,17 Jean-Jacques Hublin,1 Barbara Franke,17,18
Svante Pa€a€bo,7 Fabio Macciardi,19 Hans J. Grabe,3 and Simon E. Fisher2,17,21,*
1Department      of Human Evolution, Max Planck Institute for Evolutionary Anthropology, Deutscher Platz 6, 04103 Leipzig, Germany
2Language     and Genetics Department, Max Planck Institute for Psycholinguistics, P.O. Box 310, 6500 AH, Nijmegen, the Netherlands
3Department of Psychiatry and Psychotherapy, University of Greifswald, Ellernholzstr. 1-2, 17489 Greifswald, Germany
4German Center for Neurodegenerative Diseases (DZNE), Partner Site Rostock/Greifswald, Ellernholzstr. 1-2, 17489 Greifswald, Germany
5Institute for Community Medicine, University Medicine Greifswald, Walter-Rathenau Str. 48, 17475 Greifswald, Germany
6Clinical and Translational Neuroscience Laboratory, Department of Psychiatry and Human Behavior, University of California, Irvine,

5251 California Ave, Irvine, CA 92617, USA
7Department of Evolutionary Genetics, Max Planck Institute for Evolutionary Anthropology, Deutscher Platz 6, 04103 Leipzig, Germany
8Department of Cognitive Neuroscience, Radboud University Medical Center, Donders Institute for Brain, Cognition and Behaviour, 6500 GA,

Nijmegen, the Netherlands
9Department of Human Genetics, Radboud University Medical Center, Donders Institute for Brain, Cognition and Behaviour, 6500 GA,

Nijmegen, the Netherlands
10Department of Clinical Genetics and School for Oncology & Developmental Biology (GROW), Maastricht University Medical Center,

6202 AZ, Maastricht, the Netherlands
11Anthropology and Human Genomics, Department Biology II, Ludwig Maximilians University Munich, Grosshaderner Str. 2,

D-82152 Martinsried, Germany
12Department of Anatomy and Neurobiology, University of California, Irvine, Irvine, CA 92697, USA
13Institute of Diagnostic Radiology and Neuroradiology, University Medicine, Ernst-Moritz-Arndt-University Greifswald,

Ferdinand-Sauerbruch-Str. 1, 17475 Greifswald, Germany
14Interfaculty Institute of Genetics and Functional Genomics, Ernst-Moritz-Arndt-University Greifswald, Felix-Hausdorff-Str. 8,

17475 Greifswald, Germany
15Università degli Studi di Roma La Sapienza, Department of Environmental Biology, Piazzale Aldo Moro, 5, 00185, Roma, Italy
16Istituto Italiano di Paleontologia Umana, Via Ulisse Aldrovandi, 18, 00197, Roma, Italy
17Donders Institute for Brain, Cognition and Behaviour, Radboud University, P.O. Box 9101, 6500 HB, Nijmegen, the Netherlands
18Departments of Human Genetics and Psychiatry, Radboud University Medical Center, Nijmegen, the Netherlands
19Department of Psychiatry and Human Behavior, University of California, Irvine, Sprague Hall - Room 312,

Gillespie Neuroscience - Laboratory, Mail Code: 3960, Irvine, CA 92697, USA
20These authors contributed equally
21Lead Contact

*Correspondence: gunz@eva.mpg.de (P.G.), simon.fisher@mpi.nl (S.E.F.)
https://doi.org/10.1016/j.cub.2018.10.065

SUMMARY                                                              structural MRI scans of thousands of modern hu-
                                                                     mans and study the effects of introgressed frag-
One of the features that distinguishes modern hu-                    ments of Neandertal DNA on this phenotype. We
mans from our extinct relatives and ancestors is a                   find that Neandertal alleles on chromosomes 1 and
globular shape of the braincase [1–4]. As the endo-                  18 are associated with reduced endocranial globu-
cranium closely mirrors the outer shape of the brain,                larity. These alleles influence expression of two
these differences might reflect altered neural archi-                nearby genes, UBR4 and PHLPP1, which are
tecture [4, 5]. However, in the absence of fossil brain              involved in neurogenesis and myelination, respec-
tissue, the underlying neuroanatomical changes as                    tively. Our findings show how integration of fossil
well as their genetic bases remain elusive. To better                skull data with archaic genomics and neuroimaging
understand the biological foundations of modern hu-                  can suggest developmental mechanisms that may
man endocranial shape, we turn to our closest                        contribute to the unique modern human endocranial
extinct relatives: the Neandertals. Interbreeding be-                shape.
tween modern humans and Neandertals has resulted
in introgressed fragments of Neandertal DNA in the                   RESULTS AND DISCUSSION
genomes of present-day non-Africans [6, 7]. Based
on shape analyses of fossil skull endocasts, we                      Neandertals (Figure 1A) and modern humans (Figure 1B) have
derive a measure of endocranial globularity from                     similar endocranial volumes but distinct endocranial shapes.

120 Current Biology 29, 120–127, January 7, 2019 ª 2018 The Authors. Published by Elsevier Ltd.
This is an open access article under the CC BY-NC-ND license (http://creativecommons.org/licenses/by-nc-nd/4.0/).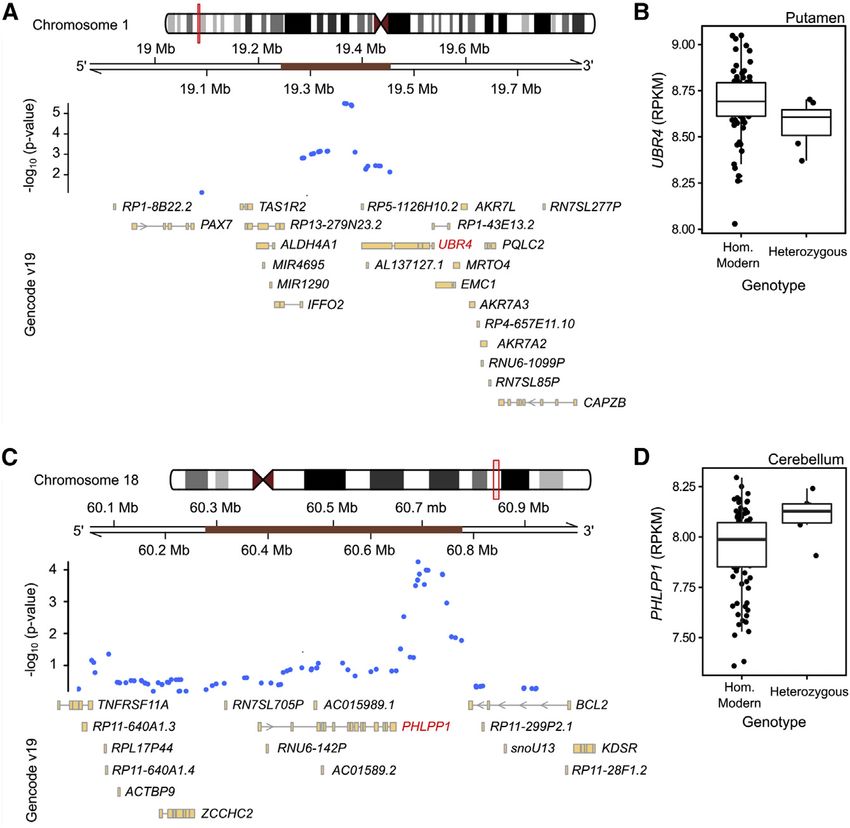
Figure 1. Endocranial Shape Differences
                                                                                            between Neandertals and Modern Humans
                                                                                            (A) CT scan of the Neandertal fossil from La
                                                                                            Chapelle-aux-Saints with a typical elongated en-
                                                                                            docranial imprint (red).
                                                                                            (B) CT scan of a modern human showing the
                                                                                            characteristic globular endocranial shape (blue).
                                                                                            Arrows highlight the enlarged posterior cranial
                                                                                            fossa (housing the cerebellum) as well as bulging of
                                                                                            parietal bones in modern humans compared to
                                                                                            Neandertals.
                                                                                            (C) Average endocranial shape of adult Neander-
                                                                                            tals; each vertex of the surface corresponds to a
                                                                                            semilandmark.
                                                                                            (D) Average endocranial shape of modern humans.
                                                                                            Areas shaded in green are relatively larger in
                                                                                            modern humans than in Neandertals.
                                                                                            (E and F) The semilandmarks used to quantify
                                                                                            overall endocranial shape from MRI scans of living
                                                                                            people shown on the MNI 152 template in lateral
                                                                                            and frontal views, respectively.

                                                                                           look modern, their elongated braincases
                                                                                           appear more like older human species
                                                                                           and Neandertals [4, 10]. Together with
                                                                                           crania from South Africa and Ethiopia,
                                                                                           these fossils document an early evolu-
                                                                                           tionary phase of Homo sapiens on the
                                                                                           African continent [10, 11]. The globular
                                                                                           endocranial shape emerged gradually in
                                                                                           the Homo sapiens lineage, evolving inde-
                                                                                           pendently of brain size: reorganization of
                                                                                           cerebellar and lateral parietotemporal
                                                                                           areas was followed by continued gradual
                                                                                           changes in the organization of cerebellar
                                                                                           and occipital areas [4]. From the perspec-
                                                                                           tive of ontogeny, braincase shape de-
                                                                                           pends on a complex interplay between
                                                                                           cranial bone growth, facial size, and the
                                                                                           tempo and mode of neurodevelopment
                                                                                           [1, 4, 12–14]. In present-day humans,
                                                                                           globularity emerges during perinatal
Modern humans have a globular-shaped braincase, with a round         development [12, 13] in a period when the rapidly expanding
and expanded posterior cranial fossa housing the cerebellum,         brain is the main driver of braincase shape. It has therefore
and more bulging parietal bones [2–4]. Contrasting the average       been proposed that endocranial globularity reflects evolutionary
endocranial shapes of modern humans and Neandertals, Ko-             changes in early brain development [4, 12]. However, endocra-
chiyama et al. [5] proposed that the biggest differences between     nial imprints only capture outer brain shape and cannot pro-
these groups are found in the cerebellum. Comparative analyses       vide direct information about underlying features of neural
suggest rapid evolutionary changes of this brain structure in        reorganization.
great apes and humans [8, 9]. Our analysis of endocranial shape
based on data from [4] demonstrates that other regions beyond        Study Design and Hypothesis
the cerebellum are relatively larger in modern humans than in Ne-    In this study, we combine paleoanthropological data from Nean-
andertals, including parts of the prefrontal cortex and the occip-   dertal fossils with neuroimaging and genomic data from thou-
ital and temporal lobes (Figures 1C and 1D). In contrast, parietal   sands of present-day humans, as well as gene expression
bulging [2–4] is not linked to an increased surface area, suggest-   data, to interrogate the molecular basis of endocranial globular-
ing that the parietal lobe is ‘‘displaced’’ by reorganization of     ity. As overall endocranial shape is a complex trait, we expect
other—presumably subcortical—parts of the brain.                     that it is influenced by many genetic loci, each with only a small
   The evolutionary history of our species can currently be traced   effect. We therefore use both phenotypic and genetic differ-
back to fossils from Jebel Irhoud (Morocco) dated to about           ences between modern humans and Neandertals as filters to
300,000 years ago [4, 10, 11]. While their faces and teeth           constrain our search space. Analyses of the genomes of

                                                                                    Current Biology 29, 120–127, January 7, 2019 121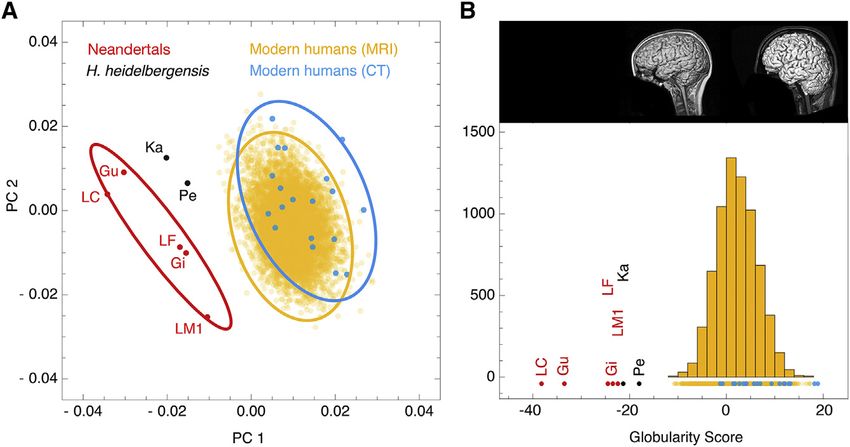
Figure 2. Globularity Scores of CT and MRI
Scans
(A) Principal component analysis of endocranial
shape. 99% confidence ellipses are shown for
modern human CT scans from Europe (blue;
n = 19), MRI scans of present-day humans (yellow;
n = 6,575), and Neandertal CT scans (red; n = 7);
two Homo heidelbergensis individuals are plotted
in black.
(B) Frequency plot of globularity scores computed
for data shown in (A). This globularity score quan-
tifies overall endocranial shape by projecting each
individual onto the vector between the elongated
average shape of Neandertals and the globular
average shape of present-day humans. Inset
shows example MRI scans associated with low
(left) and high (right) globularity scores among
present-day humans.
See also Figure S1.
Neandertals and modern humans show that they encountered Voxel-Based Morphometry
each other outside Africa and interbred [6, 15, 16]. Introgressed We explored potential underlying structural contributions to
fragments of Neandertal DNA can be reliably identified in modern interindividual variation in the globularity phenotype in healthy
humans and are estimated to account for 1%–2% of the ge- present-day humans using voxel-based morphometry (VBM) of
nomes of non-African individuals, such that collectively 40% MRI scans in two large European cohorts from Germany (SHIP
of the Neandertal genome is represented in people living today and SHIP-Trend, total n = 2,929). These analyses revealed mul-
[17–19]. Here, we quantify the endocranial shape differences be- tiple significant (p(peak,FWE) % 0.025) clusters where globular-
tween Neandertals and modern humans and study how Nean- ity was positively or negatively associated with interindividual
dertal introgressed fragments affect this phenotype. variability in gray matter (GM). In both hemispheres, greater
values of globularity were associated with higher GM volumes
Metric for Endocranial Globularity in temporal regions, vermis and adjacent parts of the cerebellum,
Using computed tomographic (CT) scans of fossil and extant and in subcortical structures including the hippocampus, thal-
skulls, we generated virtual imprints of the interior braincase amus, amygdala, caudate, and putamen (Figure S2; Table S1).
(endocasts) and quantified endocranial shape differences be- A significant inverse relationship of globularity and GM (Table
tween modern humans from Europe (n = 19) and Neandertals S2) was detected in large parts of the frontal, temporal, and oc-
(n = 7) based on a dense mesh of semilandmarks (Figures 1C cipital gyri; parts of the cerebellum; and several subcortical re-
and 1D). We placed the same mesh on the endocranial surface gions (thalamus, putamen, hippocampus).
segmented manually from the MNI-152 template—an average
of 152 registered structural MRI scans of living humans (Fig- Effect of Introgressed Neandertal Alleles
ures 1E and 1F). A principal component analysis of endocra- To investigate molecular correlates of the fossil-based globular-
nial shape shows that there is no overlap between the more ity score, we used genotype data from European individuals to
globular endocrania of modern humans and the more elon- identify introgressed Neandertal alleles [18, 20] and studied their
gated endocrania of Neandertals (Figure 2A). We therefore association with variability in this phenotype. We analyzed five
used these distinctive group differences to develop a summary datasets comprising 4,468 individuals with European ancestry
metric for endocranial globularity. This ‘‘globularity score’’ for whom both MRI and genotype data were available: three
quantifies overall endocranial shape by projecting the endo- batches of the Dutch BIG cohort (total n = 2,433) and the geno-
cranial measurements of each individual onto the vector typed subsets of the German SHIP (n = 1,139) and SHIP-Trend
between the average shape of Neandertals and that of pre- (n = 896) cohorts, mentioned above. We analyzed each of
sent-day humans (Figure 2B). By applying this morphometric 50,057 archaic SNPs with a minor allele frequency (MAF) of at
approach to structural MRI scans of thousands of healthy least 0.01, testing the hypothesis that Neandertal-introgressed
human adults (n = 6,575) from the general population (predom- fragments would promote elongation of endocranial shape in
inantly of European origin), we obtained an evolutionarily modern humans (controlling for age, sex, ancestry, and scanning
derived quantitative index of globularity, which we showed parameters). These SNPs cover 42% of the known, high-confi-
with repeat scans to be robust and reliable. We replicated dence Neandertal haplotypes [20] (Figures 3A and 3B). Although
the findings shown in Figure 2 in a more diverse endocranial the cohorts were all European, we used multidimensional scaling
dataset, building on data from [4] (Figure S1). As the sample (MDS) to exclude outlier individuals and, for extra rigor, ac-
composition differs from the one shown in Figure 2, the values counted for residual effects of population stratification using
of the derived globularity scores also differ—the overall principal components (PCs). Prior to association analysis, we
pattern, however, remains highly consistent. Endocranial designated significance thresholds that appropriately account
shapes extracted from CT and MRI scans largely overlap in for the extent of multiple testing, based on the linkage disequilib-
both analyses (Figures 2, S1B, and S1C). rium structure within the set of Neandertal alleles being tested
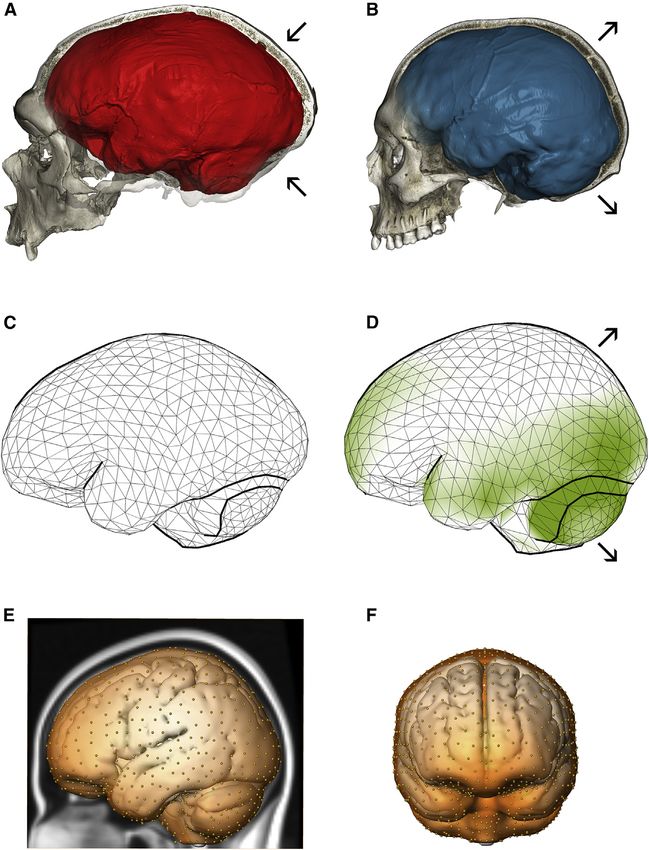
122 Current Biology 29, 120–127, January 7, 2019Figure 3. Endocranial Globularity in Modern
Humans Is Associated with Introgressed
Neandertal Haplotypes
(A) Association statistics for introgressed Nean-
dertal SNPs (solid line, significance, adjusted
for multiple testing; dashed line, suggestive
significance).
(B) Quantile-quantile plot of association p values,
showing the expected uniform distribution, with
the outliers representing significant associations.
(C) Forest plots depict the effects of the top
Neandertal SNPs, for each study and genotyping
batch. Boxes are proportional to weight, with
whiskers representing the 95% confidence inter-
val; diamonds represent a linear mixed-effect
model incorporating all five datasets.
(D) Covariate-corrected globularity scores by ge-
notype. All data points are shown; boxes represent
25th and 75th percentiles; whiskers represent 1.5
times the interquartile range.
ped below the threshold (p = 0.00019).
The MAFs for the top SNPs were low
in all three European cohorts, and
very few individuals were homozygous
for the Neandertal alleles (1:19365951,
MAF = 0.0436, 8 homozygotes;
18:60691999, MAF = 0.052, 6 homozy-
gotes; 14:50535915, MAF = 0.0204, 1 ho-
mozygote; Figure 3D). As expected for a
genetically complex neuroanatomical
phenotype [22], effect sizes of individual
SNPs were small (Figure 3C) but detect-
(6,778 independent tests, estimated using the Genetic Type 1 able here due to inclusion of cohorts comprising thousands of
error calculator [21]). Thus, our multiple-testing corrected individuals.
thresholds were p < 7.38 3 10 6 for significant association and A recent study explored Neandertal DNA variants and brain
p < 1.48 3 10 4 for suggestive association, following standard shape in a substantially smaller sample of present-day humans
guidelines of the field. [23]. The authors looked for associations between features of
Five SNPs within a 200 kilobase (kb) archaic haplotype on brain shape and a composite score reflecting the overall per-
chromosome 1 spanning 1:19244479–19453365 passed the sig- centage of Neandertal DNA that a person carries. However,
nificance threshold (top SNP 1:19365951, p = 3.26 3 10 6). because individual introgressed fragments are rare, two people
A second Neandertal haplotype on chromosome 18 (500 kb, can have the same total amount of Neandertal-derived DNA,
18:60279290–60776578) contains six SNPs that passed the sug- and thus an identical summary score, but share few (if any) Nean-
gestive significance threshold (top SNP 18:60691999, p = 5.66 3 dertal variants. Thus, it is difficult to draw biologically informative
10 5). A single SNP, representing a 170 kb haplotype on chro- conclusions from overall genomic percentages, limiting the inter-
mosome 14 (14:50535915, p = 9.29 3 10 5), also passed pretation of the prior study. In their analysis of only 146 people,
suggestive significance. All haplotypes showed consistent direc- the authors highlighted Neandertal SNPs in the GPR26 gene as
tions of effect across all five datasets from the three cohorts, with being of particular interest [23]; we assessed these markers in
the Neandertal-like haplotypes showing association with more our sample of 4,468 individuals but saw no association with vari-
oblong endocranial shape (Figure 3C) and with the top SNPs ability in endocranial globularity (all p > 0.05).
each showing an additive effect (i.e., heterozygous carriers
were intermediate in score between homozygous groups; Fig- Gene Expression
ure 3D). We checked the top SNP at each locus to further dis- The associated SNPs lie outside protein-coding regions, but
count residual effects of population stratification by increasing could potentially affect expression of nearby genes, in the brain
the number of PCs from 2 to 15. In this conservative follow-up and other tissues. We tested this hypothesis for the Neandertal
analysis, there was a slight attenuation of signals: the chromo- haplotypes tagged by the two top SNPs on chromosome 1
some-1 association remained significant (p = 6.94 3 10 6), and 18 using the GTEx database of expression quantitative trait
and the chromosome-18 association remained suggestive loci (eQTL) data from over 400 donors [24]. To increase our po-
(p = 9.54 3 10 5), but the isolated chromosome-14 SNP drop- wer to detect associations with Neandertal introgressed alleles,
Current Biology 29, 120–127, January 7, 2019 123Figure 4. Introgressed Neandertal Frag-
ments Associated with Globularity
(A and C) Detailed views of the kilobase
surrounding the Neandertal SNPs within the in-
trogressed haplotypes (brown bars) on chromo-
somes 1 (A) and 18 (C).
(B and D) Expression quantitative trait loci data
from the GTEx resource, showing the impact of
Neandertal alleles on gene expression for UBR4 (B)
and PHLPP1 (D), as defined by [24].
See also Figures S3 and S4.
PHLPP1 encodes a negative regulator
of the PI3K/Akt growth-factor signaling
pathway that drives myelination. Overex-
pression of Akt in transgenic mice leads
to hypermyelination compared to wild-
type controls [29]. With a high pLI score
(0.92), PHLPP1 is a tumor suppressor in
humans and mice [30, 31]. The PI3K/
AKT/mTOR signaling pathway broadly
promotes brain growth and development
of the myelin sheath [32–35]. In carriers of
the Neandertal allele, PHLPP1 expression
is slightly higher in the cerebellum, which
would be predicted to have dampening
effects on Akt-driven cerebellar myelina-
tion, consistent with the less globular en-
docranial shape associated with this
allele in our study. However, comparative
which tend to be at lower frequency in present-day genomes, we studies indicate that the increased endocranial globularity of
used a set of Neandertal eQTLs that were previously defined, present-day humans as compared to Neandertals is not merely
based on the top 5% of genes in each GTEx tissue showing as- the result of absolute cerebellar enlargement [4, 5], suggesting
sociation between gene expression and the presence of a that endocranial shape variation involves complex shifts in rela-
nearby introgressed archaic haplotype [25]. The Neandertal var- tive, rather than absolute, volumes of different brain structures.
iants that were associated with lower globularity scores showed This viewpoint is supported also by our VBM analyses of interin-
modest but consistent effects on the expression in brain tissues dividual differences in globularity, which found that such varia-
of nearby genes that regulate multiple aspects of brain growth. tion involves both positive and negative GM changes, distributed
Among the top 5% eQTL associations, we found that the chro- across various brain regions. In one of the cohorts that we stud-
mosome-1 SNP, 1:19365951 (rs28445963), which had the stron- ied here, more globular modern human endocrania have slightly
gest association with endocranial shape in our study, showed smaller absolute cerebellar volumes (Table S3), but this subtle
significant eQTLs in multiple tissues, including downregulation effect was not observed in the other cohorts. The VBM analyses
of UBR4 in the putamen (part of the basal ganglia) in carriers of suggest that, at least within present-day Europeans, higher en-
the Neandertal allele (Figures 4A and 4B; Spearman correlation docranial globularity is associated with increased GM in some
p = 0.031). The Neandertal allele of the most highly associated parts of the cerebellum but also with decreased GM in others
chromosome-18 SNP, 18:60691999 (rs72931809), was associ- (Figure S2; Tables S1 and S2).
ated with upregulation of PHLPP1 in the cerebellum (Figures
4C–4D, Spearman correlation p = 0.024). Additional eQTL asso- Conclusions
ciations of these SNPs in other tissues are shown in Figures S3 We have integrated evidence from paleoanthropology, compar-
and S4. ative genomics, neuroimaging, and gene expression to begin
UBR4 encodes a ubiquitin ligase that regulates neurogenesis identifying genes associated with variation in endocranial globu-
in the developing neocortex and promotes neuronal migration, larity, a defining feature of modern humans. The directions of ef-
among other roles [26]. Loss of the mouse ortholog (called fect were consistent in five separate batches of data from three
p600) in the developing brain impairs neurogenesis, resulting independent cohorts and consistent with our hypothesis that
in microcephaly [27]. In humans, UBR4 is intolerant to loss- Neandertal alleles would push the endocranium toward a more
of-function mutations (pLI score = 1.0), suggesting that elongated shape. The associated variants were connected to
even small expression changes may have functional conse- genes involved in neurogenesis and myelination pathways in pu-
quences [28]. tamen and cerebellum, respectively. The eQTL data suggest that
124 Current Biology 29, 120–127, January 7, 2019Neandertal alleles near UBR4 and PHLPP1 are linked to lower ACKNOWLEDGMENTS
levels of neural proliferation. We speculate that this may
BIG is part of Cognomics, supported by the Donders-Centre for Cognitive
contribute to altered neuroanatomical morphology of some
Neuroimaging, Departments of Human-Genetics and Cognitive Neuroscience
subcortical structures and the cerebellum and thereby to lower (Radboud University Medical Centre), MPI for Psycholinguistics. Additional
overall globularity. The Neandertal haplotypes may thus be asso- funding: BBMRI-NL, Hersenstichting-Nederland, Netherlands Organisation
ciated with developmental gene expression patterns that influ- for Scientific Research (NWO), FP7/2007–2013: 602450 (IMAGEMEND) and
ence endocranial globularity through effects on neurogenesis 602805 (Aggressotype), NIH-U54-EB020403. SHIP funded by BMBF Germany
and myelination during brain development. Functional impacts (01ZZ9603, 01ZZ0103, 01ZZ0403, 03IS2061A, 03ZIK012), Federal State, Min-
istry of Cultural Affairs & Social Ministry of Mecklenburg-West Pomerania,
of Neandertal alleles on neural properties and brain development
Siemens Healthineers. Thanks to InterSystems (Cache -Campus), German
can in future be empirically tested [36], for example by using
Research Foundation (GR-1912/5-1), Max Planck Society, Nomis Foundation
gene-editing techniques to insert changes into human induced (to S.P.), and NIH 1-U24-RR021992 and 1-U24-RR025736-01. Funding sour-
pluripotent stem cells, which can be differentiated into distinct ces had no role in study design, data collection, analysis, and interpretation.
types of neurons or organoids. We thank the anonymous referees for detailed and constructive feedback
Globularity is a multifactorial trait, involving combined influ- that helped improve the manuscript.
ences of many different loci, and the effects of individual SNPs
on overall endocranial shape are small. It is likely that future AUTHOR CONTRIBUTIONS
genome-wide studies in sufficiently large high-powered samples
Conceptualization, P.G., A.K.T., G.F., H.G.B., W.E., B.F., S.P., and S.E.F.;
will reveal additional relevant genes and associated pathways. Formal Analysis, P.G., A.K.T., K.W., A.T., C.Y.S., T.G.M.v.E., and M.D.; Visual-
The potential links between evolutionary changes in endocranial ization, P.G., A.K.T., and K.W.; Writing – Original Draft, P.G., A.K.T., and S.E.F.;
globularity and mechanisms affecting the basal ganglia and cer- Writing – Review & Editing, P.G., A.K.T., K.W., T.G.M.v.E., M.D., S.N., H.G.B.,
ebellum are nevertheless intriguing, because both brain struc- W.E., J.F., J.K., B.S.P., J.-J.H., B.F., S.P., F.M., H.J.G., and S.E.F.; Methodol-
tures receive direct input from the motor cortex and are involved ogy, P.G., C.Y.S., M.D., B.V., T.G., and B.S.P.; Data Curation, K.W.,
T.G.M.v.E., M.D., B.V., S.N., N.H., U.V., A.P., F.D.V., and G.M.; Resources,
in the preparation, learning, and sensorimotor coordination of
M.D., B.V., S.N., G.F., H.G.B., N.H., U.V., A.P., F.D.V., G.M., J.K., J.-J.H.,
movements. Expanded cerebellar interconnections with pre- B.F., S.P., F.M., H.J.G., and S.E.F.; Project Administration, F.M., H.J.G., and
frontal, premotor, and superior-posterior parietal cortices, which S.E.F.; Supervision, S.E.F.
also project densely to the putamen, may be particularly relevant
to cognitive abilities of modern humans [9, 37, 38]. In addition to DECLARATION OF INTERESTS
their involvement in sensorimotor coordination, the basal ganglia
also contribute to diverse cognitive functions in memory, atten- Authors declare no competing interests. B.F. received educational speaking
fees from Shire and Medice.
tion, planning, skill learning [39], and potentially to speech and
language evolution [40, 41].
Received: June 14, 2018
Revised: September 21, 2018
Accepted: October 31, 2018
STAR+METHODS
Published: December 13, 2018
Detailed methods are provided in the online version of this paper REFERENCES
and include the following:
1. Lieberman, D.E., McBratney, B.M., and Krovitz, G. (2002). The evolution
d KEY RESOURCES TABLE and development of cranial form in Homo sapiens. Proc. Natl. Acad. Sci.
d CONTACT FOR REAGENT AND RESOURCE SHARING USA 99, 1134–1139.
d EXPERIMENTAL MODEL AND SUBJECT DETAILS 2. Bruner, E., Manzi, G., and Arsuaga, J.L. (2003). Encephalization and allo-
B Participants metric trajectories in the genus Homo: evidence from the Neandertal and
d METHOD DETAILS modern lineages. Proc. Natl. Acad. Sci. USA 100, 15335–15340.
B Structural MRI 3. Bruner, E. (2004). Geometric morphometrics and paleoneurology: brain
B Computed tomography shape evolution in the genus Homo. J. Hum. Evol. 47, 279–303.
B Globularity score computation for MRI scans 4. Neubauer, S., Hublin, J.J., and Gunz, P. (2018). The evolution of modern
B Complementary shape analysis and globularity score human brain shape. Sci. Adv. 4, eaao5961.
B Characterization of the phenotype 5. Kochiyama, T., Ogihara, N., Tanabe, H.C., Kondo, O., Amano, H.,
Hasegawa, K., Suzuki, H., Ponce de León, M.S., Zollikofer, C.P.E.,
B Voxel-based morphometry analysis
Bastir, M., et al. (2018). Reconstructing the Neanderthal brain using
B Genotyping
computational anatomy. Sci. Rep. 8, 6296.
d QUANTIFICATION AND STATISTICAL ANALYSIS
6. Green, R.E., Krause, J., Briggs, A.W., Maricic, T., Stenzel, U., Kircher, M.,
B Statistical analyses Patterson, N., Li, H., Zhai, W., Fritz, M.H., et al. (2010). A draft sequence of
B GTEx eQTL Analysis the Neandertal genome. Science 328, 710–722.
d DATA AND SOFTWARE AVAILABILITY 7. Prüfer, K., de Filippo, C., Grote, S., Mafessoni, F., Korlevic, P., Hajdinjak, M.,
Vernot, B., Skov, L., Hsieh, P., Peyre gne, S., et al. (2017). A high-coverage
Neandertal genome from Vindija Cave in Croatia. Science 358, 655–658.
SUPPLEMENTAL INFORMATION
8. Barton, R.A. (2012). Embodied cognitive evolution and the cerebellum.
Supplemental Information includes four figures, three tables, and one data file Philos. Trans. R. Soc. Lond. B Biol. Sci. 367, 2097–2107.
and can be found with this article online at https://doi.org/10.1016/j.cub.2018. 9. Barton, R.A., and Venditti, C. (2014). Rapid evolution of the cerebellum in
10.065. humans and other great apes. Curr. Biol. 24, 2440–2444.
Current Biology 29, 120–127, January 7, 2019 12510. Hublin, J.J., Ben-Ncer, A., Bailey, S.E., Freidline, S.E., Neubauer, S., et al.; Exome Aggregation Consortium (2016). Analysis of protein-coding
Skinner, M.M., Bergmann, I., Le Cabec, A., Benazzi, S., Harvati, K., and genetic variation in 60,706 humans. Nature 536, 285–291.
Gunz, P. (2017). New fossils from Jebel Irhoud, Morocco and the pan- 29. Flores, A.I., Narayanan, S.P., Morse, E.N., Shick, H.E., Yin, X., Kidd, G.,
African origin of Homo sapiens. Nature 546, 289–292. Avila, R.L., Kirschner, D.A., and Macklin, W.B. (2008). Constitutively active
11. Scerri, E.M.L., Thomas, M.G., Manica, A., Gunz, P., Stock, J.T., Stringer, Akt induces enhanced myelination in the CNS. J. Neurosci. 28, 7174–
C., Grove, M., Groucutt, H.S., Timmermann, A., Rightmire, G.P., et al. 7183.
(2018). Did Our Species Evolve in Subdivided Populations across Africa, 30. Gao, T., Furnari, F., and Newton, A.C. (2005). PHLPP: a phosphatase that
and Why Does It Matter? Trends Ecol. Evol. 33, 582–594. directly dephosphorylates Akt, promotes apoptosis, and suppresses tu-
12. Gunz, P., Neubauer, S., Maureille, B., and Hublin, J.J. (2010). Brain devel- mor growth. Mol. Cell 18, 13–24.
opment after birth differs between Neanderthals and modern humans. 31. Brognard, J., Sierecki, E., Gao, T., and Newton, A.C. (2007). PHLPP and a
Curr. Biol. 20, R921–R922. second isoform, PHLPP2, differentially attenuate the amplitude of Akt
13. Neubauer, S., Gunz, P., and Hublin, J.J. (2010). Endocranial shape signaling by regulating distinct Akt isoforms. Mol. Cell 25, 917–931.
changes during growth in chimpanzees and humans: a morphometric
32. Franke, B., Stein, J.L., Ripke, S., Anttila, V., Hibar, D.P., van Hulzen, K.J.E.,
analysis of unique and shared aspects. J. Hum. Evol. 59, 555–566.
Arias-Vasquez, A., Smoller, J.W., Nichols, T.E., Neale, M.C., et al.;
14. Ponce de León, M.S., Bienvenu, T., Akazawa, T., and Zollikofer, C.P. Schizophrenia Working Group of the Psychiatric Genomics Consortium;
(2016). Brain development is similar in Neanderthals and modern humans. ENIGMA Consortium (2016). Genetic influences on schizophrenia and
Curr. Biol. 26, R665–R666. subcortical brain volumes: large-scale proof of concept. Nat. Neurosci.
15. Prüfer, K., Racimo, F., Patterson, N., Jay, F., Sankararaman, S., Sawyer, 19, 420–431.
S., Heinze, A., Renaud, G., Sudmant, P.H., de Filippo, C., et al. (2014). 33. Ryskalin, L., Lazzeri, G., Flaibani, M., Biagioni, F., Gambardella, S., Frati,
The complete genome sequence of a Neanderthal from the Altai A., and Fornai, F. (2017). mTOR-Dependent Cell Proliferation in the
Mountains. Nature 505, 43–49. Brain. BioMed Res. Int. 2017, 7082696.
16. Kuhlwilm, M., Gronau, I., Hubisz, M.J., de Filippo, C., Prado-Martinez, J., 34. Reijnders, M.R.F., Kousi, M., van Woerden, G.M., Klein, M., Bralten, J.,
Kircher, M., Fu, Q., Burbano, H.A., Lalueza-Fox, C., de la Rasilla, M., et al. Mancini, G.M.S., van Essen, T., Proietti-Onori, M., Smeets, E.E.J., van
(2016). Ancient gene flow from early modern humans into Eastern Gastel, M., et al. (2017). Variation in a range of mTOR-related genes asso-
Neanderthals. Nature 530, 429–433. ciates with intracranial volume and intellectual disability. Nat. Commun. 8,
17. Sankararaman, S., Mallick, S., Dannemann, M., Prüfer, K., Kelso, J., 1052.
€a
Pa €bo, S., Patterson, N., and Reich, D. (2014). The genomic landscape 35. Figlia, G., Gerber, D., and Suter, U. (2018). Myelination and mTOR. Glia 66,
of Neanderthal ancestry in present-day humans. Nature 507, 354–357. 693–707.
18. Vernot, B., and Akey, J.M. (2014). Resurrecting surviving Neandertal line- €a
36. Pa €bo, S. (2014). The human condition-a molecular approach. Cell 157,
ages from modern human genomes. Science 343, 1017–1021. 216–226.
19. Vernot, B., Tucci, S., Kelso, J., Schraiber, J.G., Wolf, A.B., Gittelman, R.M., 37. Fallon, J., Opole, I., and Potkin, S. (2003). The neuroanatomy of schizo-
Dannemann, M., Grote, S., McCoy, R.C., Norton, H., et al. (2016). phrenia: circuitry and neurotransmitter systems. Clin. Neurosci. Res. 3,
Excavating Neandertal and Denisovan DNA from the genomes of 77–107.
Melanesian individuals. Science 352, 235–239.
38. Ramnani, N. (2012). Frontal lobe and posterior parietal contributions to the
20. Simonti, C.N., Vernot, B., Bastarache, L., Bottinger, E., Carrell, D.S.,
cortico-cerebellar system. Cerebellum 11, 366–383.
Chisholm, R.L., Crosslin, D.R., Hebbring, S.J., Jarvik, G.P., Kullo, I.J.,
et al. (2016). The phenotypic legacy of admixture between modern hu- 39. Middleton, F.A., and Strick, P.L. (2000). Basal ganglia and cerebellar
mans and Neandertals. Science 351, 737–741. loops: motor and cognitive circuits. Brain Res. Brain Res. Rev. 31,
236–250.
21. Li, M.X., Yeung, J.M., Cherny, S.S., and Sham, P.C. (2012). Evaluating the
effective numbers of independent tests and significant p-value thresholds 40. Enard, W. (2011). FOXP2 and the role of cortico-basal ganglia circuits in
in commercial genotyping arrays and public imputation reference data- speech and language evolution. Curr. Opin. Neurobiol. 21, 415–424.
sets. Hum. Genet. 131, 747–756. 41. Fisher, S.E. (2017). Evolution of language: Lessons from the genome.
22. Hibar, D.P., Stein, J.L., Renteria, M.E., Arias-Vasquez, A., Desrivières, S., Psychon. Bull. Rev. 24, 34–40.
Jahanshad, N., Toro, R., Wittfeld, K., Abramovic, L., Andersson, M., et al.; 42. Guadalupe, T., Zwiers, M.P., Teumer, A., Wittfeld, K., Vasquez, A.A.,
Alzheimer’s Disease Neuroimaging Initiative; CHARGE Consortium; Hoogman, M., Hagoort, P., Fernandez, G., Buitelaar, J., Hegenscheid,
EPIGEN; IMAGEN; SYS (2015). Common genetic variants influence human K., et al. (2014). Measurement and genetics of human subcortical and hip-
subcortical brain structures. Nature 520, 224–229. pocampal asymmetries in large datasets. Hum. Brain Mapp. 35, 3277–
23. Gregory, M.D., Kippenhan, J.S., Eisenberg, D.P., Kohn, P.D., Dickinson, 3289.
D., Mattay, V.S., Chen, Q., Weinberger, D.R., Saad, Z.S., and Berman, 43. Hibar, D.P., Adams, H.H.H., Jahanshad, N., Chauhan, G., Stein, J.L.,
K.F. (2017). Neanderthal-Derived Genetic Variation Shapes Modern Hofer, E., Renteria, M.E., Bis, J.C., Arias-Vasquez, A., Ikram, M.K., et al.
Human Cranium and Brain. Sci. Rep. 7, 6308. (2017). Novel genetic loci associated with hippocampal volume. Nat.
24. GTEx Consortium (2017). Genetic effects on gene expression across hu- Commun. 8, 13624.
man tissues. Nature 550, 204–213. 44. Völzke, H., Alte, D., Schmidt, C.O., Radke, D., Lorbeer, R., Friedrich, N.,
25. Dannemann, M., Prüfer, K., and Kelso, J. (2017). Functional implications of Aumann, N., Lau, K., Piontek, M., Born, G., et al. (2011). Cohort profile:
Neandertal introgression in modern humans. Genome Biol. 18, 61. the study of health in Pomerania. Int. J. Epidemiol. 40, 294–307.
26. Parsons, K., Nakatani, Y., and Nguyen, M.D. (2015). p600/UBR4 in the 45. Ashburner, J., and Friston, K.J. (2000). Voxel-based morphometry–the
central nervous system. Cell. Mol. Life Sci. 72, 1149–1160. methods. Neuroimage 11, 805–821.
27. Belzil, C., Asada, N., Ishiguro, K., Nakaya, T., Parsons, K., Pendolino, V., 46. van Erp, T.G., Greve, D.N., Rasmussen, J., Turner, J., Calhoun, V.D.,
Neumayer, G., Mapelli, M., Nakatani, Y., Sanada, K., and Nguyen, M.D. Young, S., Mueller, B., Brown, G.G., McCarthy, G., Glover, G.H., et al.
(2014). p600 regulates spindle orientation in apical neural progenitors (2014). A multi-scanner study of subcortical brain volume abnormalities
and contributes to neurogenesis in the developing neocortex. Biol. Open in schizophrenia. Psychiatry Res. 222, 10–16.
3, 475–485. 47. Gunz, P., Mitteroecker, P., Neubauer, S., Weber, G.W., and Bookstein,
28. Lek, M., Karczewski, K.J., Minikel, E.V., Samocha, K.E., Banks, E., F.L. (2009). Principles for the virtual reconstruction of hominin crania.
Fennell, T., O’Donnell-Luria, A.H., Ware, J.S., Hill, A.J., Cummings, B.B., J. Hum. Evol. 57, 48–62.
126 Current Biology 29, 120–127, January 7, 201948. Mitteroecker, P., and Gunz, P. (2009). Advances in Geometric 53. Purcell, S., Neale, B., Todd-Brown, K., Thomas, L., Ferreira, M.A., Bender,
Morphometrics. Evol. Biol. 36, 235–247. D., Maller, J., Sklar, P., de Bakker, P.I., Daly, M.J., and Sham, P.C. (2007).
PLINK: a tool set for whole-genome association and population-based
49. Gunz, P., and Mitteroecker, P. (2013). Semilandmarks: a method for quan-
linkage analyses. Am. J. Hum. Genet. 81, 559–575.
tifying curves and surfaces. Hystrix It. J. Mamm. 24, 103–109.
54. Howie, B.N., Donnelly, P., and Marchini, J. (2009). A flexible and accurate
50. Reardon, P.K., Seidlitz, J., Vandekar, S., Liu, S., Patel, R., Park, M.T.M., genotype imputation method for the next generation of genome-wide as-
Alexander-Bloch, A., Clasen, L.S., Blumenthal, J.D., Lalonde, F.M., et al. sociation studies. PLoS Genet. 5, e1000529.
(2018). Normative brain size variation and brain shape diversity in humans.
55. Fuchsberger, C., Abecasis, G.R., and Hinds, D.A. (2015). minimac2: faster
Science 360, 1222–1227.
genotype imputation. Bioinformatics 31, 782–784.
51. Dannemann, M., and Kelso, J. (2017). The Contribution of Neanderthals to 56. Auton, A., Brooks, L.D., Durbin, R.M., Garrison, E.P., Kang, H.M., Korbel,
Phenotypic Variation in Modern Humans. Am. J. Hum. Genet. 101, J.O., Marchini, J.L., McCarthy, S., McVean, G.A., and Abecasis, G.R.;
578–589. 1000 Genomes Project Consortium (2015). A global reference for human
52. Tzourio-Mazoyer, N., Landeau, B., Papathanassiou, D., Crivello, F., Etard, genetic variation. Nature 526, 68–74.
O., Delcroix, N., Mazoyer, B., and Joliot, M. (2002). Automated anatomical 57. Willer, C.J., Li, Y., and Abecasis, G.R. (2010). METAL: fast and efficient
labeling of activations in SPM using a macroscopic anatomical parcella- meta-analysis of genomewide association scans. Bioinformatics 26,
tion of the MNI MRI single-subject brain. Neuroimage 15, 273–289. 2190–2191.
Current Biology 29, 120–127, January 7, 2019 127STAR+METHODS
KEY RESOURCES TABLE
REAGENT or RESOURCE SOURCE IDENTIFIER
Critical Commercial Assays
1.5 Tesla Siemens Sonata and Avanto scanners, Siemens Medical Systems, Erlangen, Germany N/A
3 Tesla Siemens Trio and Trio TIM scanners
3 Tesla GE MR750 scanner General Electric, USA N/A
Affymetrix 6.0 genotyping array Affymetrix, USA N/A
PsychChip genotyping array Psychiatric Genomics Consortium, USA RRID:SCR_004495
OmniExpress genotyping array Illumina, USA N/A
Omni 2.5 genotyping array Illumina, USA N/A
Deposited Data
Introgressed Neandertal SNPs [18, 20] N/A
GTEx eQTL data gtexportal.org RRID:SCR_013042
BrainSpan Atlas http://www.brainspan.org/static/download.html RRID:SCR_008083
Software and Algorithms
Globularity measurement script (Mathematica) This Study N/A
FreeSurfer (v5.3) http://surfer.nmr.mgh.harvard.edu/ RRID:SCR_001847
FSL FIRST (v5.0, v5.0.9), FLIRT (v6.0) https://fsl.fmrib.ox.ac.uk/fsl/fslwiki/ RRID:SCR_002823
Avizo Thermo Scientific RRID:SCR_014431
Mathematica Wolfram RRID:SCR_014448
SPM12 Wellcome Trust Centre for Neuroimaging, RRID:SCR_007037
University College London
CAT12 toolbox Christian Gaser, University of Jena, Germany, N/A
http://www.neuro.uni-jena.de
xjview toolbox http://www.alivelearn.net/xjview RRID:SCR_008642
PLINK https://www.cog-genomics.org/plink2/ RRID:SCR_001757
minimac (release 2012-05-29) https://genome.sph.umich.edu/wiki/Minimac RRID:SCR_009292
mach2qtl https://www.unc.edu/yunmli/software.html RRID:SCR_009621
IMPUTE (v2.2.2) http://mathgen.stats.ox.ac.uk/impute/impute.html RRID:SCR_009245
QUICKTEST (v0.99b) https://wp.unil.ch/sgg/quicktest/ N/A
easyQC https://www.uni-regensburg.de/medizin/ N/A
epidemiologie-praeventivmedizin/
genetische-epidemiologie/software/
METAL https://genome.sph.umich.edu/wiki/ RRID:SCR_002013
METAL_Documentation
Genomic Type 1 Error Calculator http://grass.cgs.hku.hk/gec/ N/A
DESeq2 https://bioconductor.org/packages/release/bioc/ RRID:SCR_015687
html/DESeq2.html
CONTACT FOR REAGENT AND RESOURCE SHARING
Further information and requests for resources and reagents should be directed to and will be fulfilled by the Lead Contact, Simon
E. Fisher (simon.fisher@mpi.nl).
e1 Current Biology 29, 120–127.e1–e5, January 7, 2019EXPERIMENTAL MODEL AND SUBJECT DETAILS
Participants
The Nijmegen ‘‘Brain Imaging Genetics’’ (BIG) cohort is a Dutch population-based sample of healthy, unrelated volunteers.
Established in 2007, BIG is part of Cognomics, a joint initiative by the Donders Centre for Cognitive Neuroimaging, the Human
Genetics and Cognitive Neuroscience departments of the Radboud University Medical Centre, and the Max Planck Institute for
Psycholinguistics. MRI and genetic data were collected from individuals at the Donders Center for Cognitive Neuroscience,
in Nijmegen, the Netherlands. The BIG dataset has been described in several previous studies [42, 43]. The MRI data in the present
study come from 2,913 participants (53% female), with an average age of 27 years (range 17-82). The genetic data presented come
from a subset of 2,433 individuals (53% female), with an average age of 25 years (range 18-82). All participants gave written informed
consent for analysis of both their DNA and MRI scans, and the regional ethics committee approved the study.
The ‘‘Study of Health in Pomerania’’ (SHIP), established in 1997, is a prospective cohort study, part of the Community Medicine
Research net of the University of Greifswald. SHIP is a population-based project in West Pomerania, a region in the northeast of Ger-
many, that consists of two independent prospectively collected cohorts (SHIP and SHIP-Trend) assessing the prevalence and inci-
dence of common population-based diseases and their risk factors. The study design has been previously described in detail [44].
For SHIP, baseline examinations were carried out from 1997 until 2001, and the sample finally comprised 4,308 participants. Baseline
examinations for SHIP-Trend were carried out between 2008 and 2012, finally comprising 4,420 participants. We conducted a voxel-
based morphometry (VBM) analysis [45] on individuals from SHIP and SHIP-TREND. Complete datasets (including MRI, globularity
score, and covariates for adjustments) were available for 3,309 subjects. After exclusion of medical conditions (e.g., a history of ce-
rebral tumor, stroke, Parkinson’s diseases, multiple sclerosis, epilepsy, hydrocephalus, enlarged ventricles, pathological lesions) or
technical reasons (e.g., severe movement artifacts or inhomogeneity of the magnetic field) 2,952 subjects were available. We finally
performed the homogeneity check and excluded 23 extreme outliers. Our final sample for the VBM analysis consisted of 2,929 in-
dividuals (53% female). So as to study the effect of Neandertal alleles on globularity we used samples from the second five-year
follow-up of SHIP (SHIP-2, n = 1,139) and the baseline of SHIP-Trend (n = 896) for which both MRI and genotype data were available.
The samples had an average age of 56 (range 30-90) years for SHIP-2, and 50 (range 22-81) years for SHIP-Trend. The cohorts
included 51% and 56% females for SHIP-2 and SHIP-Trend, respectively. The medical ethics committee of the University of Greifs-
wald approved the study protocol, and oral and written informed consents were obtained from each of the study participants.
The ‘‘Function Biomedical Informatics Research Network’’ (FBIRN) Phase 3 cohort included 186 individuals with schizophrenia
(average age 38 years, 22% female) and 176 healthy volunteers (average age 37.5 years, 28% female) with an age range of 18-62
years. Written informed consent, including permission to share de-identified data between the centers, approved by the University
of California Irvine, Los Angeles, and San Francisco, Duke University, University of North Carolina, New Mexico, Iowa, and Minnesota
Institutional Review Boards, was obtained from all study participants. The study methods have been previously described in detail
[46]. Data from FBIRN was included in the initial description of brain globularity (see Methods - Structural MRI), however, the cohort
was not included in the genetic association analyses (see Methods - Genotyping, Statistical analyses).
METHOD DETAILS
Structural MRI
In the BIG cohort, MRI data were obtained using either a 1.5 Tesla Siemens Sonata or Avanto scanner, or a 3 Tesla Siemens Trio or
Trio TIM scanner (Siemens Medical Systems, Erlangen, Germany). Image processing was completed using FreeSurfer version 5.3
and FSL FIRST version 5.0 with FLIRT version 6.0, as described previously [42].
In the SHIP cohorts, participants were scanned using a 1.5 Tesla Siemens Avanto scanner, and image processing was completed
using FreeSurfer 5.3 and FSL FIRST version 5.0.9 (with FLIRT version 6.0).
The FBIRN Phase 3 cohort was scanned at 7 sites using six 3 Tesla Siemens Trio TIM (Siemens, Erlangen, Germany) and one 3
Tesla GE MR750 scanner (General Electric, USA). Image processing was completed using FreeSurfer 5.3 and FSL FIRST version
5.0.9 (with FLIRT version 6.0). In all cohorts, visual inspection was used to resolve potential outliers.
Computed tomography
Original fossil human crania (n = 7) and a European sample of recent modern human adults (n = 19) were scanned using computed
tomography (CT). The sample shown in Figure 2 comprises the Homo neanderthalensis specimens Gibraltar 1 (labeled as Gi),
Guattari (Gu), La Chapelle-aux-Saints (LC), La Ferrassie 1 (LF), Le Moustier 1 (LM1), and the Homo heidelbergensis specimens
Kabwe (Ka) and Petralona (Pe).
For all CT specimens, virtual endocasts of the braincase were created using segmentation in Avizo (Thermo Scientific) following [4].
Any missing data in fossil specimens were reconstructed using established protocols [47–49].
Globularity score computation for MRI scans
To quantify the endocranial shape differences between modern humans and Neandertals, we combined the methods of geometric
morphometrics [48] using scripts in Mathematica (Wolfram Inc.) with standard neuroimaging data processing protocols (FSL 5.0
and FreeSurfer 5.3). On each virtual endocast, we first distributed a dense mesh of semilandmarks [4, 47–49]. The same mesh of
Current Biology 29, 120–127.e1–e5, January 7, 2019 e2semilandmarks was distributed on an endocast segmented manually from the MNI 152 brain template (MNI 152 T1 2 mm). Semiland- marks are a geometric morphometric technique for quantifying relatively smooth curves and surfaces based on the same number 3D coordinates on each individual [4]. One starts by distributing the same number of 3D coordinates in approximately corresponding locations on each individual. Subsequently these semilandmarks are allowed to slide along the surface so as to remove the influence of the arbitrary initial point spacing. Our iterative semilandmark algorithm allows the surface semilandmarks to slide along tangent planes until the Procrustes distance between each individual and a template shape is minimal (this template shape can be sample average shape, or a single individual as detailed below), and projects the semilandmarks back onto the surface. These iterative sliding steps establish geometric homology among the semilandmarks within a sample [48, 49]. Next, we registered the FreeSurfer segmentation of each MRI scan to the MNI 152 template: we used ‘‘mri_label2vol’’ to register wmparc.mgz to the respective individual’s native anatomical space (rawavg.mgz), and then the command ‘‘flirt’’ to create a trans- formation matrix between this image and the MNI 152 template. Subsequently, we used ‘‘convert_xfm -omat’’ to create an inverse of this transformation matrix. In Mathematica, we then applied the inverse of each transformation matrix to the 3D coordinates of the dense mesh of semiland- marks on the MNI 152 template, thereby bringing the semilandmarks into the native anatomical space of each individual. Next, we allowed the semilandmarks on all specimens (i.e., CT scans and MRI scans) to slide so as to minimize the Procrustes distance be- tween each individual and the MNI 152 template (following ref. [49]). This sliding step establishes geometric homology of the semi- landmarks [4, 47–49]. We then used Procrustes superimposition on the slid semilandmarks to standardize location and orientation and to scale them to the same centroid size [48]. These Procrustes shape variables were analyzed using principal component analysis (Figure 2A). To quantify globularity, we computed the difference between the Procrustes mean shape of the Neandertal endocrania and the average shape of all modern European endocrania extracted from CT scans. We then projected the Procrustes shape coordinates of all en- docrania (i.e., CT and MRI data) onto this multivariate group-difference vector (Figure 2B). This final step yields a ‘‘globularity score’’ for each individual, a reliable continuous trait with a normal distribution, which we used to quantify the phenotype. A subsample (n = 399) of repeated MRI scans (from the BIG cohort) of the same individual on different occasions shows that this ‘‘globularity score’’ has a high test-retest repeatability, with a correlation of 0.97 after correcting for scanning covariates. Complementary shape analysis and globularity score We replicated the findings shown in Figure 2 in a more diverse endocranial dataset (Figure S1). This complementary shape analysis is based on endocranial data published in [4], with two additional Neandertal specimens (Saccopastore 1 and Le Moustier 1). This data- set comprises coordinate measurements on computer-generated endocasts of a geographically diverse sample of recent modern human adults (n = 89; the European specimens overlap with the crania used in the main text Figure 2) and fossil humans (n = 20): 8 fossil Homo erectus specimens — KNM-ER 3733 (labeled as ER3733 in Figure S1), KNM-ER 3883 (ER3883), KNM-WT 15000 (WT15k), OH 9, Ngandong 14 (Ng14), Ngawi (Nga), Sambungmacan 3 (Sam3), and Sangiran 2 (Sa2), and the Homo heidelbergensis specimens Kabwe (Ka), and Petralona (Pe). The Neandertal sample includes Amud 1 (labeled as A1), Feldhofer 1 (Fe), Gibraltar 1 (Gi), Guattari 1 (Gu), La Chapelle-aux-Saints (LC), La Ferrassie 1 (LF), Le Moustier 1 (LM1), Saccopastore 1 (SAC1), Spy 1 (S1), and Spy 2 (S2). A manual endocranial segmentation of the MNI 152 template (Figures 1E and 1F) was measured following the measurement and data processing protocol of [4]. We then used the same transformation matrices as for the computations in the main text (Figure 2) to transform these landmarks and semilandmarks to the native space of each MRI scan. After a Procrustes superimposition these shape coordinate data were analyzed using between-group principal component analysis based on the group mean endocranial shapes of Homo erectus, Homo neanderthalensis, and recent Homo sapiens (Figure S1B). Globularity scores for this dataset were computed as described above for Figure 2B. Homo erectus, Neandertals, and modern humans have distinct endocranial shapes (Figure S1B). Whereas the globularity scores of Neandertals and Homo erectus overlap completely (indicating that both groups have elongated endocranial shapes), modern humans form a distinct cluster without overlap (Figure S1C). Characterization of the phenotype Aspects of brain shape variation within modern humans have recently been linked to naturally occurring brain size variation [50]. Our evolutionarily-derived measure of brain globularity, however, is not related to brain size, as we found no significant correlation be- tween globularity and intracranial volume (Table S3). Moreover, the evolutionary trajectory of globularity within Homo sapiens is not related to endocranial volume, and the adult endocranial volumes of Homo sapiens and Neandertals overlap [4]. We found that endocranial globularity subtly changes with age in modern adult Europeans, with older adults having slightly higher globularity scores (i.e., more rounded endocranial shapes) (Table S3). Notably, however, not a single modern human individual over- lapped with Neandertals in overall endocranial shape (Figure 1F, Figure 2B) and thus globularity score (Figure 1G, Figure 2C). Lon- gitudinal MRI data may be able to identify the factors contributing to this subtle age-effect, whether it be due to regional differences in brain volume loss or other processes. Several studies have associated Neandertal-introgressed genetic variants with variability in phenotypes in modern humans, such as immunity, metabolism, and adaptation to environmental conditions, like temperature and sunlight, as well as neurological and behavioral phenotypes related to depression and addiction [17–20, 51]. To understand whether endocranial globularity is associated e3 Current Biology 29, 120–127.e1–e5, January 7, 2019
with other evolutionarily-linked traits, we tested their partial correlations in the SHIP-2 and SHIP-TREND cohorts (Table S3). Control-
ling for the effect of age, we saw no significant correlation between the globularity measure and any trait previously associated with
Neandertal introgressed alleles.

Voxel-based morphometry analysis
MRI scans were processed for voxel-based analysis (Figure S2, Tables S1 and S2) with SPM12 (Wellcome Trust Centre for Neuro-
imaging, University College London) and the CAT12 toolbox (developed by Christian Gaser, University of Jena, Germany, http://
www.neuro.uni-jena.de). The images were bias-corrected, spatially normalized by using the high-dimensional DARTEL normaliza-
tion, segmented into the different tissue classes, modulated for non-linear warping and affine transformations and smoothed by a
Gaussian kernel of 8 mm FWHM. The homogeneity of gray matter images was checked using the covariance structure of each image
with all other images (outlier R 3 standard deviations from the mean), as implemented in the check data quality function in the CAT12
toolbox. We ran a linear regression model in every voxel of the gray matter segmentations with the globularity score as the exposure
variable and adjusted for the following covariates: age (modeled continuously using restricted cubic splines), sex, ICV, and cohort
(SHIP, SHIP-Trend). The statistical threshold for significant voxels was set to family wise error (FWE)-corrected peak-level p values
ppeak,FWE 8%, BIG: > 5%) and identity-by-descent estima-
tion (removing duplicates). Multidimensional scaling (MDS) components, as calculated in PLINK [53], were used to exclude any out-
liers resulting from population stratification.
   SNPs passing initial quality control measures (SHIP: pHWE > 0.0001 and CallRate > 0.8; SHIP-Trend: pHWE > 0.0001 and
CallRate > 0.9; BIG: pHWE > 0.000001, CallRate > 0.95) were imputed to the 1000 Genomes Project (phase 1, version 3, ALL pop-
ulations) reference panel using IMPUTE v2.2.2 (SHIP) or minimac (release 2012-05-29, BIG) [54–56]. Variants with imputation quality
scores (R2) higher than 0.6 were carried forward in the analyses. The reference human genome for SNP annotation was the hg19
(GRCh37) human genome assembly.

QUANTIFICATION AND STATISTICAL ANALYSIS

Statistical analyses
Partial correlations between the globularity score and other covariates were performed in R using the ‘ppcor’ package. Scaled glob-
ularity scores were corrected for the scanner parameters (BIG only, since the SHIP cohorts used more homogeneous acquisition),
and participants’ age and sex (Table S3). As noted above, based on MDS quality control checks in genotype processing, we are
confident of minimal population substructure in these European cohorts. Nonetheless, for additional rigor we included the first
two principal components to correct for any remaining subtle population stratification. With the model residuals as the trait, associ-
ation statistics were generated with mach2qtl (BIG) or QUICKTEST version 0.99b (SHIP cohorts) using an additive model. The five
sets of summary statistics were aligned using easyQC with the 1000 Genomes Project European phase 1 version 3 reference files.
   We restricted our meta-analysis to the list of SNPs originating from Neandertal introgression, which was first presented [18] and
further refined as described [20]. The full set included 132,296 variants that differ from the Homo sapiens–Neandertal common
ancestor and match the Neandertal sequence. The meta-analysis was performed in METAL, using the standard error based method,
a minimum minor allele frequency of 0.01, and including the genomic control option [57]. In follow-up tests of the three top SNPs,
assessing how the number of genetic principal components in the model affected association statistics, the genomic control option
was not used as the meta-analysis involved only three markers. Any SNPs missing from one or more of the cohorts were excluded,
leaving 50,057 variants in the final analysis. As we tested a pre-defined, directional hypothesis that Neandertal alleles would be asso-
ciated with a shift toward more archaic endocranial shapes, we calculated p values based on a one-tailed association test.
   Neighboring SNPs on introgressed fragments are often in linkage disequilibrium with each other, and hence show varying
degrees of non-independence in association testing. To appropriately adjust for the multiple testing of many SNPs, accounting
for the existing linkage disequilibrium structure, the effective number of independent tests was calculated using the Genetic
Type-1 Error Calculator (GEC), with the 1000 Genomes Project VCF as input [21]. Significance was assessed using the significant
(7.38 3 10 6) and suggestive thresholds (1.48 3 10 4) provided by GEC.

GTEx eQTL Analysis
The GTEx dataset was obtained from dbGaP (accession number phs000424.v6.p1.c1, accessed on 05/23/2016). The processing of
GTEx v6 data for 48 tissues, for which > 50 individuals had available genotype data, has been described in detail elsewhere [25]. We

                                                                                Current Biology 29, 120–127.e1–e5, January 7, 2019 e4
You can also read