New Zealand Hydrogen Scenarios - Report to MBIE
←
→
Page content transcription
If your browser does not render page correctly, please read the page content below
New Zealand Hydrogen
Scenarios

Report to MBIE

JUNE 2022

Copyright Castalia Limited. All rights reserved. Castalia is not liable for any loss caused by reliance on this document.
Castalia is a part of the worldwide Castalia Advisory Group.
CONFIDENTIAL

Table of contents
Executive summary                                                                                 7
1    Introduction                                                                                17
2    New Zealand and international policy context                                                18
           2.1    New Zealand’s GHG emissions profile and commitments                            18
           2.2    International hydrogen policy context                                          20
3          Hydrogen use cases in 2050                                                            22
           3.1    Transport                                                                      22
                  3.1.1       Heavy-duty vehicles                                                23
                  3.1.2       Coach buses                                                        26
                  3.1.3       Speciality vehicles                                                27
                  3.1.4       Light-duty vehicles                                                30
                  3.1.5       Aviation transport                                                 31
                  3.1.6       Marine transport                                                   36
                  3.1.7       Rail transport                                                     38
           3.2    Energy and electricity system services                                         40
                  3.2.1       Hydrogen can play a role in decarbonising electricity production   40
                  3.2.2       Hydrogen production facilities could be source of capacity         44
           3.3    Industry                                                                       45
                  3.3.1       Fertiliser production                                              46
                  3.3.2       Feedstock for steel                                                47
                  3.3.3       Process heat                                                       49
                  3.3.4       Domestic and commercial combustion uses                            51
           3.4    Exports                                                                        53
4          Pathways to the hydrogen economy under BAU                                            55
           4.1    Production cost pathways for hydrogen in New Zealand                           55
                  4.1.1       Centralised production of hydrogen and distribution to end-users 56
                  4.1.2       Decentralised production and delivery of hydrogen to end-users 58
                  4.1.3       Comparisons to global production cost benchmarks                 58
           4.2    BAU pathways for key use cases                                                 59
                  4.2.1       Transport                                                          61
                  4.2.2       Energy and electricity system services                             65
                  4.2.3       Industry                                                           66
                  4.2.4       Exports to support decarbonisation overseas                        68
5          Pathways to the hydrogen economy with interventions                                   71
           5.1    Interventions that change the pace of hydrogen uptake                          71
                  5.1.1       Reducing capital cost of hydrogen technologies relative to other
                              technologies—demand side                                           72
                  5.1.2       Reduce the cost of hydrogen fuel relative to other energy—
                              supply side                                                        74
           5.2    Interventions that preserve infrastructure options                             76
                  5.2.1       Enabling future use of gas pipeline infrastructure                 76

Castalia                                                                                          2
                                                                                      2
Castalia
CONFIDENTIAL
5.2.2 Enabling future use of storage and distribution facilities 78
5.2.3 Enabling future use of electricity generation infrastructure 79
5.3 Interventions that reduce likelihood of import path dependency 80
Appendices
: Breakdown of total hydrogen demand in New Zealand 82
: Stakeholder engagement 83
Tables
Table 0.1: New Zealand’s BAU hydrogen demand in 2050 compared to other estimates 7
Table 2.1: Emissions in New Zealand (as of 2019) 19
Table 2.2: New Zealand’s BAU hydrogen demand in 2050 compared to other estimates 21
Table 3.1: New Zealand’s heavy-duty vehicle profile (as of 2017) 23
Table 3.2: Electricity generation sources as percentage of total electricity supply in
CCC’s pathway 40
Table 4.1: Estimated total hydrogen demand under BAU (in tonnes) 59
Table A.1: Breakdown of total demand for hydrogen in New Zealand across sectors and
use cases (in tonnes) 82
Figures
Figure 0.1: Illustration of centralised vs decentralised production in 2035 under BAU
(US$) 10
Figure 0.2: Illustration of hydrogen uptake in BAU scenario 12
Figure 0.3: Demand for hydrogen in transport applications in New Zealand 13
Figure 3.1: GHG emissions in New Zealand’s transport sector in 2019 23
Figure 3.2: P2G and hydrogen energy storage 41
Figure 4.1: Illustration of centralised vs decentralised production in 2035 (US$) 56
Figure 4.2: Water usage in the New Zealand economy (cubic metres per annum) 57
Figure 4.3: Sensitivity of hydrogen production at scale to inputs 57
Figure 4.4: New Zealand and global comparator hydrogen production costs 59
Figure 4.5: Illustration of hydrogen uptake in BAU scenario 60
Figure 4.6: Demand for hydrogen in transport applications 62
Figure 4.7: High demand and low demand estimates for hydrogen in transport
applications 63
Figure 4.8: Comparative energy costs of different electricity production and storage
technologies in 2050 for 1MW isolated systems 66
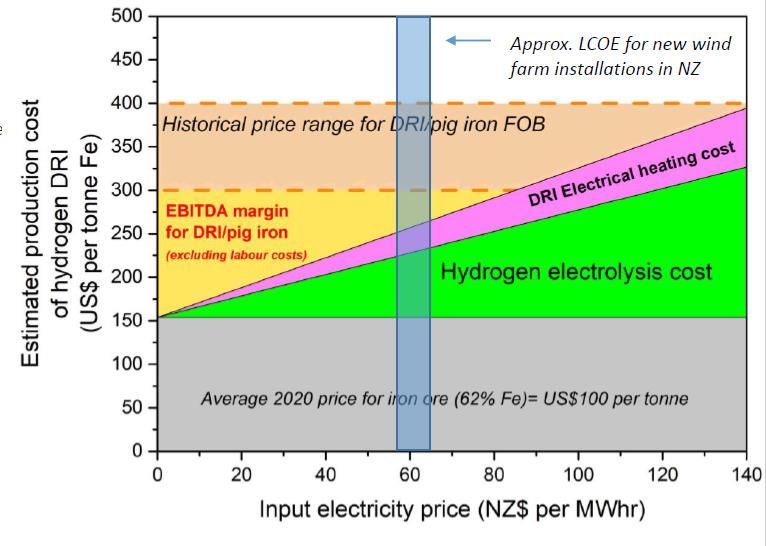
Figure 4.9: Illustration of DRI steel production costs and implied electricity cost 67
Figure 4.10: Comparison of New Zealand and overseas production costs in 2025 68
Figure 4.11: Comparison of landed hydrogen costs to Tokyo, Japan (2035) 69
Figure 5.1: Demand for hydrogen with cumulative effect of all modelled interventions 72
Figure 5.2: Demand for hydrogen after capex tax on diesel vehicles 73
Figure 5.3: Demand for hydrogen after 20 percent increase in diesel price 74
Figure 5.4: Demand for hydrogen with production plant capex subsidies 75
Figure 5.5: First Gas natural gas transmission and distribution network 78
Castalia 3
3
Castalia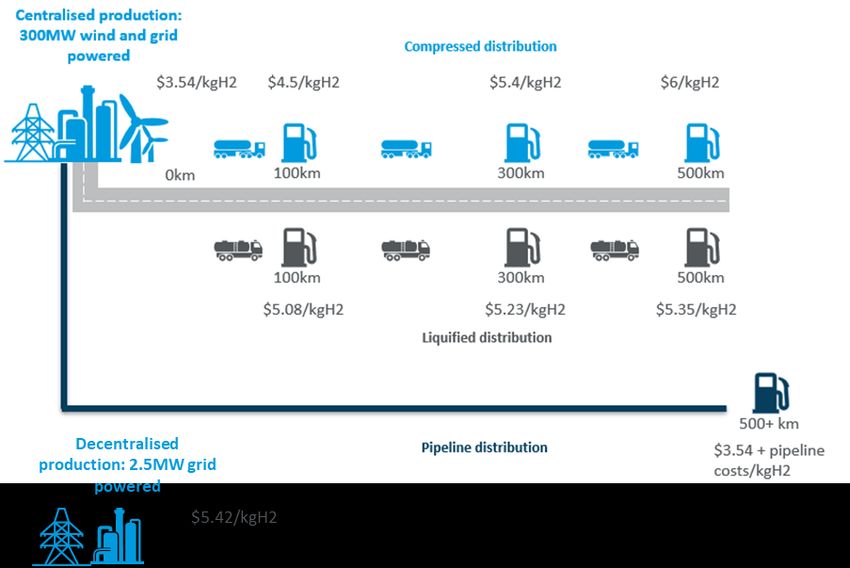
CONFIDENTIAL

Figure 5.6: Landed costs of hydrogen to Auckland or Lyttleton compared to local
             production (2035)                                                        81
Figure 5.7: Comparison of New Zealand and imported green hydrogen costs               81

Castalia                                                                               4
                                                                                  4
Castalia
CONFIDENTIAL
Definitions
ABS American Bureau of Shipping
B100 100 percent biofuel
B20 20 percent biofuel blend
BAU Business as usual
BE Battey electric
BEB Battery electric buses
BEV Battery electric vehicle
CCC Climate Change Commission
CCS Carbon Capture and Storage
Class NB Goods vehicle that has a gross vehicle mass exceeding 3.5 tonnes but not exceeding 12
tonnes
Class NC Goods vehicle that has a gross vehicle mass exceeding 12 tonnes
CO2-e Carbon dioxide equivalent
DAC Direct air capture
DRI Direct reduced iron
EAF Electric arc furnace
EOR Enhanced oil recovery
EU Europe
ETS Emissions Trading Scheme
FCEB Fuel cell electric bus
FCEV Hydrogen fuel cell vehicle
GHG Greenhouse Gas
H2 Hydrogen
HFC Hydrogen fuel cell
ICE Internal combustion engine
IPPU Industrial Processes and Produce Use
IRENA International Renewable Energy Agency
kg Kilograms
kt Kilotonnes
LCFS Low carbon fuel standard
LCOE levelised cost of electricity
LOHC Liquid organic hydrogen carriers
Castalia 5
5
CastaliaCONFIDENTIAL
MCH Methyl Cyclo Hexane
MMT Million metric ton
MOU Memorandum of Understanding
Mt Metric tons
MW Megawatt
MWh Megawatt hour
NDC Nationally Determined Contribution
NZ$ New Zealand Dollar
NZU New Zealand Unit Types
P2G Power-to-gas
PEM Polymer electrolyte membrane electrolysis
PJ Petajoule
POAL Ports of Auckland Limited
PtL Power to liquid
RE Renewable energy
SAF Sustainable Aviation Fuel
SOFC Solid oxide fuel cell
TWh Terawatt hour
TOL Toluene
TPA Tonnes per annum
US United States
US$ United States Dollar
UNFCCC United Nations Framework Convention on Climate Change
WACC Weighted average cost of capital
ZEV Zero-emissions vehicle
Castalia 6
6
CastaliaCONFIDENTIAL
Executive summary
The New Zealand Government (the government) wants to develop hydrogen scenarios for New
Zealand, following the development of the 2019 Hydrogen Green Paper ‘A vision for hydrogen
in New Zealand’ and a hydrogen demand, supply and international trade model built by
Castalia in 2020 (the Castalia-MBIE 2020 Hydrogen Model). The scenarios will inform a
Hydrogen Roadmap for New Zealand.
New Zealand green hydrogen may account for around 8 percent of total energy demand by 2050
Hydrogen technologies and green hydrogen as an energy carrier could help the government
achieve its greenhouse gas (GHG) emissions reduction targets.1 As variable renewable
electricity sources such as solar and wind increase as a share of generation capacity, the
electricity system will need to become more flexible. Green hydrogen is a flexible renewable
energy (RE) carrier, which can be used in a wide range of applications, such as transport,
energy and electricity system services, and industry. It can also be exported to assist overseas
decarbonisation efforts.2 It can reduce emissions in high emitting and difficult to decarbonise
sectors. Hydrogen could also offer a strategic opportunity for New Zealand to become less
reliant on fossil fuel imports for key sectors, particularly transport, which creates future
resilience against fuel security risks. It is not without its challenges, however. There are
competing technologies which could offer lower cost emissions reductions.
This report explores possible use cases of green hydrogen under a business-as-usual (BAU) in
2050 pathway, and also looks at New Zealand’s possible hydrogen economy in 2050 under
specific intervention scenarios. Our BAU scenario modelling suggests that around 8 percent of
New Zealand’s energy demand could be met by green hydrogen as an energy vector in 2050. It
is possible that this demand will increase over time as hydrogen technologies become more
developed. Table 0.1 details New Zealand’s estimated hydrogen demand in 2050 under a BAU
scenario, compared to other countries’ estimates. Those other estimates include lower-cost
blue, brown and grey hydrogen, whereas our New Zealand analysis only includes green
hydrogen.3
Table 0.1: New Zealand’s BAU hydrogen demand in 2050 compared to other estimates
Region Total Sources of Share of total Key use cases Source
hydrogen hydrogen energy demand in
demand 2050 2050 (%)
(MMT)
New 0.34 Green 8 (BAU) (Excluding Transport (heavy Castalia
Zealand uncertain use cases) trucks, coach buses, Analysis
and speciality vehicles)
1
In this report we only analyse green hydrogen.
2 Throughout this report we have considered export as a sector.
3 This estimate is in line with other studies, because:
▪ Other studies include blue and grey hydrogen (our study is green only)
▪ Other studies include uncertain use cases (our estimate includes likely use cases only)
▪ Other studies include synthetic fuels and natural gas replacement for heating (New Zealand has better opportunities to
electrify).
Castalia 7
7
CastaliaCONFIDENTIAL
World 1,370 Green, Blue 15—24 (Strong Space and water BNEF
policy) heating, peaking power,
industry, and transport
US 63 Green, Blue, 14 (Ambitious) Transport, industry, McKinsey
Gray buildings, and refining
Canada 20 Green, Blue, 30 Transport, synthetic Zen
Gray fuel, natural gas
replacement, grey
crude production
feedstock, and other
industrial uses
EU 68.2 Green, Blue, 24 (Ambitious) Power generation, McKinsey
Gray transport, heating for
buildings, and industry
Other countries have ambitious hydrogen strategies and interventions
New Zealand’s hydrogen policy is not as advanced as other developed countries. Australia has
developed a hydrogen strategy and committed significant sums to projects. Europe, Canada
and the US governments and the private sector have likewise committed significant sums
toward the development of a hydrogen economy.
Hydrogen in New Zealand can be used in four sectors
We identified four sectors in New Zealand where hydrogen technology and applications of
hydrogen as an energy carrier could be used: transport, energy and electricity system services,
industry, and exports.
Hydrogen in the transport sector
Hydrogen use is most likely in heavy-duty vehicles like trucks, some buses and in speciality
vehicles. Hydrogen fuel cell (HFC) vehicles have a high gravimetric energy density, fast
refuelling time, and a long driving range compared with alternatives. Battery electric (BE)
vehicles are the main competing zero-emission technology, and biofuel is the main competing
low carbon fuel source.
Hydrogen is likely to be used in aviation applications; however it is not clear whether hydrogen
will be combusted, in a hybrid HFC-combustion aircraft or used as an input to Synthetic-
Sustainable Aviation Fuel (SAF).
Marine applications using hydrogen are possible for small vessels and some larger vessels
using HFCs, or as a fuel (including via green ammonia) in combustion engines for deep-sea and
larger fleets. BE vessels are the main competing technology, and advanced biofuels is the main
competing fuel source.
Rail may utilise HFC trains in applications that require long-range, high-power demands, low
service frequency, and fast refuelling times. Hybrid HFC-BE trains may also be utilised. Like
marine, green ammonia is also being considered for rail applications. The electrification of
railway lines is the main competing technology, while biofuel is the main competing fuel
source.
Castalia 8
8
CastaliaCONFIDENTIAL
Hydrogen for energy and electricity system services
Hydrogen could have different uses for energy and electricity systems services. In theory
hydrogen could be used as electricity storage over various time horizons and for generation
could help improve the resilience of the electricity system. Hydrogen produced during periods
of low electricity demand could be stored and used to support intra-day and inter-seasonal
security of supply.
Electric batteries are likely to be more viable for daily peak demand requirements, whereas
hydrogen storage may become more viable for longer duration storage, and where multiple
uses for hydrogen are possible.
Electrolysers that would normally produce hydrogen provide an option for rapid demand
response option in electricity systems. These could better utilise existing electricity generating
resource by making more supply available without increasing the required capacity on the grid.
Hydrogen in industry
There is currently only limited scope to replace industrial feedstocks with hydrogen. Fertiliser
production may utilise hydrogen as a feedstock if costs come down and technological
processes improve. Hydrogen could also be used in steel production as a feedstock, however,
the technology to do this at scale is still in development. At this stage, steel production using
hydrogen feedstock is the only zero-emission alternative to traditional steelmaking. In the
future, carbon capture and storage (CCS) may be a viable way to reduce, but probably not
eliminate, emissions from the traditional steelmaking process. Finding a CCS site in New
Zealand that is geologically suitable and passes environmental and social standards is also
likely to be difficult. Therefore, if emissions are to be eliminated from steelmaking, hydrogen is
likely to play a significant role.
High-temperature process heat could use hydrogen as a combusted heat source. Electricity
and biomass are effective heat sources, but only for low and medium-temperature process
heat. Domestic and commercial combustion may utilise hydrogen as a combusted heat source
for heating and cooking. Hydrogen use in this application is likely to be small, due to electricity
and biogas as strong competing energy sources for heat pumps and stoves.
Hydrogen to support decarbonisation in export markets
Hydrogen produced in New Zealand could help meet global demand, particularly in countries
like Japan, Korea, and Singapore. New Zealand’s abundant RE sources mean that hydrogen
could be cost-competitive. Other countries with low-cost energy sources will compete with
New Zealand in the global market.
BAU pathway for hydrogen uptake has demand from around
2030
Under a BAU pathway, we expect hydrogen uptake in heavy vehicles and for hydrogen
technology to support the electricity system and produce hydrogen for export from around
2030. The BAU pathway assumes that New Zealand policy is generally supportive of hydrogen
technology, without specific interventions, and the cost of carbon steadily rises over the 30-
year period. The modelling assumptions are detailed in Section 4.
Castalia 9
9
CastaliaCONFIDENTIAL
Production pathways depend on plant utilisation, electricity costs and distance from
market
New Zealand’s domestic delivered hydrogen costs are comparable to global forecast
benchmarks. The advantages of scale production can be outweighed by distance from the
point of use.
Production of hydrogen could be a combination of both centralised production and distribution and
decentralised production and distribution, depending on electricity costs and distance from users
Delivered hydrogen costs in New Zealand will depend on production and distribution costs.
Cost competitiveness of centralised versus decentralised production is broadly comparable.
Figure 0.1 illustrates the difference in delivered hydrogen prices in the BAU scenario. While
large-scale centralised bulk production costs are lower (US$3.54/kg) compared to smaller-scale
decentralised production (US$5.42/kg), once delivery cost as either compressed gas or liquid
are considered, the cost of at the point of use is very similar. Distribution via pipelines is likely
to be cost-competitive, but costs are difficult to estimate.
Figure 0.1: Illustration of centralised vs decentralised production in 2035 under BAU (US$)
Demand depends on relative competitiveness of hydrogen technologies and uses
Figure 0.2 illustrates the tipping point and uptake timeframes for each use case and an
assessment of the likelihood of development. It also shows the approximate hydrogen demand
by 2050 in the base case. We then go into this modelling in more detail below. It is important
to note that our modelling is highly sensitive to technological developments.
We did not carry out detailed modelling for marine use cases because HFC technology is in the
early stages of development and relative costs of HFCs and competing low-carbon solutions
Castalia 10
10
CastaliaCONFIDENTIAL
are not clear. For rail, the use of HFC trains in New Zealand will depend on the cost of
electrifying remaining sectors of the network. We also did not model process heat and
domestic combustion uses of hydrogen. Direct electrification is lower cost for many
applications. It is not clear if hydrogen would be lower cost that other energy sources or
carriers for combustion use cases.
Castalia 11
11
CastaliaCONFIDENTIAL
Figure 0.2: Illustration of hydrogen uptake in BAU scenario
Note: Figures are rounded.
*For fertilizer production, around 1 percent of annual demand will be produced in the short-term using green hydrogen from wind-
powered hydrogen production at Kapuni.
Castalia 12
12
CastaliaCONFIDENTIAL
Heavy vehicles, coach buses, and speciality vehicles will drive demand in the transport sector
The transport sector is likely to be the largest source of demand of hydrogen in New Zealand.
Demand will come from heavy trucks, coach buses and speciality vehicles. Figure 0.3 shows
estimated demand in a base, high and low case.
Figure 0.3: Demand for hydrogen in transport applications in New Zealand
500,000
Tonnes of Hydrogen
400,000
300,000
200,000
100,000
0
2021
2022
2023
2024
2025
2026
2027
2028
2029
2030
2031
2032
2033
2034
2035
2036
2037
2038
2039
2040
2041
2042
2043
2044
2045
2046
2047
2048
2049
2050
Year
Total demand for Hydrogen (Base Case) Total demand for Hydrogen (High Case)
Total Demand for Hydrogen (Low case)
Heavy vehicle demand is the largest source of estimated demand, that is not dependent on the
emergence of new technologies. We estimate the tipping point for demand for hydrogen in
heavy vehicles to start around 2030. There will be demand for high frequency users and
specific use cases prior to this. This will grow to around 265,000 tonnes by 2050.
The tipping point for demand for hydrogen in coach buses in the average use case is expected
to emerge around the 2040s, when total cost of ownership for particular routes falls below
equivalent BEBs and diesel alternatives. Some use cases are expected to be economic before
this. Estimated demand for hydrogen will grow to around 14,3004 tonnes by 2050.
The tipping point for demand for hydrogen in specialty vehicles is expected to start in the mid-
2030s. This will grow to around 62,500 tonnes by 2050.
Our modelling shows that once the capital costs of HFC-EV light-duty vehicles and BEVs reach
parity, the total cost of ownership is comparable. This will justify using or switching to HFC-EV
light-duty vehicles for some users who have high travel demand and when EV charging time is
a constraint. Our modelling suggests that total demand for hydrogen for light-duty commercial
use is approximately 1,449 tonnes by 2050.
Demand in aviation is likely to occur. However, it is unclear which technologies will become
dominant, and how much demand there will be. Some demand may also emerge in marine and
rail. The tipping point for demand in these three applications is highly uncertain because the
technologies that could decarbonise the sectors are in development.
Demand response would play a role in the electricity sector
Hydrogen technology is likely to support the electricity system as a demand response option.
Hydrogen production can be ramped up and down quickly and can follow electrical load
flexibly. Demand response is a key feature of the business model for the Southern Green
Hydrogen opportunity in Southland.
Castalia 13
13
CastaliaCONFIDENTIAL
Hydrogen technologies may be a viable means to overcome inter-seasonal security of supply,
but are unlikely to provide intra-day security of supply. Hydrogen storage (such as via natural
gas pipeline or in a geological formation) may be viable for long duration storage to mitigate
dry year risk. Biomass and pumped hydro may be more economic. It is not clear which long-
term storage technologies are most suitable in New Zealand. Hydrogen technologies are
unlikely to provide intra-day security of supply due to viable alternatives, such as electric
batteries. Hydrogen storage may also be viable for some defined applications where multiple
uses for hydrogen are possible, for example when hydrogen is used for vehicle fuel and in a
fuel cell.
Industrial demand for hydrogen will be small during the transition and there may be demand in steel
making
Hydrogen may have some relatively small-scale uses, but industrial demand will probably not
drive hydrogen production decisions. Hydrogen could be used in steelmaking, but demand will
be modest relative to transport use. If the steel mill can convert its entire production process,
potential demand for hydrogen in steelmaking would be between 30-35 kilo tonnes per year.
Although this demand for hydrogen is relatively low compared to other use cases such as
transport, the emissions reduction impact is still significant.
New Zealand exports appear to be globally competitive
New Zealand-produced hydrogen is likely to be in the range of cost-competitiveness with key
trading partner countries. The Southern Green Hydrogen proposal in Southland could utilise an
existing transmission line, and significant capacity (up to 800 MW) from the Manapouri power
station at a high utilisation rate. This compares favourably to overseas production options.
Interventions could bring forward hydrogen uptake or preserve
infrastructure options
The interventions examined in this section are not current government policy. They are indicative policies that
Castalia has identified that the government may or may not choose to investigate further at a later date.
Overall, typical policy interventions would not make a significant difference to hydrogen
uptake in the model. This is because subsidies (or tariffs) on capital equipment or inputs have a
relatively modest impact on the total cost of ownership.
However, there may be strategic opportunities that fall outside of the modelling approach in
this report. For example, hydrogen for aviation is still in early stages of development, but New
Zealand has some advantage as a test-case country.
Interventions could reduce costs of hydrogen technologies relative to competition
Interventions such as subsidies, tariffs, or taxes on vehicles and mandates for vehicle types
could reduce capital cost of hydrogen technologies relative to other technologies. These
interventions will support demand. Subsidies for fertiliser and steel production using hydrogen
could support demand.
Our modelling suggests that changing the price of diesel fuel would also have little impact on
the timing of uptake of hydrogen vehicles. Our modelling also suggests that the change in
demand for hydrogen is very small from a 20 percent increase in tax on diesel vehicles. This is
because the additional cost of tariff increase is spread over the vehicle’s useful life. A 10
Castalia 14
14
CastaliaCONFIDENTIAL
percent increase in tariffs has no impact on overall demand for hydrogen in the transport
sector.
Interventions that support production could change timing of uptake
Support for scale production, production subsidies, emissions taxes or emissions trading
scheme (ETS) prices, and low carbon fuel standards (LCFS) could reduce the cost of hydrogen
fuel relative to other technologies, energy sources, or energy carriers. Use of these
interventions could accelerate the pace of uptake. Large-scale research and development
support in New Zealand is unlikely to impact global capital costs or the global industry. While
pure science and support for research and development should continue, domestic
interventions in these matters are unlikely to materially change uptake.
Our modelling suggests that large subsidies for the capex cost of building a plant (25-45
percent subsidy) would have only a modest impact on timing of hydrogen demand. Subsidies
on plant capex have a larger impact after 2040 compared to base case. This is because
hydrogen trucks below 12,000 kgs become viable earlier due to the cheaper cost of producing
hydrogen.
Interventions that preserve infrastructure options
There may be future uses for existing infrastructure to provide services in the hydrogen
economy. Infrastructure includes:
▪ Gas pipeline infrastructure
▪ Storage and distribution facilities
▪ Electricity generation infrastructure.
Preserving this infrastructure may provide options that avoid additional sunk costs or enable
wider range of decarbonisation technologies. A range of interventions could be used to
preserve the infrastructure.
Interventions that reduce import path dependency
Imported hydrogen may be lower cost than domestically produced hydrogen before scale
production and a domestic supply chain is built. This could lead to a path dependency where it
is not economic to build a competing domestic supply chain. Interventions could lower
domestic production cost.
Strategic and long-term support
New Zealand’s advantages are in its sunk investments in infrastructure and its strategic
advantages in certain sectors. Other countries are undertaking significant investment in
hydrogen technology and projects where governments have identified a particular strategic
advantage. New Zealand policy is probably best targeted at particular niches where the
country already has an advantage relative to other countries, which are spending significant
sums. For example, the Australian government has recognised a strategic advantage in
developing brown or blue hydrogen from natural gas and the future possibilities of switching
to producing green hydrogen from solar PV. Northern hemisphere countries are investing
heavily in industrial uses, hydrogen to replace natural gas for heating, and in heavy transport.
New Zealand policymakers could explore supporting longer-term and strategic support for
particular niches. For instance, New Zealand seems to have an advantage in the aviation
sector. Air New Zealand and Airbus have a strategic joint initiative where the companies will
cooperate on understanding how to integrate hydrogen aircraft in a commercial network. If
Castalia 15
15
CastaliaCONFIDENTIAL
hydrogen technology advances to a stage where hydrogen can meet the energy demand for
New Zealand’s forecast aviation demand, then aviation would be the largest source of
hydrogen demand (1.4 million tonnes, about four times the land transport demand). Hydrogen
aviation technology is not yet available, so no policy interventions should yet be considered.
However, the government should ensure that as it emerges, the regulations and wider policy
environment supports the sector’s development.
Castalia 16
16
CastaliaCONFIDENTIAL
1 Introduction
The purpose of this report is to analyse the sectors and technologies for likely hydrogen
demand and understand the supply potential for hydrogen in New Zealand. This report
outlines our understanding of how the hydrogen economy could develop in New Zealand
under a BAU scenario to 2050. It analyses four sectors and use cases for hydrogen within those
sectors. This analysis enables us to develop scenarios of varying interventions that could
change the pace of hydrogen uptake, preserve infrastructure options, or reduce the likelihood
of import path dependency.
In this report, we only analyse green hydrogen. Green hydrogen is produced via water
electrolysis using, almost exclusively, electricity from RE sources. Approximately 84 percent of
New Zealand’s grid electricity is RE4, but the government’s policy objective is to transition to 90
percent RE by 2025 and to increase the penetration of RE beyond this.
The report is structured as follows:
▪ Section 2 sets out the New Zealand and international policy context
▪ Section 3 shows how hydrogen can contribute to the government’s net zero 2050 goal
in three sectors, plus exports to support decarbonisation elsewhere
▪ Section 4 sets out the BAU pathways to the hydrogen economy under:
– Pathways for the production costs for supply of hydrogen
– Pathways for the demand for hydrogen in the four sectors5
▪ Section 5 outlines the intervention scenarios to the hydrogen economy in terms of:
– Interventions that change the pace of uptake
– Interventions that preserve infrastructure options
– Interventions that reduce the likelihood of import path dependency.
The following appendices are also included:
▪ Appendix A: Breakdown of total hydrogen demand in New Zealand across sectors and
use cases
▪ Appendix B: List of stakeholders that have been engaged to date for this project
4 https://www.nzte.govt.nz/page/renewable-energy
5 Throughout this report we have considered export as a sector.
Castalia 17
17
CastaliaCONFIDENTIAL
2 New Zealand and international
policy context
New Zealand’s green hydrogen scenarios need to be seen in the context of the government’s
policies and aims for decarbonisation. The government has set a net zero emissions target for
2050. Other countries have also incorporated hydrogen into their energy policy framework.
We briefly summarise these here.
2.1 New Zealand’s GHG emissions profile and
commitments
This section summarises the policy context of New Zealand’s GHG emissions profile and
commitments to reduce emissions.
The New Zealand Government (the government) set a target of net zero emissions by 2050 in
the Climate Change Response (Zero Carbon) Amendment Act 2019 (the Act).6 The 2050 targets
are designed to achieve a domestic low-emission transition across a range of sectors, including
transport, electricity production, and industry. The Act updated New Zealand’s First Nationally
Determined Contribution (NDC) (first submitted in 2016 and updated in 2020), which initially
targeted reducing the country’s GHG emissions to 30 percent below 2005 levels by 20307 to
comply with New Zealand’s obligations under the Paris Agreement.
In 2019, the government also set a target of 100 percent RE generation by 2035.8 Key RE
sources for New Zealand are solar, hydro, and geothermal, and green hydrogen is a key RE
carrier. New Zealand is expected to use a portfolio of RE options with varying applications.
New Zealand’s gross annual GHG emissions were 82.3 Mt CO2-e in 2019.9 Table 2.1 details New
Zealand’s gross emissions sources by sector (and some key sub-sectors). The emissions cited in
this report use New Zealand’s gross emissions, detailed in New Zealand’s Greenhouse Gas
Inventory, submitted to the United Nations Framework Convention on Climate Change
(UNFCCC) in April 2021.
The CCC predicts that, under current policies, gross long-lived emissions would fall to
approximately 45 Mt CO2-e by 2030, and continue to fall to around 33 Mt CO2-e in 2050. Net
emissions would also reduce, largely through increased carbon removals, with 1.1 million
hectares of new forest to be planted by 2050.
6 Climate Change Response (Zero Carbon) Amendment Act 2019 is available at:
https://www.legislation.govt.nz/act/public/2019/0061/latest/LMS183736.html
7 New Zealand’s First NDC is available at:
https://www4.unfccc.int/sites/ndcstaging/PublishedDocuments/New%20Zealand%20First/New%20Zealand%20first%20NDC.p
df
8 https://www.beehive.govt.nz/release/nz-embracing-renewable-electricity-future
9 https://ccc-production-media.s3.ap-southeast-2.amazonaws.com/public/Inaia-tonu-nei-a-low-emissions-future-for-
Aotearoa/Inaia-tonu-nei-a-low-emissions-future-for-Aotearoa.pdf, p.79
Castalia 18
18
CastaliaCONFIDENTIAL
Table 2.1: Emissions in New Zealand (as of 2019)
Sector Amount of GHG emissions (kt CO2- Percent of gross GHG emissions
e) (%)
Agriculture 39,617.1 48
Energy 34,263.1 42
▪ Transport 16,207.6
▪ Public electricity and heat 4,181.3
production
Industrial Processes and Product 5,115.9 6
Use (IPPU)
▪ Chemical industry 209.5
▪ Metal industry 2,325.2
Waste 3,316.9 4
Land Use, Land-Use Change and -27,425.1 -33
Forestry (LULUCF)
Total gross emissions 82,317.9 100
Total net emissions 54,892.8
Note: The LULUCF sector is not a part of gross emissions, and is included here as a negative value
Castalia 19
19
CastaliaCONFIDENTIAL 2.2 International hydrogen policy context Hydrogen is emerging as an important priority for decarbonising energy in many other economies. Reducing the cost of green hydrogen (US$/kg) is the key factor affecting the increased role of hydrogen. Many developed countries are providing strong policy support. Our review shows that national strategies and roadmaps expect total demand for hydrogen of around 15-30 percent of total energy demand in those countries or areas by 2050. Overall, more than 228 hydrogen projects valued at US$300 billion up to 2030 have been announced.10 In the United States, , the Department of Energy recently announced US$52.5 million to fund 31 projects to advance next-generation clean hydrogen technologies and support its Hydrogen Energy Earthshot Initiative. Canada has several projects including the Hydrogen Locomotive Program, New Edmonton Blue Hydrogen Hub, and Alberta Zero Emissions Hydrogen Transit with investments over a US$1 billion. In the European Union, projects with a value of approximately US$17 billion have been committed. Australia’s government has committed AU$ 1.4 billion dollars in building a hydrogen industry and projects are being developed in several states, notably in Queensland where Woodside Petroleum will invest more than AU$ 746 million to build a hydrogen/ammonia plant. 11 Table 2.2 compares New Zealand’s strategy with other countries, and some proposed projects. 10 https://hydrogencouncil.com/wp-content/uploads/2021/02/Hydrogen-Insights-2021.pdf 11 https://www.reuters.com/business/energy/woodside-invest-over-a1-bln-hydrogen-ammonia-plant-w-australia-2021-10-25/ Castalia 20
CONFIDENTIAL

Table 2.2: New Zealand’s BAU hydrogen demand in 2050 compared to other estimates

     Region            International hydrogen policy                Total hydrogen                Sources of     Share of total energy     Key use cases                              Source
                       developments12                               demand 2050 (MMT)             hydrogen       demand in 2050 (%)
     New Zealand       A vision for Hydrogen in New Zealand         0.34                          Green          8 (BAU) (Excluding        Transport (heavy trucks, coach buses,      Castalia
                       released September 2019;                                                                  uncertain use cases)      and speciality vehicles)                   Analysis
                       MBIE-Castalia 2020 Hydrogen Model;
                       Hydrogen Scenarios (this document)

     World                                                          1,370                         Green, Blue    15—24 (Strong policy,     Space and water heating, peaking           BNEF
                                                                                                                 Ambitious)                power, industry, and transport

     US                Department of Energy Hydrogen                63                            Green, Blue,   14 (Ambitious)            Transport, industry, buildings, and        McKinsey
                       Program Plan released November 2020                                        Gray                                     refining

     Canada            Hydrogen Strategy for Canada released        20                            Green, Blue,   30                        Transport, synthetic fuel, natural gas     Zen
                       December 2020                                                              Gray                                     replacement, grey crude production
                                                                                                                                           feedstock, and other industrial uses

     EU                European Commission – A Hydrogen              68.2                         Green, Blue,   24 (Ambitious)            Power generation, transport, heating       McKinsey
                       Strategy for a Climate-Neutral Europe                                      Gray                                     for buildings, and industry
                       released July 2020

     Australia         Australia’s national hydrogen strategy       19.8                          Green          20 (Best case             Steelmaking, ammonia production,           Delloite14
                       released November 2019                                                                    scenario13 )              oil refining, light and heavy transport,
                                                                                                                                           heating, power generation and
                                                                                                                                           shipping

12
     https://research.csiro.au/hyresource/international-hydrogen-policy-developments-an-update/
13   Hydrogen Energy Demand Growth Prediction and Assessment (2021–2050) Using a System Thinking and System Dynamics Approach (Yusaf et.al, 2022)
14   https://www2.deloitte.com/content/dam/Deloitte/au/Documents/future-of-cities/deloitte-au-australian-global-hydrogen-demand-growth-scenario-analysis-091219.pdf

Castalia                                                                                                                                                                                           21
CONFIDENTIAL
3 Hydrogen use cases in 2050
This section describes the use cases of hydrogen in New Zealand, given the government’s
objectives for reducing GHG emissions. We describe the role that hydrogen technologies and
hydrogen as an energy carrier could play in decarbonising key sectors in New Zealand, outline
competing technologies, and discuss the key determinants for hydrogen uptake.
There are four main sectors in New Zealand’s economy where hydrogen can play a key
decarbonisation role; domestic use in transport, energy and electricity system services,
industry, and overseas decarbonisation efforts through export trade.
Below we discuss possible uses of hydrogen by 2050 using the following structure:
▪ The role of hydrogen technologies and hydrogen as an energy carrier in four sectors:
transport, energy and electricity system services, industry, and exports
▪ The competing technologies and energy sources to produce hydrogen
▪ The factors that will determine whether hydrogen is a cost-competitive energy carrier
and the technology is viable.
3.1 Transport
Hydrogen technologies and hydrogen as an energy carrier can significantly reduce emissions
from the transport sector by replacing fossil fuels. The government’s 2050 emissions targets
require significant adoption of hydrogen in the transport sector. Hydrogen is useful for
decarbonising the transport sector because it is a RE carrier with a high gravimetric energy
density required for transportation. Hydrogen has the highest energy content per mass of all
chemical fuels at between 120.2–141 MJ/kg.15
Emissions from transport were 16,207.6 kilo tonnes (kt) CO2-e in 2019, which accounted for
19.7 percent of total gross GHG emissions in New Zealand.16 New Zealand imported over 306
petajoules (PJ) of oil in 2020, of which 207 PJ (27.5 percent) was for domestic transport.17
Under current policies, transport emissions are predicted to be 7,800 kt CO2-e in 2050.18
Figure 3.1 details total emissions in the transport sector and by sub-sector in 2019.
15 https://absinfo.eagle.org/acton/attachment/16130/f-bd25832f-8a70-4cc9-b75f-3aadf5d5f259/1/-/-/-/-/hydrogen-as-marine-
fuel-whitepaper-21111.pdf
16 Time series emissions data 1990 to 2019 from New Zealand's Greenhouse Gas Inventory published in 2021. Figures are
rounded to 1 decimal place. Available at: https://environment.govt.nz/publications/new-zealands-greenhouse-gas-inventory-
1990-2019/
17 https://www.mbie.govt.nz/building-and-energy/energy-and-natural-resources/energy-statistics-and-modelling/energy-
statistics/oil-statistics/
18 https://ccc-production-media.s3.ap-southeast-2.amazonaws.com/public/Inaia-tonu-nei-a-low-emissions-future-for-
Aotearoa/Inaia-tonu-nei-a-low-emissions-future-for-Aotearoa.pdf
Castalia 22
22
CastaliaCONFIDENTIAL
Figure 3.1: GHG emissions in New Zealand’s transport sector in 2019
Source: Ministry of the Environment, New Zealand’s Greenhouse Gas Inventory, 2021 and Ministry of Transport, Green Freight
Strategic Working Paper, 2020
3.1.1 Heavy-duty vehicles
Hydrogen fuel cell (HFC-EVs) heavy vehicles could play an important role in reducing emissions
by replacing fossil fuel in heavy-duty vehicles. Emissions from heavy-duty vehicles19 accounted
for 25 percent of total road transport emissions in 2019, and are predicted to account for 42
percent of total road transport emissions in 2050 under current policies.20 Table 3.1 details
New Zealand’s heavy-duty vehicle profile.
The uptake of HFC-EV heavy vehicles will depend on vehicle capital cost and the relative
energy costs of other technologies or availability of low-emissions alternative fuels.
Table 3.1: New Zealand’s heavy-duty vehicle profile (as of 2017)
Medium truck (under 10 tonnes) Heavy truck (over 10 tonnes)
Number 77,000 70,000
Billions of kilometres (km) 0.873 2.19
travelled
19 A heavy vehicle has a gross vehicle mass (GVM) of more than 3,500 kilograms. There are two classes of heavy vehicle:
▪ Medium goods vehicle (class NB)—a goods vehicle that has a gross vehicle mass exceeding 3.5 tonnes but not
exceeding 12 tonnes, and
▪ Heavy goods vehicle (class NC)—a goods vehicle that has a gross vehicle mass exceeding 12 tonnes.
https://www.nzta.govt.nz/vehicles/vehicle-types/heavy-trucks/
20 https://www.transport.govt.nz//assets/Uploads/Paper/Green-Freight-Strategic-Working-Paper_FINAL-May-2020.pdf, p.17
Castalia 23
23
CastaliaCONFIDENTIAL
Medium truck (under 10 tonnes) Heavy truck (over 10 tonnes)
Grams of Co2-e per km 530 1,420
kt CO2-e 463 3,115
Source: Adaptation from Ministry of Transport, Green Freight Strategic Working Paper (2020)
HFC-EV heavy vehicles can play a key role in the future transport sector
HFC-EVs could play an important role in decarbonising heavy vehicles, such as freight trucks,
semi-trucks, tractor-trailers, and other off-roading vehicles. Compared with other fuels, HFC-
EVs have high energy density, fast refuelling time (10-20 minutes) with a longer driving range
on a single tank (1,200 km)21, and are more fuel-efficient on undulating terrain.
HFC-EVs are likely to be the most viable option for class NC heavy-duty vehicles (vehicles
exceeding 12 tonnes), as well as the heavier vehicles in class NB.22 Vehicles on the lighter end
of class NB may have viable battery electric vehicle (BEV) options. HFC-EVs are currently
commercially available from companies including Hyzon Motors23 and Hyundai24, and are being
trialled by other companies such as Toyota.25 The application of the technology is currently
limited but is expected to grow in the near term.
BE heavy vehicles are the major competing technology and biofuel is a competing fuel source
BE heavy vehicles are the main competing technology to HFC-EVs for heavy vehicles. BEV
heavy vehicles currently have more efficient energy use than HFC-EV heavy vehicles, requiring
roughly one-third as much input. BE heavy vehicles are commercially available from companies
including Daimler and Chanje.26 However, heavy trucks are difficult to convert to BE if the
range and recharging time needs to match that of diesel trucks27. In addition, batteries are
heavy, which impacts payload and economics and takes up space that could otherwise be
reserved for freight.
Biofuel28 is a competing fuel source to hydrogen as an energy carrier. Conventional biofuel
blends as high as 20 percent (B20) can be used in some large trucks and coach buses.
Conventional biofuel blends above B20 tend to require engine modification.
21 https://www.transportenvironment.org/discover/comparing-hydrogen-and-battery-electric-trucks/
22 Class NB is a goods vehicle that has a gross vehicle mass exceeding 3.5 tonnes but not exceeding 12 tonnes, and class NC is a
goods vehicle that has a gross vehicle mass exceeding 12 tonnes.
23 https://hyzonmotors.com/vehicle/
24
https://www.hyundai.news/eu/brand/hyundai-xcient-fuel-cell-heads-to-europe-for-commercial-use/
Hyundai aims to have an HFC-EV in every part of its vehicle range by 2028 and state that HFC-EVs for heavy vehicles are a
gateway to other applications. Source: personal communication with hydrogen stakeholders.
25 https://global.toyota/en/newsroom/corporate/34009225.html
26 https://www.greenbiz.com/article/8-electric-truck-and-van-companies-watch-2020
27 Fueling the Future of Mobility (Deloitte China and Ballard), Fuel Cells and Hydrogen Applications for Regions and Cities Vol.2
(Roland Berger, 2017).
28
Biofuels are fuels made from renewable biomass, such as plant material. The most common biofuel is ethanol, which is a petrol
substitute, and biodiesel, which is a diesel substitute. https://www.mbie.govt.nz/dmsdocument/15020-increasing-the-use-of-
biofuels-in-transport-consultation-paper-on-the-sustainable-biofuels-mandate-pdf
Castalia 24
24
CastaliaCONFIDENTIAL
Advanced biofuels can be produced from a wider range of feedstock and present opportunities
to overcome the limitations of conventional biofuels. For example, some advanced biofuels are
‘drop-in fuels’, meaning they can be used in existing vehicles and fuel infrastructure without
modifications.29 100 percent biofuels (B100) are being developed and can be applied in heavy
transport applications. Major truck manufacturing companies like Scania are now producing
truck engines capable of running on B100.30 Trials using B100 in buses and heavy trucks have
been successful.31
Biofuels have the advantage of enabling decarbonisation of the current vehicle fleet, rather
than replacing vehicles before or after the end of their useful life. Biofuels are likely to play a
short-term role in reducing emissions from heavy vehicles until the current fleet is replaced.
Potential demand for biofuel for heavy-duty vehicles has been estimated at 4 percent of liquid
fuel demand in 2050.32 This demand means that biofuel could be cost competitive with
hydrogen in 2050. The supply of biofuel in New Zealand is likely to be limited unless imported
or second or third generation biofuels are developed and utilised. While supply remains
limited, it is uncertain whether transport or process heat will be the key user.
Vehicle capital cost and competitiveness of other technologies will be key determinants for HFC-EV heavy
vehicle uptake
The CCC predicts that of the trucks imported in 2030, 42 percent of medium trucks and 18
percent of heavy trucks would be an EV and/or HFC-EV. By 2035, this is expected to increase to
95 percent and 73 percent, respectively.33 HFC-EVs are likely to be the most viable option for
class NC heavy-duty vehicles (vehicles exceeding 12 tonnes), as well as the heavier vehicles in
class NB.34 Vehicles that are on the lighter end of class NB may have viable BE options.
The uptake of HFC-EV heavy vehicles is dependent on a range of factors:
▪ Technological development of electric battery and storage technologies for the
heaviest of vehicles, including longer range and faster charging time
▪ Capital cost of HFC-EVs heavy vehicles compared with BE heavy vehicles
▪ The cost of hydrogen fuel relative to electricity and biofuel
▪ Availability of biofuels for transport
▪ Access to refuelling and recharging infrastructure and time required to refuel or
recharge
29 https://www.mbie.govt.nz/dmsdocument/15020-increasing-the-use-of-biofuels-in-transport-consultation-paper-on-the-
sustainable-biofuels-mandate-pdf
30 https://www.mbie.govt.nz/dmsdocument/15020-increasing-the-use-of-biofuels-in-transport-consultation-paper-on-the-
sustainable-biofuels-mandate-pdf; https://www.truckinginfo.com/10146888/running-on-100-biodiesel-yeah-thats-happening
31 https://www.biofuel-express.com/en/biodiesel/
32 https://ccc-production-media.s3.ap-southeast-2.amazonaws.com/public/Inaia-tonu-nei-a-low-emissions-future-for-
Aotearoa/Inaia-tonu-nei-a-low-emissions-future-for-Aotearoa.pdf, p. 110.
33 https://ccc-production-media.s3.ap-southeast-2.amazonaws.com/public/Inaia-tonu-nei-a-low-emissions-future-for-
Aotearoa/Inaia-tonu-nei-a-low-emissions-future-for-Aotearoa.pdf, p.107
34 Class NB is a goods vehicle that has a gross vehicle mass exceeding 3.5 tonnes but not exceeding 12 tonnes, and class NC is a
goods vehicle that has a gross vehicle mass exceeding 12 tonnes.
Castalia 25
25
CastaliaCONFIDENTIAL
▪ Available supply of HFC-EV and BE heavy vehicles.35
3.1.2 Coach buses
Fuel Cell Electric Buses (FCEBs) could reduce emissions from passenger transport by replacing
fossil fuel powered buses. New Zealand had 11,500 coach buses in 201936, the majority of
which are powered by diesel.37 Emissions from buses accounted for approximately 2 percent of
total road transport emissions in 2019, and are predicted to account for approximately 5
percent of total road transport emissions in 2050 under current policies38 The CCC expects the
use of public transport to grow from around 3.5 percent in 2019 to 7.7 in 2030. The uptake of
this technology will depend on the cost-effectiveness of FCEBs and the competitiveness of
other technologies.
FCEBs can play a key role in bus travel from remote locations and in some metro applications
FCEBs can play an important role in decarbonising buses because they can match the
performance of conventional fossil fuel buses. FCEBs also have high fuel economy, fast
refuelling times (10 minutes), and have a longer driving range on a single tank than other low-
carbon alternatives.39 FCEBs are commercially available today, and more than 2,000 are
currently operating globally.40
Castalia modelling shows that FCEBs are likely to be most viable in New Zealand on long-haul
and remote routes and metro routes with high power requirements because they are long
and/or undulating.41 For example, RealNZ, a tourism operator in New Zealand, is focussing on
operating FCEBs and developing refuelling infrastructure for its lower South Island
operations.42 FCEBs also have performance advantages over BEBs in extreme heat or cold,
which may be relevant for some parts of New Zealand.
Castalia analysis of certain bus routes in and around Auckland suggests that a FCEB has a lower
cost compared to BEB for long and/or undulating routes. There is a trade-off between the
lower energy costs but charging downtime for BEBs, and the higher energy costs but superior
range and operating capacity for FCEBs.43 FCEBs may also be used for metro routes, depending
on cost competitiveness with BEBs. Auckland Transport will begin using an FCEB between
Howick and Britomart and may expand its FCEB fleet depending on how costs compare to
diesel and BEBs.44 Industrial gas manufacturer BOC is supplying hydrogen to the Ports of
Auckland Limited (POAL) transport refuelling demonstration project at its Glenbrook site, and
is urging the government to commit to a fleet of FCEBs.45
35 Stakeholders suggested that there is more demand for HFC-EV heavy vehicles than there is supply, and New Zealand is unlikely
to be a top priority country for supply without Government support or intervention. Source: Personal communication with
hydrogen stakeholders.
36 Used for public transport or tourism.
37 https://www.transport.govt.nz/statistics-and-insights/fleet-statistics/vehicle-fleet/
38 https://www.transport.govt.nz//assets/Uploads/Paper/Green-Freight-Strategic-Working-Paper_FINAL-May-2020.pdf p.17
39 http://www.chfca.ca/fuel-cell-electric-buses-fcebs/
40 http://www.chfca.ca/fuel-cell-electric-buses-fcebs/
41 Castalia analysis.
42 https://www.nzhydrogen.org/nz-hydrogen-projects
43 Castalia analysis.
44 https://at.govt.nz/about-us/news-events/new-zealand-s-first-hydrogen-fuel-cell-bus-unveiled/
45 Energy News, BOC seeks green H2 transport launchpad, 1 October 2021.
Castalia 26
26
CastaliaCONFIDENTIAL
BEBs compete with FCEBs on metro bus routes
BEBs are the main competing technology to FCEBs. BEBs perform similarly to fossil fuel buses
and, in some cases, are already more cost-effective on a total cost of ownership basis than
fossil fuel buses. The CCC expects a rapid switch to BEBs in the next ten years. BEBs are most
viable for replacing diesel buses on metro routes, where high power requirements are not
required. BEBs are commercially available and have been adopted globally, predominantly for
metro routes, with approximately 500,000 BEBs in operation.46 Metro buses are being
electrified in New Zealand. Auckland Transport launched its fully electric bus fleet in January
2021 (the AirportLink) and launched Waiheke’s electric bus fleet at the end of 2020.47
Despite uptake, BEBs have a shorter range than FCEBs and diesel buses, and require charging
downtime. Using BEBs change the logistics of operating a bus fleet. BEBs will also necessitate
significant electrical infrastructure (for example, multiple MW depending on the size of the
depot), which can be cost-prohibitive. These factors can skew the total cost of ownership
depending on the fleet and individual use case. Some bus transport providers may require
flexibility that FCEBs offer, which BEBs do not have. Transport providers may use a
combination of FCEBs and BEBs.
Cost-effectiveness and competitiveness of other technologies will be key determinants for FCEB uptake
FCEBs will likely replace fossil fuel buses taking long, remote, and undulating routes and will
possibly make up a part of a zero-emissions metro bus fleet (along with BEBs). The uptake of
FCEBs in these specific applications is dependent on a range of factors:
▪ Technological development of electric battery and storage technologies for buses,
including longer range and faster charging time
▪ The capital cost of vehicles and infrastructure and cost-effectiveness over the lifetime
of an FCEB compared with a BEB
▪ Access to refuelling and recharging infrastructure and time required to refuel or
recharge
▪ The cost of hydrogen fuel relative to electricity.
3.1.3 Speciality vehicles
HFC-EVs could play an important role in reducing emissions from speciality vehicles requiring
high energy density and continuous power for long periods, such as excavation vehicles used in
mining operations, large forklifts, cranes, straddle carriers at ports and other large off-road
vehicles.
High emitting sectors such as mining and ports use specialty vehicles. HFC-EVs can support
high emitting sectors to reduce overall emissions and decrease abatement costs. There are
approximately 6,900 speciality vehicles in New Zealand.48 Speciality vehicles use approximately
275 million litres of diesel per year.49 The mining and quarrying sector uses 82 million litres of
46 https://about.bnef.com/electric-vehicle-outlook/?sf122680186=1
47 https://at.govt.nz/about-us/news-events/new-zealand-s-first-hydrogen-fuel-cell-bus-unveiled/
48 Castalia analysis.
49 Castalia analysis, supported by EECA data. Available at: https://www.eeca.govt.nz/assets/EECA-Resources/Research-papers-
guides/Off-road-liquid-fuel-insights.pdf
Castalia 27
27
CastaliaCONFIDENTIAL
diesel per year.50 The building and construction sector uses approximately 193 million litres of
diesel per year51 CCC modelling suggests that meeting the 2050 targets will require abatement
costs of NZ$150 per tonne of emissions in 2035 and NZ$250 per tonne of emissions in 2050.
The uptake of this technology will depend on vehicle capital cost and availability and
competitiveness of other technologies.
HFC-EV speciality vehicles can play key role in the decarbonising speciality vehicles
HFC-EVs speciality vehicles could play an important role in reducing emissions from speciality
vehicles such as excavation vehicles, rubbish trucks, forklifts, straddle carriers, and cranes.
HFC-EVs speciality vehicles are useful in locations where hydrogen can be produced and
vehicles refuelled at sites such as mines and ports. HFC-EV excavation vehicles can replace
diesel power reliance for above ground and underground mining vehicles. The vehicles are
currently in prototype and will likely be available for purchase from 2023 onwards.52
Hydrogen-diesel combustion excavation vehicles are also being explored as an alternative
pathway to create the demand for HFC-EV excavation vehicles and other industrial vehicles.
HFC-EV forklifts are commercially available, with more than 25,000 units (of varying classes) in
operation globally. HFC-EV forklift technology is developing rapidly to improve run-time and
performance to match or exceed internal combustion engine (ICE) forklifts, which is expected
to increase use of technology. HFC-EV forklifts are expected to be competitive over BE
alternatives in big distribution centres running multi shifts. HFC-EV forklifts have relatively fast
refuelling time (approximately three minutes) and longer run time than BE alternatives. HFC-
EV forklifts, therefore, do not require operators to replace batteries during a shift, which is
often required for BE alternatives.53 The operation of HFC-EVs forklifts is also not affected by
diminishing battery charge. HFC-EVs remove the requirement of extra recharging
infrastructure and battery swapping processes.
HFC-EV cranes are also being developed and will be particularly important for reducing
emissions from hard to abate machinery. For example, an HFC-EV rail crane is deployed at
China’s Qingdao port54 and POAL is developing a hydrogen fuel production plan, which
includes the use of HFC-EV forklifts and cranes.55 HFC-EV straddle carriers are also being
developed.56
HFCs can also provide stationary energy supply at high emitting locations
HFCs may also be used as stationary energy supply at high-emitting locations, such as at ports
for docked ships, or at airports for backup power. Docked ships contribute to emissions by
running diesel power for essential systems while at berth. HFCs can replace on-board diesel
generators, or auxiliary or main engines. Sandia National Laboratories found that HFCs may be
50 Diesel in this sector is predominantly used by dump trucks, loaders, specialist drilling equipment, and processing and crushing
equipment.
51
Diesel in this sector is predominantly used by excavation equipment such as diggers, scrapers, and bulldozers, as well as heavy
trucks over 3.5 tonnes, and utes, and light-duty vehicles.
52 https://www.constructionequipment.com/hyundai-develop-hydrogen-powered-eqpt
53 Personal communication with industry stakeholders.
54 https://fuelcellsworks.com/news/worlds-first-hydrogen-powered-5g-port-put-into-service/
55 https://www.stuff.co.nz/auckland/109042288/ports-of-auckland-plans-hydrogen-fuel-plant-to-power-forklifts-and-cars
56 https://www.worldcargonews.com/news/news/new-straddle-carrier-from-zpmc-68000
Castalia 28
28
CastaliaYou can also read


