North Pacific warming shifts the juvenile range of a marine apex predator
←
→
Page content transcription
If your browser does not render page correctly, please read the page content below
www.nature.com/scientificreports
OPEN North Pacific warming shifts
the juvenile range of a marine apex
predator
Kisei R. Tanaka1,5*, Kyle S. Van Houtan1,2, Eric Mailander1, Beatriz S. Dias1,
Carol Galginaitis1, John O’Sullivan1, Christopher G. Lowe3 & Salvador J. Jorgensen1,4*
During the 2014–2016 North Pacific marine heatwave, unprecedented sightings of juvenile white
sharks (Carcharodon carcharias) emerged in central California. These records contradicted the
species established life history, where juveniles remain in warmer waters in the southern California
Current. This spatial shift is significant as it creates potential conflicts with commercial fisheries,
protected species conservation, and public safety concerns. Here, we integrate community
science, photogrammetry, biologging, and mesoscale climate data to describe and explain this
phenomenon. We find a dramatic increase in white sharks from 2014 to 2019 in Monterey Bay that was
overwhelmingly comprised of juvenile sharks < 2.5 m in total body length. Next, we derived thermal
preferences from 22 million tag measurements of 14 juvenile sharks and use this to map the cold limit
of their range. Consistent with historical records, the position of this cold edge averaged 34° N from
1982 to 2013 but jumped to 38.5° during the 2014–2016 marine heat wave. In addition to a poleward
shift, thermally suitable habitat for juvenile sharks declined 223.2 km2 year−1 from 1982 to 2019 and
was lowest in 2015 at the peak of the heatwave. In addition to advancing the adaptive management
of this apex marine predator, we discuss this opportunity to engage public on climate change through
marine megafauna.
Marine ecosystems are exhibiting major ecological realignments in response to climate c hange1,2. Even though
all species and taxa are influenced3, it has been argued that prioritizing attention to marine megafauna may help
increase public concern and engagement to combat climate c hange1,4. However, the swift pace of changes in the
ocean has driven a corresponding rapid shift in the distribution of marine megafauna5,6. As a result, a combina-
tion of conventional techniques as well as innovative and adaptive strategies for monitoring these species are
needed. Such advances may also serve to help understand the broad and cascading consequences of our rapidly
warming ocean to local ecosystems, communities and economies.
Except for rare instances7, adult white sharks (Carcharodon carcharias) are apex predators throughout their
distribution8. Most juvenile sharks (< 2.5 m total body length: TBL)9–11 reside in coastal nursery areas12. In the
northeastern Pacific this demographic consists of neonates (< 1.50 m TBL), young-of-year (“YOY”, < 1.75 m
TBL), and other juveniles (< 2.5 m TBL) which primarily use coastal waters of northern Mexico and south-
ern California13,14. A lack of confirmed observations beyond this region suggests the Southern tip of the Baja
peninsula approximates their southernmost range. Within this region, juveniles remain in a relatively narrow
temperature band, a pattern which is consistent across distinct white shark p opulations15. Even though white
sharks are endothermic, greater surface-to-volume ratios in these juveniles may challenge their thermal inertia
and ability to thermoregulate especially at the cold limit of their thermal habitat. As a result, the thermal range
of juvenile white sharks is likely a major driver of the habitats they occupy, and this appears to be sensitive to
climatic shifts during El Niño e vents15.
Ecosystems in the Northeast Pacific experienced extreme conditions over the past decade, highlighted by
anomalously warm conditions from 2013 to 2 01616,17. A warm mass of surface water described both as the
Pacific Warm Anomaly and “the Blob” entered southern California in the fall of 2 01416 and resulted in persistent
warm-water conditions that endured to the 2015–2016 and 2018–2019 El Niño e vents18. Record-high sea surface
temperature (SST) was observed in the area between Point Conception (34.4° N, 120.5° W) and San Miguel Island
1
Monterey Bay Aquarium, Monterey, CA 93940, USA. 2Nicholas School of the Environment, Duke University,
Durham, NC 27708, USA. 3Department of Biological Sciences, California State University Long Beach, Long Beach,
CA 90815, USA. 4Present address: Institute of Marine Sciences, University of California, Santa Cruz, CA 95064,
USA. 5Present address: Pacific Islands Fisheries Science Center, National Oceanic and Atmospheric Administration,
Honolulu, HI 96818, USA. *email: kisei.tanaka@gmail.com; salvador.jorgensen@gmail.com
Scientific Reports | (2021) 11:3373 | https://doi.org/10.1038/s41598-021-82424-9 1
Vol.:(0123456789)www.nature.com/scientificreports/
juveniles
a b subadult c 1
yoy
.8
frequency
.6
.4
modeled .2
validated
0
1 2 3 4 2010 2012 2014 2016 2018
straight length (m)
2014 2015 2016 2017 2018 2019
d 37°n
Monterey Bay, Calif
36.8
36.6
“Shark Park” 36.4 n=1 n=6 n=4 n=10 n=13 n=19
Aptos, Monterey Bay, Calif 122°w
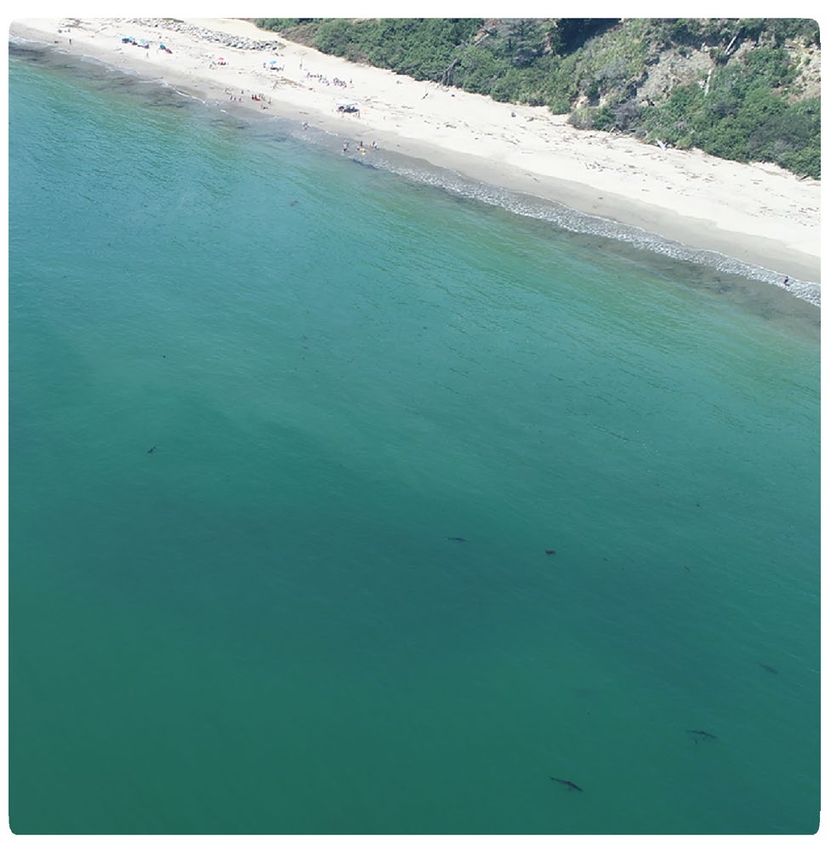
Figure 1. Juvenile white sharks became abundant in Monterey Bay during the 2014–2016 marine heatwave. a
Aerial drone image detecting 6 small white sharks (denoted by white arrows) in September 2019 near Seacliff
State Beach (36.97° N, 121.93° W). b Size composition from observer logbooks (n = 403) and photogrammetry
validated measurements (n = 65) indicate the vast majority of sharks in this area are juveniles, with fewer
subadults, and a small minority of young-of-the-year (“YOY”). c, Ensemble time series of Juvenile and YOY
white shark abundance in Monterey Bay, from observer logbooks and a community science project with
iNaturalist. A smoothing spline (solid line, shaded area is SE) summarizes the trend of each rescaled series,
showing a constant increase in abundance from 0 juvenile and YOY sharks before 2014 to a peak in 2019. d
Mapped iNaturalist positions of juvenile and YOY white sharks show a concentration in northern Monterey Bay
near Aptos.
(34.04° N, 120.37° W), where nearshore SST reached a peak of 6.2 °C above the historical average in September
201519. The multiyear warm anomalies caused widespread species s hifts20,21, epizootics22, multiple unusual mor-
ieoffs23–26, and broad impacts to commercial fisheries27 across the region.
tality events and d
Concurrent with these ecologically significant warm-water events, local communities around the Mon-
terey Bay (36.8° N, 121.95° W) began reporting small white sharks < 2.5 m TBL in nearshore Monterey Bay
proximate human activities (Fig. 1a). Though juvenile white sharks 2.5–3.0 m TBL are detected north of Point
Conception13,14,28, neonate, YOY, and other juveniles < 2.5 m TBL sharks in the Monterey Bay remained non-
existent or extremely rare until 2 01415. Partly in response to these events, and out of concern for public safety at
beaches, in 2018 the California State Senate passed funding measures (SB 840) to expand population monitor-
ing of white sharks at popular recreation a reas29. In addition to such traditional and official wildlife monitoring
programs, community science initiatives are becoming a viable source of in situ data that can document and
reflect changes in realized species d istributions30,31. As nearshore monitoring programs have only recently been
implemented, incorporating community science data streams can improve our emerging understanding of the
ecological relationship between climate and juvenile white sharks in the Northeast Pacific.
In this study, we integrate community science initiatives, decadal biologging efforts, and mesoscale envi-
ronmental data to provide a detailed assessment of the thermal preferences of juvenile white sharks in the
Northeastern Pacific. We build a thermal suitability model and use this to calibrate the cold edge of their thermal
range and track its position as well as their total available thermal habitat area from 1980 to 2019. We hope that
this helps to both describe and explain the documented range shift of juvenile white sharks since the 2014–2016
marine heatwave and provides a useful road map for the synthesis of multiple data streams that should advance
the use of marine megafauna as sentinels of climate change.
Results
Though subadult (> 3.0 m TBL) and adult (> 3.8 m for males, > 4.5 m TBL for females) white sharks are common
residents of central California and Monterey Bay7,14,32, juveniles have been increasingly detected (Fig. 1) since the
2014–2016 marine h eatwave16. Photogrammetry validated observations and modeled observer records indicate
that juveniles < 2.5 m TBL comprise 92.3% and 64.7% of the observed white sharks, respectively, at the primary
aggregation site (Fig. 1b). An ensemble index (Fig. 1c) indicates juvenile white shark abundance increased from
2014 to 2019, concentrated in northern Monterey Bay (Fig. 1d). These data combine observer records from
recreational fishermen and a community science project, highlighting the value of public engagement in wildlife
monitoring and coastal management.
Scientific Reports | (2021) 11:3373 | https://doi.org/10.1038/s41598-021-82424-9 2
Vol:.(1234567890)www.nature.com/scientificreports/
a
1
b 1 c average
binary
0.5
rescaled occupancy
d std dev
.1
0.5
continuous
0
e .6 coeff var
.4
.2
0 0
10 12 14 16 18 20 22 24 0 20 40 60 80 100
temperature (°C) depth (m)
Figure 2. Derived thermal suitability of juvenile white sharks from time-depth recorders. All data are derived
from onboard sensors from electronic tags on 14 juvenile white sharks deployed from 2001 to 2019 in southern
and central California (Table S1, Figure S1). a Summary boxplot where the blue box is the core 50% interval,
whiskers are the 95% interval, and hollow circles are extreme temperature values. b Binary (green line) and
continuous model (blue histogram) of thermal occupancy. Binary model is the realized thermal limit based
on the occupancy-weighted 95% interval (15.1–21.9° C). The continuous model reports thermal occupancy
continuously, rescaled from the time-at-temperature histogram (Figure S4), here binned every 0.5° C. a,b were
calculated from temperatures sensed at 0–20 m depths, a criterion determined from the natural breaks in the c
average, d standard deviation and e coefficient of variation of time-at-depth between individual sharks.
a
38
b
38
(°N)
37
2014-20 mean
36 36
35
Jan−Dec
34
34 1982-2013 mean 33
r2 = 0.69
32
30 31 32 33 34 35
32
1990 2000 2010 2020
Figure 3. The cold range edge migrates poleward during the 2014–2016 North Pacific heatwave. a Annual
mean position (filled circles) of the daily center of gravity for the cold edge of the binary thermal suitability
model (Fig. 2b) over 1982–2020. The 1982–2013 mean position (blue line) at 34.0° N is near Point Conception
(34.4° N), and consistent with historical records that juvenile white sharks largely remaining below this
landmark. The 2014–2020 mean position (red line) at 36.4° N is consistent with juvenile white sharks being
common in northern Monterey Bay (36.9°N) during that time. b Full-year forecast for 2020 (hollow circle in
a) was calculated from the available Jan-Apr data, and the linear relationship ( r2 = 0.69, p < 0.001) between this
value and the full year using 1982–2019 records.
Scientific Reports | (2021) 11:3373 | https://doi.org/10.1038/s41598-021-82424-9 3
Vol.:(0123456789)www.nature.com/scientificreports/
b 20 37.8-47.4 °N
a 200 California Current LME (22.9-47.4 °N, 1000 m. a Across the entire LME the linear change is − 223.2 km2 year−1. b In the northern region (San
Francisco to the LME northern boundary) the linear change is + 58.3 km2 year−1, c in central California (Point
Conception to San Francisco) there is negligible change (− 3 km2 year−1), and the historical juvenile white shark
range (southern LME boundary to Point Conception) contracts − 275.2 km2 year−1. While the 2014–2016 North
Pacific marine heatwave shifted the thermal habitat poleward (Fig. 3) total available habitat during this time was
nearly the lowest recorded. Latitudinal break points in panels a–d represents north–south extent of California
Current LME, San Francisco to the California LME northern boundary, Point Conception to San Francisco, and
southern California Current LME boundary to Point Conception.
More than 22 million continuous temperature and depth records from 14 electronic tags reveal the tem-
perature preferences of juvenile white sharks (Fig. 2). Simple boxplots (Fig. 2a) and binary models (Fig. 2b)
of thermal preferences provide succinct data summaries (min = 10.5 °C, max = 24.7 °C, median = 16.7 °C, 95%
interval = 15.1–21.9 °C). Comparing the mean, SD and CV of the cumulative time spent at ≤ n depths between
tagged sharks reveals a common break at 20 m and suggests that records from 0 to 20 m broadly constitute near-
surface behavior (Fig. 2c-e). A continuous thermal suitability model from these pooled (n = 14 sharks) records at
0–20 m depth provides a detailed thermal habitat for juvenile white sharks consistent with previous independent
studies13,15 in the Northeast Pacific population (Fig. 2b).
Cold range edges have been shown to closely track how marine fishes respond to climate change33. The center
of gravity of the cold edge (tlat) of the continuous thermal suitability model varied considerably from 1982 to 2019.
This value had its lowest position in 2008 at 32.0° N, and most northerly position in 2015 at 38.5° N (Fig. 3a).
From 1982 to 2013, our models indicate that the mean cold edge position was 34.0° N. This is remarkably consist-
ent with historical population accounts32 that juvenile white sharks largely remained south of near Point Concep-
tion (34.4° N)13,14. Point Conception is a terrestrial headland and is considered a marine biogeographic boundary
that sharply separates the warmer waters of the southern California bight, from the northern remnant of the
California Current Ecosystem. From 2014 to 2020, the mean position moves 240 km north of Point Conception
to 36.3° N. Regression analyses revealed that the Jan-Apr tlat played a statistically significant role in determining
the Jan-Dec tlat (mean Jan-Apr/Jan-Dec ratio = 0.95, r2 = 0.69, p < 0.001; Fig. 3b), allowing us to forecast tlat in 2020
at 35.34°N. This poleward thermal habitat shift accompanies the 2014–2016 marine h eatwave16 and is consistent
with the emergence of juvenile white shark observations in northern Monterey Bay (Fig. 1).
Though the juvenile white shark thermal habitat migrated poleward from 1982 to 2019, the overall available
habitat declined. Consistent with previous tagging s tudies12,14,15, regions with the highest thermal suitability were
located in the Southern California Bight (“SCB”) and northern Baja California (Figure S6). During our study, the
median annual thermal habitat area in the Northeast Pacific was 175,138 km2, following a quasi-decadal oscilla-
tion, and contracting 223 k m2 annually (Fig. 4a). The lowest daily habitat available we observed occurred on 15
September 2015 (59,030 k m2, Figure S6) during the peak of the heat wave event, when the 5-day SST anomaly
reached a maximum of + 6.2 °C19. In our 38-year data series, the 7 days with the smallest recorded available habitat
occur in the last 5 years, from 2015 to 2019 (Table S2). Temporal trends in the historical (− 275.2 k m2 year−1),
emergent (− 2 km2 year−1), and future (+ 58.3 k m2 year−1) habitat regions of juvenile white sharks vary (Fig. 4b-
d). Together, however, the net effect of these changes is the poleward expansion and spatial contraction of the
thermal habitat consistent with warming (Figure S7).
Discussion
Climate change is redistributing marine species and ecosystems, completely altering the present and future out-
look of commercial and protected s pecies6,20,34. Understanding how particular species are affected by climatic
changes, however, requires first deriving their habitat and association with environmental conditions empiri-
bservations35,36. Our objective in this study was first to generate a local index of abundance that
cally through o
may describe the recent emergence of juvenile white sharks in Monterey Bay (Fig. 1) and second to examine
Scientific Reports | (2021) 11:3373 | https://doi.org/10.1038/s41598-021-82424-9 4
Vol:.(1234567890)www.nature.com/scientificreports/
whether this might be consistent with movements of their thermal habitat cold edge (Fig. 3). The Monterey
Bay ecosystem is roughly 2.5° north (~ 600 km linear coastline or ~ 280 km straight line) of what historically
has been considered beyond the northerly range limit of juvenile white sharks < 2.5 m TBL in the Northeast
Pacific population13–15. The increasing presence of this demographic since 2014 in this novel region therefore
represents a major geographic shift that carries significant ecosystem consequences. This is further important
as juvenile sharks typically remain spatially segregated from adults in geographically distinct nursery a reas12,13.
However, future climate projections of the California Current system6 suggest this shift and contraction might
be an enduring pattern that is here to stay. Future studies that incorporate population dynamics37 will be help-
ful in further elucidating the long term impacts of N Pacific warming to the changing habitat suitability of the
California Current LME for juvenile white sharks.
White sharks appear to exhibit an ontogenetic shift at the age of 3–4 years, at 2.5–3 m TBL, resulting in
habitat as well as dietary changes14. Piscivorous juveniles were historically restricted to the warm coastal waters
in the far southern region of the California Current system (22–34° N; see Figure S5). Juvenile and subadult
white sharks typically transition to the colder California waters to the north where they seek larger, energy-rich
prey including pinnipeds and stranded cetaceans14,38,39. The northward expansion of the thermal habitat for
piscivorous juvenile white sharks therefore can alter the established predator–prey relationship along California
coastal environments, potentially introducing a new source of natural mortality to commercial forage fish and
threatened salmonid populations in central C alifornia40. Beyond novel impacts to fish populations and fisher-
ies, there may also be implications for protected species conservation and nearshore ecosystem dynamics. The
chronology of the poleward shift in juvenile white sharks that we describe here corresponds with, and may help
explain, a significant increase in Southern sea otter (Enhydra lutris nereis) mortality from white shark b ites39.
As the Southern sea otter population today is distributed from 34 to 37° N 41, sea otters have not substan-
tially overlapped with juvenile white sharks for a century or l onger42. However, the extensive record of sea otter
strandings with shark bite wounds today represents the single greatest mortality source facing the threatened
species41,43,44. This is significant as it poses a risk to the ecosystem benefits that sea otters provide to nearshore
ecosystems45,46 as well as to sea otter conservation programs that are actively working to recover otter populations
and restore their ecosystem f unctions47,48. Since 2010, shark related otter strandings have been on the rise and
initially the seasonal pattern of their occurrence overlapped with, and implicated, adult white sharks arriving in
Central California for their annual fall foraging m igration39,49. Since 2012, however, sea otters are being bitten
by white sharks throughout the calendar year39, including the spring and summer months when adults white
sharks are largely absent from the Central California coast49. At the same time, the significant loss of Macrocystis
and Nereocystis kelp forest canopies in California has removed sheltering habitats and exposed otters to ambush
predators like white sharks41.
While these factors working together might explain the increase in shark bites to otters throughout their
range, it does not explain why juvenile white sharks, including YOYs, are now in Monterey Bay (Fig. 1). To
support this, we note two additional facts. First, while white sharks bite sea otters, these encounters are non-
consumptive, presumed investigative, and do not have any function as forage since otters insulate with fur rather
than blubber39. Therefore, sea otters are not a food source for any life stage of white sharks and present no mecha-
nism to explain juvenile white shark range expansion. The second is that while California sea otter population
grew substantially from 1989 to 2014 and expanded their geographic range, the sea otter population density
in northern Monterey Bay (where we documented the recent increase in juvenile white sharks) was essentially
unchanged during this period41. Rather, our tag-derived calculation of the cold edge of the juvenile white shark
thermal habitat, and its poleward shift since the 2014–2016 heatwave provide a more compelling explanation of
the poleward shift in these endotherms at a younger age than previously recorded.
The growing presence of juvenile sharks above 34° N suggests that climate change may be revising basic
aspects of the established spatial population structure for this white shark population, and perhaps others. The
occurrence of YOY sharks in Monterey Bay after 2014 (Fig. 1b-c) may reflect local pupping or YOYs traveling
from a distant southern nursery area. While we cannot resolve this question in the present study, it is likely that
Monterey YOYs immigrated from an emergent white shark nursery in the Southern California Bight, 600 km
to the south. Preliminary acoustic records further indicate YOYs have migrated to Monterey Bay (O. Sosa pers.
comm.) from the Bahia Sebastian Vizcaino nursery area in M exico12 (28.6° N, 114.84° W) 1,300 km south of
Monterey Bay. Though juvenile white sharks < 2.5 m TBL have a clearly defined thermal affinity (Fig. 2), the role
of recurring seasonal migrations and behavior is unresolved. In addition, though our mesoscale model output
(Fig. 3) successfully predicts the timeline of juvenile white sharks in Monterey Bay, these sharks may not continu-
ously occupy the entire corridor of their thermal habitat. Rather, juvenile white sharks appear to be congregating
in a single location in northern Monterey Bay (Fig. 1d), a sheltered bight typified by exceptionally warm water
temperatures50. Targeted in-water monitoring combined with electronic tagging and fine scale environmental
modeling should help resolve such questions.
Our results also indicate an overall compression of thermal habitat for juvenile white sharks from 1982 to
2019, particularly in the southern portion of the range (Fig. 4a,d). During this period, there is an apparent growth
of habitat at the northern edge of the California Current system and dominant reduction of suitable habitat
in the south (Fig. 4b-d). This growth captures a region of suitable habitat that has been isolated by a 1,000 km
expanse of inhospitably cool water (Figure S5) and is therefore disconnected and inaccessible to juveniles from
the southern range. While the 2014–2016 North Pacific marine heatwave resulted in the smallest juvenile habi-
tat area that we observed (Fig. 3), there may be cascading effects beyond white sharks. Finer scale analyses, for
example, show that such extreme events compress multiple populations in high densities into confined regions,
impacting commercial fisheries and protected s pecies51.
While we have demonstrated that juvenile white sharks have experienced a dramatic range shift in recent
years, corresponding to and seemingly the result of the rapid warming of the California Current, a remaining
Scientific Reports | (2021) 11:3373 | https://doi.org/10.1038/s41598-021-82424-9 5
Vol.:(0123456789)www.nature.com/scientificreports/
question is whether the proposed patterns are the result of human-caused global warming. Anthropogenic cli-
mate change is considered the primary driver of rapidly increasing upper ocean heat content52. This increased
heat correspondingly impacts global ecosystems through changes in both mean climatic conditions and cli-
matic variability3. however, species typically respond more strongly to extremes than gradual changes in mean
conditions53. In reality, both are occurring simultaneously, there is both a synoptic increase in mean temperatures
coinciding with anomalously warm and extreme events2,54,55. Marine heatwaves like the 2014–2016 event in
the North Pacific are prolonged, more frequent, and made more intense with anthropogenic climate c hange55.
The emergence of juvenile white sharks in Monterey Bay was unexpected, sudden, and outpaced established
scientific monitoring programs. As a result, we developed an index of abundance from community science and
recreational fishery records and our project highlights the strategic importance of such initiatives. While many
shark populations are threatened and data p oor56, dedicated fishery-independent monitoring programs face many
logistical challenges57. Therefore, there is a critical need to incorporate innovative and open-access alternatives to
supplement population monitoring, especially at spatial scales relevant for particular management concerns58,59.
In this vein, community-based biodiversity monitoring may provide an efficient and nimble alternative to more
conventional wildlife monitoring programs. For marine megafauna, community science programs have helped
document range shifts due to climate change aiding wildlife life managers with important, low cost information
about species and their m ovements39,41,60,61. Since many community science records are often opportunistic and
lack standardized sampling p rotocols62,63; however, they frequently require post-hoc treatments (see Methods)
for quality assurance, formal scientific analysis and management interpretation. Nonetheless, such data streams
may have great utility in filling data gaps, providing novel insights and perhaps helping prioritize research infra-
structures and resources where there are emerging needs. Beyond providing data, community science initiatives
hold additional value as they help to generate public engagement that can increase stakeholders and support
for conservation30.
Methods
White shark observations. We compiled white shark abundance and length observations from field sur-
veys and by curating a community science project. From 2009 to 2019, one of us (EM) kept detailed logbook
records of white shark observations during 198 recreational trips in Monterey Bay. With minor variations, all
trips used the same vessel (Davis Cortez, Radoncraft, 22′), began and ended in the same port (Moss Landing
harbor, 36.80° N, 121.78° W) and followed a similar transect path to a shipwreck reef (SS Palo Alto, 36.96°
N, 121.91° W) during daylight hours. From 2009 to 2014, as sharks were uncommon, 1–2 observers manu-
ally counted and photographed sharks as they basked near the surface. From 2015 to 2019, observers used a
boat-based aerial drone (DJI Phantom4 Pro, 20Mp camera, 4 K video) operating at < 120 m altitude (FAA#
FA3T3FRLF7) to photograph and count sharks and estimate body lengths near the shipwreck reef. Logbooks
recorded the total number of sharks sighted per trip, and when available listed minimum (min) and maximum
(max) lengths for outliers. As a standard metric of shark abundance, we calculated from these records the total
number of white sharks observed per trip.
To understand size composition, we developed a bootstrapping procedure to expand the sparse logbook
records using random variates to account for measurement error. For each shark length measurement, this
routine generated 1000 random variates from a normal distribution with parameters μ and σ. Given our (EM)
anecdotal observations that 80% of the sharks during the study measured 2.1–2.7 m, we ran 800 of the simula-
tions with μ = 2.3 and σ = 1, and the remaining simulations with σ = 1 and where μ was equally split between min
and max recorded lengths. On 9 trips in 2018–2019, we validated shark length estimates with photogrammetry,
using drone surveys to capture reference lengths placed alongside surface basking sharks. We plotted the modeled
length density (n = 403 sharks) against the photogrammetry-validated length density (n = 65 sharks), comparing
both to accepted length-stage categories for Northeast Pacific white s harks12,15.
As an independent measure of juvenile white shark abundance in Monterey Bay, we sought public observa-
tions through a community science project. Using the iNaturalist p latform64, we individually curated user-sub-
mitted, geo-referenced images that had previously been taxonomically verified by the iNaturalist user community.
From a total of 72 contributed observations excluded subadult and adult (> 3 m TBL) demographics, as well as
sharks occurring north of Monterey Bay. This yielded 53 quality-checked and vetted observations from 2012 to
2019 (available at: https://bit.ly/2Px15zo). We report abundances as observations y ear−1, rescale both these and
the logbook abundance data from 0 to 1, and fit a single loess model61 to both data series as an ensemble index
of white sharks in Monterey Bay.
Deriving thermal suitability models. A two decade biologging program provided a robust data series
of the three-dimensional movements and the thermal affinity of juveniles (including neonates, YOY, and small
juveniles; 1.4–2.0 m TBL; see Table S1) white sharks in California14,15,60. Juvenile white sharks experience a wide
temperature range (6–26 °C) throughout the water column while occupying a more specific band (16–20 °C)
of preferred temperatures15. We quantified observed species occupancy-temperature relationships using both
binomial and continuous thermal suitability models. We used temperature data from pop-up archival tags (PAT,
Wildlife Computers) deployed on 14 white sharks deployed from 2001 to 2015 (see Table S1, Figures S2 & S3)15,60.
Deployments originated in the Southern California Bight (SCB), but sharks subsequently ventured throughout
their historical range, broadly reflecting the thermal preference of this demographic in the Northeast Pacific.
To capture accurate behaviors, we applied a number of routines to the raw tag data. First, we excluded all
tag records both before tag deployment and after tag detachment. Next we applied a correction to the depth
series to account for drift in the mechanical pressure sensor following previous s tudies65. Building on previ-
ous approaches15, we determined juvenile surface temperature preferences by analyzing time spent over the
Scientific Reports | (2021) 11:3373 | https://doi.org/10.1038/s41598-021-82424-9 6
Vol:.(1234567890)www.nature.com/scientificreports/
tag-derived temperature gradient. We derived the vertical window considered to encompass surface behavior
from a combination of oceanography and behavior. In the California Current system, the mixed layer depth
is generally below 50 m, above which temperatures are well mixed21. We calculated the cumulative time each
individual shark spent at depths ≤ n m, where n ranged from 0 to 287 m, the observed extremes. To account for
individual variability, we then computed the mean, standard deviation (SD), and coefficient of variation (CV)
among individuals for each depth and compared the form of these curves across depths. Natural breaks in the
mean, SD and CV curves determined the depths considered to include near-surface behavior.
We used the empirical temperature records observed at these tag depths to generate a thermal suitability. Tag
deployments were seasonally variable and duration less than one year (mean ± SD: 117.5 ± 80 days). To avoid
individual and seasonal biases, we equally weighted observations from each month and each tag, aggregating the
observations (n = 2.28 × 10⁷) in 0.5° C bins over the recorded temperature gradient (10.6–24.7 °C, see Figure S4).
The binary thermal suitability model is the upper and lower thermal limits based on the occupancy-weighted 95%
interval, calculated using the R reldist package66. The 2.5 quantile from this model determined the cold edge of
the juvenile white shark thermal habitat. The continuous thermal suitability model provides a continuous thermal
habitat suitability (from 0 to 1), yielding more discriminating and precise preferences across all temperatures.
Determining range limits and habitat availability. Having derived a thermal suitability for juvenile
white sharks, we compiled SST observations in the Northeast Pacific from 1982 to 2019 to assess thermal habitat
availability (Figure S5). NOAA’S daily Optimum Interpolation Sea Surface Temperature (OISST.v2, 0.25°) inte-
grates SST records from multiple (satellite, vessel, buoy) platforms providing historical environmental data from
September 1981 to April 202067,68. Following previous approaches15,69, we trimmed these SST data to 0–1000 m
depths to avoid nearshore masking of environmental data products using GEBCO bathymetry d ata70.
We tracked the northern range limit (tlat) for juvenile white sharks by calculating the latitudinal center of
gravity71 of the cold edge of the realized thermal niche through time, using the formula:
k
(lat i × ti )
tlat = i=1 k
i=1 ti
where lati are for OISST.v2 grid i; ti denotes a calculated binary cold-edge index (0 or 1) at OISST.v2 grid i, and
k is the total number of OISST.v2 cells (n = 657) in the raster grid. As 2020 records were incomplete at the time
of this analysis, we extrapolated its value (tlat_2020) based on the partial (Jan-Apr) to full (Jan-Dec) year relation-
ship of tlat from 1982 to 2019. We average tlat_2020 from two methods—the mean annual value of the Jan-Apr tlat
/ Jan-Dec tlat quotient and a simple linear regression.
We combined the continuous thermal suitability model and the OISST.v2 data to calculate the availability of
juvenile white shark habitat over time. For each daily OISST.v2 raster, we converted the SST values in each cell
with the model derived thermal suitability. We rescaled the rasters to 0–1 and multiplied the resulting value by
cell area (range 522–710 km2), summing all raster values. This provides a daily assessment of available habitat
that is thermal suitability-weighted according to tag-derived occupancy. We summarized available habitat in
three relevant regions of the California Current Large Marine Ecosystem (LME). These areas reflect the histori-
cal range (22.9–34.4° N, south LME boundary to Point Conception), the emergent range (34.4–37.8° N, Point
Conception to San Francisco), and perhaps the future range (37.8–47.4° N, San Francisco to the north LME
boundary). All analyses and visualizations were conducted in the R e nvironment72.
Data availability
All data used in this study are available at a third-party open access repository (https://osf.io/vcwjp/) and at
GitHub (https://bit.ly/3mCzlbF).
Received: 23 August 2020; Accepted: 20 January 2021
References
1. Fuentes, M. M. et al. Adaptive management of marine mega-fauna in a changing climate. Mitig. Adapt. Strat. Glob. Change 21,
209–224 (2016).
2. Grose, S. O., Pendleton, L., Leathers, A., Cornish, A. & Waitai, S. Climate change will re-draw the map for marine megafauna and
the people who depend on them. Front. Mar. Sci. 7, 547 (2020).
3. Halley, J. M., Van Houtan, K. S. & Mantua, N. How survival curves affect populations’ vulnerability to climate change. PLoS ONE
13, e0203124 (2018).
4. Zacharias, M. A. & Roff, J. C. Use of focal species in marine conservation and management: a review and critique. Aquat. Conserv.
Mar. Freshw. Ecosyst. 11, 59–76 (2001).
5. Hazen, E. L. et al. Ontogeny in marine tagging and tracking science: technologies and data gaps. Mar. Ecol. Prog. Ser. 457, 221–240
(2012).
6. Hazen, E. L. et al. Predicted habitat shifts of Pacific top predators in a changing climate. Nat. Clim. Change 3, 234–238 (2013).
7. Jorgensen, S. J. et al. Killer whales redistribute white shark foraging pressure on seals. Sci. Rep. 9, 1–9. https://doi.org/10.1038/
s41598-019-39356-2 (2019).
8. Domeier, M. L. Global perspectives on the biology and life history of the white shark (CRC Press, Boca Raton, 2012).
9. Bruce, B. D. & Bradford, R. W. Habitat use and spatial dynamics of juvenile white sharks, Carcharodon carcharias, in eastern
Australia. Global perspectives on the biology and life history of the white shark, 225–254 (2012).
10. Lowe, C. G. et al. Historic fishery interactions with white sharks in the Southern California Bight. Global Perspectives on the Biology
and Life History of the White Shark’.(Ed. ML Domeier.) pp, 169–186 (2012).
11. Villafaña, J. A. et al. First evidence of a palaeo-nursery area of the great white shark. Sci. Rep. 10, 1–8 (2020).
Scientific Reports | (2021) 11:3373 | https://doi.org/10.1038/s41598-021-82424-9 7
Vol.:(0123456789)www.nature.com/scientificreports/
12. Oñate-González, E. C. et al. Importance of Bahia Sebastian Vizcaino as a nursery area for white sharks (Carcharodon carcharias)
in the Northeastern Pacific: a fishery dependent analysis. Fish. Res. 188, 125–137 (2017).
13. Klimley, A. P. The areal distribution and autoecology of the white shark, Carcharodon carcharias, off the west coast of North
America. Mem. Southern Calif. Acad Sci 9, 15–40 (1985).
14. Weng, K. C. et al. Movements, behavior and habitat preferences of juvenile white sharks Carcharodon carcharias in the eastern
Pacific. Mar. Ecol. Prog. Ser. 338, 211–224 (2007).
15. White, C. F. et al. Quantifying habitat selection and variability in habitat suitability for juvenile white sharks. PLoS ONE 14,
e0214642. https://doi.org/10.1371/journal.pone.0214642 (2019).
16. Di Lorenzo, E. & Mantua, N. Multi-year persistence of the 2014/15 North Pacific marine heatwave. Nat. Clim. Change 6, 1042–1047
(2016).
17. Peterson, W. T. et al. The pelagic ecosystem in the Northern California Current off Oregon during the 2014–2016 warm anomalies
within the context of the past 20 years. J. Geophys. Res.: Oceans 122, 7267–7290 (2017).
18. Thompson, A. et al. State of the California current: a new anchovy regime and Marine Heatwave? California Cooperative Oceanic
Fisheries Investigations Reports. Calif. Cooper. Ocean. Fish. Investig. 60, 1–61 (2019).
19. Gentemann, C. L., Fewings, M. R. & García-Reyes, M. Satellite sea surface temperatures along the West Coast of the United States
during the 2014–2016 northeast Pacific marine heat wave. Geophys. Res. Lett. 44, 312–319 (2017).
20. Sanford, E., Sones, J. L., García-Reyes, M., Goddard, J. H. & Largier, J. L. Widespread shifts in the coastal biota of northern Cali-
fornia during the 2014–2016 marine heatwaves. Sci. Rep. 9, 1–14 (2019).
21. Choy, C. A. et al. The vertical distribution and biological transport of marine microplastics across the epipelagic and mesopelagic
water column. Sci. Rep. 9, 1–9 (2019).
22. Kohl, W. T., McClure, T. I. & Miner, B. G. Decreased temperature facilitates short-term sea star wasting disease survival in the
keystone intertidal sea star Pisaster ochraceus. PLoS ONE 11, e0153670 (2016).
23. Laake, J. L., Lowry, M. S., DeLong, R. L., Melin, S. R. & Carretta, J. V. Population growth and status of California sea lions. J. Wildl.
Manag. 82, 583–595 (2018).
24. Jones, T. et al. Unusual mortality of Tufted puffins (Fratercula cirrhata) in the eastern Bering Sea. PLoS ONE 14, e0216532 (2019).
25. Savage, K. Alaska and British Columbia large whale unusual mortality event summary report. (2017).
26. Gravem, S. A. & Morgan, S. G. Shifts in intertidal zonation and refuge use by prey after mass mortalities of two predators. Ecology
98, 1006–1015 (2017).
27. Cheung, W. W. & Frölicher, T. L. Marine heatwaves exacerbate climate change impacts for fisheries in the northeast Pacific. Sci.
Rep. 10, 1–10 (2020).
28. Kanive, P. E. et al. Size-specific apparent survival rate estimates of white sharks using mark–recapture models. Can. J. Fish. Aquat.
Sci. 76, 2027–2034 (2019).
29. California_State_Senate. Budget Act of 2018. Senate Bill 840 2017–2018 (2018).
30. Miller-Rushing, A., Primack, R. & Bonney, R. The history of public participation in ecological research. Front. Ecol. Environ. 10,
285–290 (2012).
31. Vianna, G. M., Meekan, M. G., Bornovski, T. H. & Meeuwig, J. J. Acoustic telemetry validates a citizen science approach for moni-
toring sharks on coral reefs. PLoS ONE 9, e95565 (2014).
32. Klimley, A. P., Anderson, S. D., Pyle, P. & Henderson, R. Spatiotemporal patterns of white shark (Carcharodon carcharias) preda-
tion at the South Farallon Islands, California. Copeia, 680–690 (1992).
33. Fredston-Hermann, A., Selden, R., Pinsky, M., Gaines, S. D. & Halpern, B. S. Cold range edges of marine fishes track climate change
better than warm edges. Glob. Change Biol. 26, 2908–2922 (2020).
34. Cheung, W. W., Watson, R. & Pauly, D. Signature of ocean warming in global fisheries catch. Nature 497, 365–368 (2013).
35. Mcclure, M. M. et al. Incorporating climate science in applications of the US Endangered Species Act for aquatic species. Conserv.
Biol. 27, 1222–1233 (2013).
36. Silber, G. K. et al. Projecting marine mammal distribution in a changing climate. Front. Mar. Sci. 4, 413 (2017).
37. Cao, J., Thorson, J. T., Punt, A. E. & Szuwalski, C. A novel spatiotemporal stock assessment framework to better address fine-scale
species distributions: Development and simulation testing. Fish Fish. 21, 350–367. https://doi.org/10.1111/faf.12433 (2020).
38. Dewar, H., Domeier, M. & Nasby-Lucas, N. Insights into young of the year white shark, Carcharodon carcharias, behavior in the
Southern California Bight. Environ. Biol. Fishes 70, 133–143 (2004).
39. Moxley, J. H., Nicholson, T. E., Van Houtan, K. S. & Jorgensen, S. J. Non-trophic impacts from white sharks complicate population
recovery for sea otters. Ecol. Evol. 9, 6378–6388. https://doi.org/10.1002/ece3.5209 (2019).
40. Cury, P. et al. Small pelagics in upwelling systems: patterns of interaction and structural changes in “wasp-waist” ecosystems. ICES
J. Mar. Sci. 57, 603–618 (2000).
41. Nicholson, T. E. et al. Gaps in kelp cover may threaten the recovery of California sea otters. Ecography 41, 1751–1762 (2018).
42. Kenyon, K. W. The sea otter in the eastern Pacific Ocean. (US Bureau of Sport Fisheries and Wildlife, 1969).
43. Tinker, M. T., Hatfield, B. B., Harris, M. D. & Ames, J. A. Dramatic increase in sea otter mortality from white sharks in California.
Mar. Mammal Sci. 32, 309–326 (2016).
44. Miller, M. A. et al. Predators, disease, and environmental change in the nearshore ecosystem: mortality in Southern Sea Otters
(Enhydra lutris nereis) From 1998–2012. Front. Mar. Sci. 7, 582 (2020).
45. Estes, J. A. & Palmisano, J. F. Sea otters: their role in structuring nearshore communities. Science 185, 1058–1060 (1974).
46. Hughes, B. B. et al. Recovery of a top predator mediates negative eutrophic effects on seagrass. Proc. Natl. Acad. Sci. USA 110,
15313–15318. https://doi.org/10.1073/pnas.1302805110 (2013).
47. Becker, S. L., Nicholson, T. E., Mayer, K. A., Murray, M. J. & Van Houtan, K. S. Environmental Factors May Drive the Post-release
Movements of Surrogate-Reared Sea Otters. Frontiers in Marine Science 7, doi:https://doi.org/10.3389/fmars.2020.539904 (2020).
48. Mayer, K. A. et al. Surrogate rearing a keystone species to enhance population and ecosystem restoration. Oryx, 1–11 (2019).
49. Jorgensen, S. J. et al. Philopatry and migration of Pacific white sharks. Proc. R. Soc. B: Biol. Sci. 277, 679–688 (2010).
50. Breaker, L. & Broenkow, W. W. The circulation of Monterey Bay and related processes. Moss Land. Mar. Lab. Tech. Publ. 89, 114
(1989).
51. Santora, J. A. et al. Habitat compression and ecosystem shifts as potential links between marine heatwave and record whale entan-
glements. Nat. Commun. 11, 536. https://doi.org/10.1038/s41467-019-14215-w (2020).
52. Zanna, L., Khatiwala, S., Gregory, J. M., Ison, J. & Heimbach, P. Global reconstruction of historical ocean heat storage and transport.
Proc. Natl. Acad. Sci. 116, 1126–1131 (2019).
53. Gaines, S. D. & Denny, M. W. The largest, smallest, highest, lowest, longest, and shortest: extremes in ecology. Ecology 74, 1677–1692
(1993).
54. Hobday, A. J. et al. A hierarchical approach to defining marine heatwaves. Prog. Oceanogr. 141, 227–238 (2016).
55. Oliver, E. C. et al. Longer and more frequent marine heatwaves over the past century. Nat. Commun. 9, 1–12 (2018).
56. Worm, B. et al. Global catches, exploitation rates, and rebuilding options for sharks. Mar. Policy 40, 194–204 (2013).
57. McCauley, D. J., DeSalles, P. A., Young, H. S., Gardner, J. P. & Micheli, F. Use of high-resolution acoustic cameras to study reef
shark behavioral ecology. J. Exp. Mar. Biol. Ecol. 482, 128–133 (2016).
58. Ward-Paige, C. A. & Worm, B. Global evaluation of shark sanctuaries. Global Environ. Change 47, 174–189 (2017).
59. Van Houtan, K. S. et al. Coastal sharks supply the global shark fin trade. Biol. Let. 16, 20200609 (2020).
Scientific Reports | (2021) 11:3373 | https://doi.org/10.1038/s41598-021-82424-9 8
Vol:.(1234567890)www.nature.com/scientificreports/
60. Benson, J. F. et al. Juvenile survival, competing risks, and spatial variation in mortality risk of a marine apex predator. J. Appl. Ecol.
55, 2888–2897 (2018).
61. Cleveland, W. S. & Devlin, S. J. Locally weighted regression: an approach to regression analysis by local fitting. J. Am. Stat. Assoc.
83, 596–610 (1988).
62. Beck, J., Ballesteros-Mejia, L., Nagel, P. & Kitching, I. J. Online solutions and the ‘W allacean shortfall’: what does GBIF contribute
to our knowledge of species’ ranges?. Divers. Distrib. 19, 1043–1050 (2013).
63. Dickinson, J. L., Zuckerberg, B. & Bonter, D. N. Citizen science as an ecological research tool: challenges and benefits. Annu. Rev.
Ecol. Evol. Syst. 41, 149–172 (2010).
64. Van Horn, G. et al. in Proceedings of the IEEE conference on computer vision and pattern recognition. 8769–8778.
65. Teo, S. L. et al. Validation of geolocation estimates based on light level and sea surface temperature from electronic tags. Mar. Ecol.
Prog. Ser. 283, 81–98 (2004).
66. Handcock, M. S. Package ‘reldist’. (2016).
67. Reynolds, R. & Banzon, V. NOAA Optimum Interpolation 1/4 Degree Daily Sea Surface Temperature (OISST) Analysis, Version
2. NOAA National Centers for Environmental Information. 10, V5SQ8XB5 (2008).
68. Banzon, V., Smith, T. M., Chin, T. M., Liu, C. & Hankins, W. A long-term record of blended satellite and in situ sea-surface tem-
perature for climate monitoring, modeling and environmental studies. (2016).
69. Lyons, K. et al. The degree and result of gillnet fishery interactions with juvenile white sharks in southern California assessed by
fishery-independent and-dependent methods. Fish. Res. 147, 370–380 (2013).
70. Mayer, L. et al. The Nippon Foundation—GEBCO seabed 2030 project: The quest to see the world’s oceans completely mapped by
2030. Geosciences 8, 63 (2018).
71. Tanaka, K. R. et al. Mesoscale climatic impacts on the distribution of Homarus americanus in the US inshore Gulf of Maine. Can.
J. Fish. Aquat. Sci. 76, 608–625 (2019).
72. R_Core_Team. (Vienna, Austria, 2019).
Acknowledgements
A. Wolfrum, A. Boustany, E. Miller and two anonymous reviewers improved earlier versions of this manuscript.
P. Adamson, J. Moxley and T. Farrugia assisted with field surveys. We thank O. Sosa for sharing unpublished
observations. This study was supported by the generous contributions of members, visitors, and donors to the
Monterey Bay Aquarium and by iNaturalist contributors.
Authors’ contribution
S.J. and K.V. designed the study. K.T., B.D., and K.V. analyzed the data, and with S.J., C.G., and E.M. curated
data. K.T. and K.V. generated the figures and drafted the manuscript with contributions from J.O., C.L., S.J., and
E.M. All authors reviewed the manuscript.
Competing interests
The authors declare no competing interests.
Additional information
Supplementary Information The online version contains supplementary material availlable at https://doi.
org/10.1038/s41598-021-82424-9.
Correspondence and requests for materials should be addressed to K.R.T. or S.J.J.
Reprints and permissions information is available at www.nature.com/reprints.
Publisher’s note Springer Nature remains neutral with regard to jurisdictional claims in published maps and
institutional affiliations.
Open Access This article is licensed under a Creative Commons Attribution 4.0 International
License, which permits use, sharing, adaptation, distribution and reproduction in any medium or
format, as long as you give appropriate credit to the original author(s) and the source, provide a link to the
Creative Commons licence, and indicate if changes were made. The images or other third party material in this
article are included in the article’s Creative Commons licence, unless indicated otherwise in a credit line to the
material. If material is not included in the article’s Creative Commons licence and your intended use is not
permitted by statutory regulation or exceeds the permitted use, you will need to obtain permission directly from
the copyright holder. To view a copy of this licence, visit http://creativecommons.org/licenses/by/4.0/.
© The Author(s) 2021
Scientific Reports | (2021) 11:3373 | https://doi.org/10.1038/s41598-021-82424-9 9
Vol.:(0123456789)You can also read