Number and rate of fatalities - 1a - Missouri Department of Transportation
←
→
Page content transcription
If your browser does not render page correctly, please read the page content below

Tracker Archive – July 2021

Number and rate of fatalities – 1a

*Preliminary numbers are subject to change

Write up:
Safety is MoDOT’s number one priority. Whether resident, visitor to the state or highway
worker, the ultimate goal is to assure that everyone returns home safely. MoDOT supports
Zero Fatalities by 2030 as part of the strategic highway safety plan, Show Me Zero, designed
to reduce the number and severity of traffic crashes using the four key disciplines of traffic
safety: engineering, enforcement, education, and emergency response.

There were 182 fatalities in the first quarter and 276 fatalities in the second quarter of 2021.
This is an increase of 10 fatalities from the first and second quarters of last year. For the year
2020, there have been 987 fatalities compared to 881 for the same time in 2019, an increase of
106 fatalities. The target for 2021 is 938 fatalities or fewer.
Tracker Archive – July 2021

Focusing on Show Me Zero, there are currently 24 counties with zero fatalities in the first six
months of 2021. There were 24 days with zero fatalities, which included two times when two
days occurred sequentially without a fatal crash.

Purpose:
This measure tracks the number of fatalities quarterly, annually, and five-year average trends
resulting from traffic crashes on all Missouri roadways.

Measurement and Data Collection:
Missouri law enforcement agencies submit a vehicle accident report form to the Missouri
State Highway Patrol to be entered into a statewide traffic crash database. The database
automatically updates MoDOT’s crash database system, which is part of the Transportation
Management System. The rate of fatal crashes charts display annual and five-year average
fatality and injury rates per 100 million vehicle miles traveled for these same crashes. In
addition, the fatality rate chart includes the national average.
Targets are based on Zero by 2030 fatality reduction, 1% VMT increase and non-motorized
reduction based on overall fatality and reductions. An exception is made for instances where
the baseline five-year rolling average is less than the calculated target using the parameters
previously described. When this occurs, the baseline will be used as the target.

Number of fatalities in work zones – 1b

*Internal Review is MoDOT's investigation into each crash to determine if that crash qualifies as a true
work zone fatality
Tracker Archive – July 2021

Write up:
Safe and efficient travel for the public through work zones is crucial, which is why crews in
work zones are expected to conduct operations safely. MoDOT makes every effort to inform
the public to pay attention, slow down, move over, buckle up and drive without distractions
to increase the safety of workers and travelers. MoDOT’s goal is zero fatalities in work zones,
and only through continued efforts from MoDOT, the contracting industry and the driving
public can that goal be accomplished. Continual improvement in planning, strategies and
technologies are employed, and it’s up to MoDOT staff to deploy the proper tools in all work
zones.
To make progress toward the goal of zero fatalities in work zones, an internal review is
conducted on each fatal crash. For this quarter, there were two reported work zone fatalities
on the state system. One involved a rear end collision while the other involved a runoff the
road crash. No workers were present and neither driver was wearing a seat belt. There was
one crash on the local system. The driver was wearing a seatbelt, however excessive speed
contributed to the severity of the crash.
Poor driver behavior remains a primary factor in fatal crashes, which proves difficult for
MoDOT to control. Community outreach and public awareness campaigns, such as Buckle Up
Phone Down, are very helpful, but ultimately MoDOT is dependent upon the driving public to
make good choices when driving in work zones. The challenges for MoDOT remain many, with
changing driver behaviors at the top.

Purpose:
This measure tracks the number of traffic-related and non-traffic-related fatalities, injuries
and overall crashes occurring in work zones on state-owned and off-system roadways.
Tracker Archive – July 2021

Measurement and Data Collection:
Missouri law enforcement agencies submit a vehicle accident report form to the Missouri
State Highway Patrol to be entered into a statewide traffic crash database. The database
automatically updates MoDOT’s crash database system, which is part of the Transportation
Management System. MoDOT staff query and analyze this data to identify work zone related
crash statistics. Missouri State Highway Patrol prioritizes entry of the crash reports by fatality,
serious injury and property damage only.
The target for this measure is updated quarterly. This target is established by projecting a
10% improvement over a five-year average.

Number of vulnerable roadway user fatalities – 1c

Write up:
In 2020, there was an increase in the number of fatalities for vulnerable roadway
users. Motorcycle and bicycle fatalities did decrease by 3%, however, pedestrian fatalities
increased 14%.
In only two of the motorcycle incidents did both the driver and passenger die, but they were
all older drivers. All age groups were represented evenly, from age 15 to 79. Districts were
represented as well with rural districts having about a third of the fatalities seen in urban
districts. Of the 117 fatalities, 19 were not wearing a helmet and 18 were wearing a non-DOT
helmet.
Pedestrian fatalities occurred in every month and on every type of roadway. There were 25
fatalities on the interstate, six of those in October, although the remaining were spread
throughout the year. Half of the fatalities on interstates were in the St. Louis district, with the
remaining in Northwest, Kansas City, Central District and Southwest District. Pedestrians
ranged from a toddler to age 89, but those in their 30's, 40's and 50's represented the highest
numbers of fatalities. Of the 127 fatalities, 53 were in St. Louis.
Tracker Archive – July 2021

 Of the eight cyclists who died on Missouri roadways, five were in the Kansas City District, one
in the Southwest District and two in in the Southeast District. Seven of the eight were not
wearing helmets and seven were male. Two were teenagers, five were in their 40's and 50's
and one was 84. Two fatalities occurred in the months of June, July and December, with one
fatality each in April and October.
The only focus area seems to be targeting pedestrians to walk safely in St. Louis and to stay in
their vehicles after crashes or breakdowns on the interstate. The remaining target would be
to urge cyclists in Kansas City to wear helmets and follow road user rules when biking.

Purpose:

The vulnerable roadway user measure tracks annual trends in fatalities of motorcyclists,
pedestrians and bicyclists. These roadway users are at risk for death when involved in a
motor-vehicle-related crash.

Measurement and Data Collection:

Missouri law enforcement agencies submit a vehicle accident report form to the Missouri
State Highway Patrol to be entered into a statewide traffic crash database. The database
automatically updates MoDOT’s crash database system, which is part of the Transportation
Management System.

Most common characteristics of fatal crashes – 1d

Write up:
MoDOT’s priority is to keep customers and employees safe. The greatest challenge to this is
the recurring frequency of fatal and serious injury crashes on Missouri roadways. MoDOT
Tracker Archive – July 2021

utilizes crash data to identify the most common contributing circumstances of severe
crashes. By identifying behaviors and characteristics most associated with these crashes,
MoDOT can make more informed decisions to address the problem. While the most common
causes are related to human behavior, MoDOT can help implement solutions through
education, enforcement, engineering and emergency response to minimize poor decisions
and their potential impact.
In 2020 there were 986 traffic fatalities in Missouri, a 12% increase from 2019. While every
category reported in this measure saw an increase, the most notable increases involved
vehicles running off the roadway, usually due to aggressive driving and unbelted vehicle
occupants. Aggressive driving continues to be the leading cause of fatal crashes in the state.
Aggressive driving includes speeding, driving too fast for conditions, following too closely and
improper passing. Speed contributed to 40% of the traffic fatalities in 2020. Overall, speed
related fatalities were up 25% from 2019. Unbelted occupant fatalities increased 23% in 2020
with 428 individuals not wearing a seat belt. Overall, 67% of the vehicle occupants killed in
2020 were not wearing a seat belt. Distracted driving fatalities were up 13% in 2020, the first
recorded increase in this category since 2015. Substance-impaired driving fatalities were up
6% in 2020, but mostly in line with the previous five years.
In conjunction with the Missouri Coalition for Roadway Safety, MoDOT unveiled a new
strategic highway safety plan, Show-Me Zero. Show-Me Zero is designed to provide all
Missourians a better understanding of the crash problem and how everyone, from individuals
to organizations, can play a role in driving Missouri toward safer roads. The plan uses four key
messages to promote change: buckle up, phone down, slow down and drive sober.
MoDOT directly supports implementation of Show-Me Zero through the Statewide
Transportation Improvement Program (STIP), where millions of dollars are programmed each
year for roadway safety improvements. In addition, MoDOT administers federal safety funds
for educational and enforcement programs to reduce poor driving behaviors. These programs
allow safety partners throughout the state to get involved in efforts to move Missouri toward
zero deaths.

Purpose:

The measure tracks annual trends in motor-vehicle-related fatalities resulting from the most
common contributing factors or highway features. This data represents the four focus areas
presented in Missouri’s strategic highway safety plan, Show-Me Zero.

Measurement and Data Collection:
Missouri law enforcement agencies submit a vehicle crash report form to the Missouri State Highway
Patrol to be entered into a statewide traffic crash database, which feeds into MoDOT's Transportation
Management System. MoDOT staff query and analyze this data to determine the number of
unrestrained occupants in crashes, how often aggressive driving, distracted driving, alcohol and other
Tracker Archive – July 2021

drugs contribute to crashes, and whether or not the vehicles ran off the road, the crash occurred in a
curve or the crash occurred at an intersection.

Number and rate of fatalities involving commercial motor vehicles –
1e

Write up:
Commercial Motor Vehicles play a vital role in the nation’s economy by transporting the
products that are needed. By tracking the number of CMV involved fatalities, MoDOT can
target educational and enforcement efforts, as well as improve safety features along Missouri
roadways. MoDOT partners with the Missouri State Highway Patrol, St. Louis Metropolitan
Police Department, Kansas City Police Department and St. Louis County Police Department to
keep people safe while traveling in and around CMVs.
While efforts from MoDOT and the partner agencies are effective in improving safety on
roadways, Missouri has not experienced a significant decrease in the number and rate of
fatalities involving CMVs. Between 2016 and 2020, fatalities involving a CMV had no change
and the fatality rate decreased from 1.29 to 1.18 per 100 million CMV vehicle miles traveled. In
2020, Missouri experienced a decrease of 16 fatalities involving a CMV as compared to 2019.
This resulted in a 2020 fatality rate of 1.18 compared to 1.27 for 2019. The target for 2020 was
127 fatalities and unfortunately this goal was not met.
Purpose:
This measure tracks annual trends in fatalities involving Commercial Motor Vehicles. This
data guides the development and focus of the Commercial Vehicle Safety Plan, which is the
plan required to receive Motor Carrier Safety Assistance Program funds.
Tracker Archive – July 2021

Measurement and Data Collection:

Missouri law enforcement agencies submit a vehicle accident report form to the Missouri State
Highway Patrol to be entered into a statewide traffic crash database. The database automatically
updates MoDOT’s crash database system, which is a part of the Transportation Management System.
The fatal rates on the charts display the annual fatality and injury rates per 100 million vehicle miles
traveled for commercial motor vehicles for these same crashes. The targets are based on a 9%
improvement rate from the immediate prior year fatalities from the immediate prior year.

Percent of seat belt/passenger vehicle restraint use – 1f

Write up:
Seat belts save lives, but getting people to use them – even to protect their own lives – is a
challenge. Public education is one way to keep the issue in front of motorists, along with
legislation. MoDOT supports each approach, attacking the problem with focused marketing
campaigns and reinforcing it with hard facts to back legislative efforts. Several municipalities
across the state are taking matters into their own hands, enacting primary ordinances within
city limits. Missouri currently has one county and 64 municipalities that have adopted
primary seat belt ordinances, representing over 27% of the state’s population.
Based on 116,224 observations, seat belt use in Missouri for 2020 was 86.1%, a 1.6% decrease
from 2019. Benton County was the lowest at 67.7% and McDonald County was the highest at
96.6% (weighted data). The national average for seat belt use in 2019 was 90.7% (2020 data is
not yet available). Missouri’s national ranking (including Washington D.C.) in 2019 was 37th
overall and seventh of 16 in secondary or no seat belt law states. Due to the COVID-19
pandemic and its effect on traffic, the National Highway Traffic Safety Administration waived
the requirement for states to conduct a statewide survey in 2020. MoDOT opted to continue
with the survey at the normal June schedule as traffic volume was returning to near normal
Tracker Archive – July 2021

and our survey partner had surveyors ready with provisions for social distancing and
masks. The 2020 survey was only 3,189 observations less than 2019.
MoDOT is improving its safety culture through statewide strategic initiatives such as Buckle
Up Phone Down and by coordinating Click It or Ticket, Youth Seat Belt and Child Passenger
Safety Campaigns, as well as providing educational programs such as Teens Taking Action To
Prevent Traffic Crashes and ThinkFirst.

Purpose:
This measure tracks annual trends in seat belt use in passenger vehicles. This data drives the
development and focus of the Missouri Highway Safety Plan and supports Missouri’s
Blueprint to Save More Lives.

Measurement and Data Collection:
Each June, a statewide survey is conducted at 560 preselected locations in 28 counties. The data
collected is calculated into a seat belt usage rate using a formula approved by the National Highway
Traffic Safety Administration. Data collection locations are selected from counties that represent 85%
of the state’s vehicle occupant fatalities. While the data collection plan is the same each year for
consistency, NHTSA guidelines require survey sites to be re-selected every five years based on
updated fatality data. The 2018 survey was the first survey using updated survey sites since Missouri’s
new survey methodology started in 2013. The target for this measure is updated annually in October
for the next calendar year. This target is established as the current national average.

Employee safety focus areas – 1g
Tracker Archive – July 2021

Write up:

MoDOT’s number one value is safety. The purpose of this measure is for everyone to arrive at
work safely and return home the same way. This includes all the preparation necessary for a
safe day including planning the jobs, Risk Based Assessment review, morning safety briefings
and stretching. This measure focuses on improving three high risk areas: backing a motorized
vehicle; slips, trips and falls; and sprains and strains.

MoDOT had 56 backing incidents in the first two quarters of 2021. This was a 17% increase in
backing incidents from the same time in last year. Backing incidents can cause property
damage, injuries and death. Improvement strategies include parking to avoid backing, good
planning, always using a spotter, doing a thorough circle check of the area and the
implantation of Geotab devices in all snow vehicles to assist with data collection.

There were 53 employees who received medical attention for slips, trips and falls during the
first two quarters of 2021, which is a 12% decrease from the first two quarters of 2020.
Improvement strategies include being aware of surroundings, keeping work areas organized,
looking out for each other by pointing out hazards on the job that may be hidden and wearing
the proper personal protective equipment for conditions.
Tracker Archive – July 2021

During the first two quarters of 2021, 42 MoDOT employees received medical attention for
sprains and strains. This is a 13% decrease from the first two quarters last year. Improvement
strategies include implementation of a statewide stretch and flex program, asking for help
when lifting and using proper lifting technique like those taught during Gear Up.

It is imperative that employees focus on improvement strategies and put MoDOT’s Behavior
Based Safety and Actively Caring programs into action. At MoDOT, safety is everyone’s
responsibility.
Purpose:
This measure tracks the department's most frequent incident types and highlights areas to focus on
for improvement.

Measurement and Data Collection:

Data is collected through RiskMaster for each district and Central Office for the prior four years on the
number of backing incidents; slips, trips and falls; and strains and pulls. These are the three most
common types of injuries at MoDOT.

TMA crashes and associated employee injuries – 1h

Write up:

While the ultimate goal is to eliminate work zone crashes, the goal for this measure is to
reduce the number of protective vehicle/truck-mounted attenuator crashes below the
previous 4-year average. In the second quarter of 2021, MoDOT had 21 reported protective
vehicle crashes. The number of crashes in this quarter is more than one-and-a-half times
higher than the year-to-date average for the previous four years. These crashes can be less
than $100 in damage to the TMA, but in most cases a new TMA costing approximately $40,000
Tracker Archive – July 2021

is required. This does not include staff time, truck damage, lost wages or medical bills. This
quarter, six employees in a TMA crash sought medical attention. Two of the TMA crashes this
quarter happened at night, the rest were during the day, predominately in urban areas.
Operations in which crashes occurred include five pothole patching, seven striping, one
sweeping, one spraying, one-liter pickup, two bridge flushing and four other operations.

Purpose:
MoDOT owns more than 300 truck- or trailer-mounted attenuators that are used to save lives
by absorbing the impact of a crash in a work zone. By measuring the number of
TMA/Protective vehicle hits, MoDOT is able to identify higher risk activities that could result in
a crash and share this information to develop strategies to eliminate work zone crashes.

Measurement and Data Collection:

When a TMA incident occurs, a claim report is completed. The claim reports and any associated police
reports are collected by Risk Management Technicians for review and interpretation. A statewide work
zone incident team reviews TMA incidents and looks for strategies to improve the operations to
reduce or eliminate the incidents. Only incidents where the TMA was in an active work zone
protecting workers are included in this data. This measure is reported based on quarters of a calendar
year.

Employee perception of safety program (UNDER CONSTRUCTION) –
1i

Employee involvement in safety - 1j

Write up:
To be effective, any safety and health program needs the meaningful participation of its employees.
They have much to gain from a successful program and the most to lose if the program fails. They also
Tracker Archive – July 2021

often know the most about potential hazards associated with their jobs. Additionally, involvement
breeds acceptance as people support what they help create. These proactive measures, Behavior
Based Safety Observations and Good-Catches are positive things employees can do rather than
negative outcomes they should avoid. Safety happens before an incident and this measure gives
employees the goal of elimination before mitigation. Conversely, learning from mistakes is vital to a
safety program. Near-miss reporting is another piece of the puzzle that allows the department to
continue the vision of zero injuries. The department experienced a 20% decrease in employee
participation in observations, near-miss and good-catch reporting for first half of 2021 compared to
first half of 2020.
Purpose:
This measure shows how involved MoDOT employees are in the department’s safety program
by tracking BBS observations, near-misses and good-catches. This leading indicator shows
trends and recognizes employees practicing good hazard recognition.

Measurement and Data Collection:
Employee involvement measure uses observation, near-miss, and good-catch data that is
submitted by employee through https://www.modotbbs.com/

Total and rate of MoDOT recordable incidents – 1k
Tracker Archive – July 2021

Write up:
The total and rate of recordable incidents are tracked to measure the department’s goal of
fewer injuries. MoDOT’s goal is for every employee to go home every night to their families
unharmed. Reporting injuries allows the department to arrange for prompt treatment and to
learn from mistakes or remediate hazards. The total number of recordables for 2020 has
decreased significantly compared to 2019. The rate of incidents has also decreased
significantly compared to last year. There was a 33% decrease from 2019 for the number of
recordables and a 31% decrease for the rate of incidents.
Leading causes of injuries this year were slips, trips and falls (21%); strains (19%) and vehicle
incidents (14%). Based on the work activity being performed at the time of the incident,
equipment use accounted for 26% of employee injuries, mowing accounted for 13% and 11%
were due to vehicles.

Purpose:
This measure tracks the number of recordable injuries in total and as a rate of injuries per 100
workers.

Measurement and Data Collection:
The calculation for incidence rate is the number of recordables times 200,000 divided by the
number of hours worked. The 200,000 used in the calculation is the base for 100 full-time
workers (working 40 hours per week, 50 weeks per year). MoDOT defines a recordable
incident as a work-related injury or illness that results in death, days away from work or
medical treatment resulting in cost to the department. The injury data is collected from
RiskMaster, the department’s risk management claims administration software. The number
of hours worked is taken from MoDOT’s payroll data.
Tracker Archive – July 2021

The target for total recordable incidents is updated quarterly. The target for rate of
recordable incidents is updated annually. The target is calculated by subtracting 10% from
the year-to-date comparison period.

General liability claims and costs -1l

Write up:
Keeping employees and the public safe is the department’s highest value. Controlling
damage to vehicles and reducing personal injury in work zones, on right-of-way and other
areas under department control helps MoDOT accomplish this goal. Compared to the first
two quarters of 2020, there was a 39% increase in the number of claims. Most of the claims in
2021 were attributed to pavement defects. Also compared to first two quarters of 2020, there
was a 7% increase in the amount paid.
This quarter, payments were made on 215 claims against the department, totaling
$3,422,974.18. Four claims accounted for 75% of this quarter’s payments. The first crash
occurred in an intersection. It was alleged the design was dangerous, in that the acceleration
lane was too short to gain speeds high enough to safely merge. The claim settled for
$200,000. The second crash occurred when the driver was confused by the layout and signage
at an intersection. The intersection the highway converts from four lanes to two lanes. This
Tracker Archive – July 2021

accident involved a double fatality and several serious injuries. This claim was settled for
$1,550,000. In the third accident, the vehicle lost control around a curve causing significant
injuries. It was determined the speed on the sign should have been lower. The claim was
arbitrated, and the plaintiff was awarded $402,231.43. The last claim involved the plaintiff
hitting a hole in the sidewalk with his bicycle causing him to be thrown off causing permanent
severe injuries. This claim settled for $275,000.00.
To achieve the general liability number of claims target, the focus needs to be on the
department’s most common claims. Historically, the top five most frequent claim types
during the second and third quarters are pavement defects, chip seal operations, debris on
the roadway and mowing and striping operations.

Purpose:

This measure tracks the number of general liability claims and amount paid.

Measurement and Data Collection:
General liability claims arise from allegations of injuries/damages caused by dangerous
conditions on MoDOT property and the injury/damage that directly resulted from the
condition. In addition, an employee must be negligent and create the dangerous condition or
MoDOT must have actual or constructive notice of the dangerous condition in sufficient time
prior to the injury/damage to have taken measures to protect the public. Claims data is
collected from Riskmaster, the department’s risk management claims administration
software.
The target for this measure is updated annually. It is calculated by determining a five-year
average and subtracting 10%. (Exceptionally high or low years are excluded from the five-year
average calculation to determine a practical target).
Tracker Archive – July 2021

Combined Customer Satisfaction Survey – 2a

*2010-2011 - Lincoln Mercury, 2012 - Apple, Inc., 2013 - Mercedes Benz, 2015 - Chick-fil-A, 2017 - Chick-fil-A
Tracker Archive – July 2021
Tracker Archive – July 2021

Write up:
Just like well-maintained roads and bridges, MoDOT delivers information. The citizens of
Missouri expect timely, accurate and understandable information from their department of
transportation. Whether it’s a news release, social media post, text alert or a notice of a public
meeting, MoDOT makes every effort to get the word out as quickly and as clearly as possible.
The results of this effort are public trust and respect. With numbers consistently above 90%
agreement for the past five surveys, this measure shows the department meets customers’
high expectations.
While customer satisfaction with MoDOT remains relatively high, the percent of Missourians
surveyed who says they are satisfied with the job MoDOT is doing dropped from 83% in 2017
to 77% in 2019, a 6% decline. In addition, those customers who reported they are very
satisfied with MoDOT decreased from 28% to 20%.
Results have remained fairly steady, with some decreases. Possible reasons for the decreases
seen in these measures could be related to stagnant funding and system condition, as well as
a harsh winter and flooding.
As the agency responsible for transportation in Missouri, MoDOT must hold its lead as an
expert in the field. The department continues to work on improving partnerships with all
Missourians, including local government, elected officials and transportation-related groups
and organizations in order to deliver the very best possible transportation system with the
resources available. Gaining and keeping the public’s trust is critical to MoDOT’s overall
success. The best way MoDOT can accomplish this is to deliver on the commitments it makes.
The 2019 survey shows an overwhelming majority of customers perceive the department as
Missouri’s transportation expert. Ninety-one percent of those surveyed agreed MoDOT serves
this role, a percentage the department has consistently maintained for more than 10 years. Of
the 91%, 52% of respondents “strongly agreed” and 39% “somewhat agreed” MoDOT serves
as the state’s primary transportation expert.
Tracker Archive – July 2021

The 2019 survey results indicate 82% of Missourians trust MoDOT to keep its commitments to
the public, compared to 87% in the previous survey. While 82% is still a high measure of trust
in a government agency, it reflects a 5% decrease from 2017, the lowest rating since before
2012.

Purpose:
This measure tracks the percent of customers who are satisfied with MoDOT as a leader and
expert in transportation issues, how effectively MoDOT conveys its expertise to the traveling
public and keeps its commitments, and also tracks whether customers feel MoDOT provides
timely, accurate and understandable information about road projects, highway conditions
and work zones.

Measurement and Data Collection:
Data is collected through a biennial, in odd-numbered years, telephone survey of
approximately 3,500 randomly selected Missourians.
The target for this measure is updated bi-annually in October. MoDOT strives to reach and
maintain 100% satisfaction across all aspects of customer satisfaction, based on standards in
major global industries.

Percent of customers satisfied with MoDOT's customer service – 2b
Tracker Archive – July 2021
Tracker Archive – July 2021

Write up:
Providing outstanding customer service is one of MoDOT’s core values and the responsibility
of every employee in the organization. To actively seek feedback from customers, MoDOT
uses a statewide call system and an enhanced online call report system that enables
customer service representatives to work across seven district boundaries in a one-team
approach. The data provided in the graphs reflects how those surveyed customers rated their
interaction with MoDOT.
During the second quarter of 2021, compared to the second quarter of 2020, overall customer
satisfaction decreased from 83% to 79%. Politeness of response remained steady at 95%.
Customers who were satisfied with the clarity of the response decreased slightly from 86% to
84%. Responsiveness was down from 88% to 83%.
The average time to complete customer requests was 2.2 days.

Purpose:

This measure shows how satisfied customers who contacted MoDOT were with the
politeness, clarity and responsiveness they received, as well as their overall level of
satisfaction.

Measurement and Data Collection:
Data for this measure comes from a monthly telephone, email and texting survey of 200
customers who contacted a MoDOT customer service center in the previous month. The
customer contacts come from call reports logged into the customer service database. Survey
participants are asked to respond on an agreement scale regarding three qualities of their
experiences. A fourth question is asked regarding their overall satisfaction. This measure also
includes the time to complete requests logged into the customer service database. Requests
requiring more than 30 days to complete are removed to prevent skewing the overall results.
The target for this measure is updated quarterly. This target is established by projecting a
10% improvement over a five-year average.

Customer communication engagement – 2c
Tracker Archive – July 2021
Tracker Archive – July 2021

Write up:

SOCIAL MEDIA

Good organizations share information with the people they serve. The best, most-trusted
organizations engage customers in conversation. MoDOT interacts with its customers
through social media networking websites and applications. MoDOT’s social media accounts
continue to attract followers. When comparing the second quarters of 2020 and 2021, there
was a growth of 23,127 followers on Facebook statewide and 8,277 on Twitter.

During the second quarter of 2021, the most popular Facebook post statewide was a dynamic
message sign image urging proper use of the left lane. The post reached more than 66,000
people with 4,180 engagements on Facebook alone.

To better track how customers are interacting with MoDOT on these social media sites,
engagements are being measured as well. Engagements are customer interactions with
MoDOT's posted content, including likes, shares, retweets, comments and replies. This
quarter, MoDOT Facebook pages across the state had 415,667 engagements and Twitter
pages had 22,036.

MoDOT websites had 1,138,850 sessions during the second quarter of 2021. This is up
compared to the same period last year. Spring and early summer flooding also impacted
traffic to the Traveler websites, where web sessions were again up compared to this time last
year.
MoDOT videos on YouTube and social media were viewed 2,814,460 times in the second
quarter of 2021. Additional advertisement video placements were viewed 34,437,452 times
this past quarter.
Tracker Archive – July 2021

WEB PAGE VIEWS
MoDOT Homepage - 145,300
Career Opportunities - 37,714
Careers - 26,405
Online Plans Room - 24,778
Current Flood Information - 21,596
YOUTUBE VIDEO VIEWS
Click It or Ticket - 500,887
4/20 Impaired Driving - 420,231
Youth Alcohol - 406,098
Motorcycle Awareness - 301,126
July Impaired Driving - 267,074

Purpose:
This measure tracks the number of MoDOT customers hitting the department’s social media
and website information.

Measurement and Data Collection:
MoDOT gathers information for this measure from a variety of sources, including Google
Analytics. Website traffic and YouTube information are cumulative totals based on visits.
Facebook and Twitter information is based on account followers. The target for this measure
is updated quarterly. This target is established by projecting a 7% improvement over the
same quarter in the previous year.
This measure is linked to the Improve Communications strategy included in the Sharpening
Our Strategic Vision initiative. The Citizen’s Guide to Transportation Funding, the new
department website and a better Traveler Information Map have been identified as strategies
to improve performance.
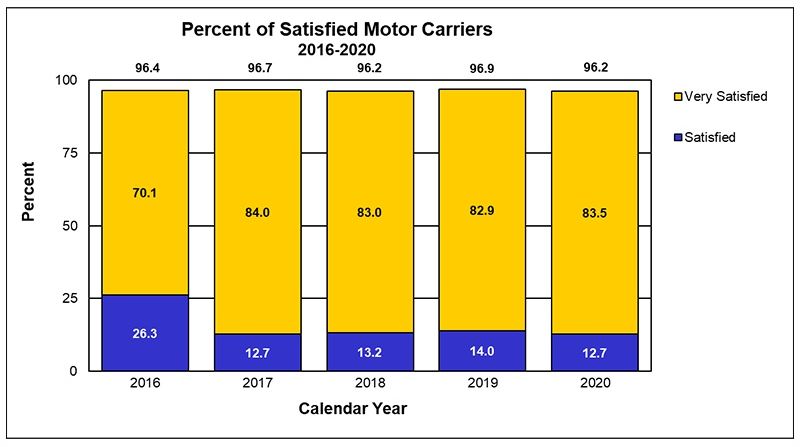
Tracker Archive – July 2021

Customer Service Spotlight- 2d

Write up:
Every employee at MoDOT plays a role in providing outstanding customer service. Each
quarter, this measure showcases an area within the department and its ongoing work and
successes in the realm of customer service. This quarter looks at the percent of satisfied
motor carriers' customers.
"Every piece of paper, phone call and email we process has a human being and a livelihood
attached."
The Motor Carrier Service team motto hangs prominently within Central Office. It reflects the
division's consistent effort to make customer care a top priority. The motto focuses on
encouraging regulatory and program compliance through service rather than enforcement.
Missouri motor carriers respect the approach and report extremely high rates of satisfaction
with the service they receive.
In addition to rating satisfaction, MCS customers provide extensive feedback. The satisfaction
survey asks what MCS does well and which areas can be improved. This feedback drives
decisions to implement daily work adjustments, reshapes communication and informs
decision-making.
During the past five years, overall customer satisfaction has sustained a rating of 96%. The
percentage of “very satisfied” responses increased in 2017 and remains at 83%.
Tracker Archive – July 2021

Purpose:
This measure tracks progress toward the goal of meeting the needs of the motor carrier
industry and facilitating freight movement. The MCS team uses the data to identify
opportunities to improve customer satisfaction.

Measurement and Data Collection:
With the help of Human Resource Employee Development, MCS randomly surveys 1,200 customers
who worked with the division in a given month. Customers choose one of four levels of satisfaction
with the service received from each of MCS' programs and with the division overall. They can also
comment on employee and division performance. Customers who wish to discuss their survey
answers are asked to provide contact information for follow up. The administrative team reviews the
results each month, then discusses quarterly and annual aggregates during MCS Division Tracker
meetings.

Percent of programmed project cost vs award and final – 3a
Tracker Archive – July 2021

*Positive numbers indicate the final (completed) cost was higher than the programmed cost

*Negative numbers indicate savings. Miscellaneous includes right-of-way purchases, utilities and other
costs

*Amounts include STIP road and bridge projects with 2% construction contingency applied
Tracker Archive – July 2021

Write up:

Accurate program cost estimates help MoDOT deliver more timely improvements for
taxpayers. As of July 1, 2021, 440 road and bridge projects were completed in fiscal year 2021
at a cost of $954.9 million. This represents a deviation of 4.3% (or $42.8 million) less than the
programmed cost of $997.7 million. Of the 440 road and bridge projects completed, 61% were
completed within or below budget. In comparison, 58% were completed within or below
budget as of the same date a year ago. There may be projects that have adjustments
pending, which could cause a slight change in the final values.

In addition, 22 multimodal projects were completed at a cost of $17 million, -5.8% (or $1
million) less than the programmed cost of $18 million. A total of 122 local public agency
projects were completed at a cost of $92 million, -5.6% (or $5 million) less than the
programmed cost of $97 million.

The target is a 0% difference, indicating MoDOT is making timely use of available funds. Road
and bridge, multimodal and local public agency projects were within -4.4% of the target in FY
2021. Program versus award numbers for FY 2021 reflect an award amount of -6.5% below the
program estimate. MoDOT continues to monitor this throughout the year.

Purpose:

The measure determines how closely total project costs are compared to the programmed
costs. The programmed cost is considered the project budget.

Measurement and Data Collection:
Completed project costs are reported during the fiscal year in which a project is completed.
Road and bridge project costs include design, right-of-way purchases, utilities, construction,
inspection and other miscellaneous costs. The programmed cost is based on the amount
included in the most recently approved Statewide Transportation Improvement Plan.
Completed costs include actual expenditures. Multimodal and local public agency project
costs typically reflect state and/or federal funds but not local funding contributed toward
such projects.
The target for this measure is set by internal policy and will not change unless policy changes.
Tracker Archive – July 2021

Change order report – 3b
Tracker Archive – July 2021

Write up:
By limiting overruns on contracts, MoDOT can continue to keep its maintenance and
construction commitments. This emphasis, combined with the use of practical design and
value engineering, has contributed to limiting overruns on contracts. MoDOT’s performance
in fiscal year 2021 is 2.2% over the award amount ($19.6 million over the award amount of
$903.5 million worth of projects completed) with 55% of the projects being completed below
the original award amount.
Many factors can affect the ability to complete a project within the targeted 2% of the award
amount. These factors can include design changes, differing conditions, additional work
items and administrative decisions.
For the fourth quarter of FY 2021, MoDOT road and bridge projects were completed 2.3% over
budget, multimodal projects were completed 1.4% under budget and local public agency
projects were completed 2.1% over budget.

Purpose:

This measure tracks the percentage difference of total construction payouts to the original
contract award amounts. This indicates how many changes are made on projects after they
are awarded to the contractor for road, bridge, local public agency and multimodal projects –
aviation, waterway and transit.

Measurement and Data Collection:
system for payment. Change orders document the underrun/overrun of the original contract
cost. Local public agencies and multimodal agencies use staff or consultant resources to set
contract completion dates and track performance.
The target for this measure is set by internal policy and will not change unless policy changes.
Tracker Archive – July 2021

Projects schedule report – 3c
Tracker Archive – July 2021
Tracker Archive – July 2021

Write up:
MoDOT’s customers expect transportation improvements to be completed and roadways
opened quickly with minimal impact to their lives. Delivering projects by the contract
completion date is the target for all projects and is considered a commitment to Missourians
and drivers. Completing projects on time helps maintain credibility with Missourians,
minimizes drivers’ exposure to work zones and provides facilities in good condition that
improve safety and reduce vehicle maintenance costs.
MoDOT works to meet the initial contract completion date by preparing accurate plans and
quantities, setting aggressive but reasonable completion dates and setting liquidated
damages to reinforce completion dates without undue bid risks. In fiscal year 2021, 69% of all
closed-out projects were completed by their planned completion dates.
Weather, additional work or a MoDOT directive sometimes necessitates an authorized
extension of the completion date without any financial assessment to the contractor. In FY
2021, 84% of the closed-out projects were completed by the adjusted dates.
There are times when a contractor misses the contract completion date and the contractor is
assessed damages. Of the road and bridge contracts completed in FY 2021 that did not meet
the original contract date, 23 were extended due to extra work, six were extended due to
utility delays, 19 were extended by MoDOT, 35 were extended due to weather and 21 missed
the completion date with damages assessed totaling $930,900.
The target for this measure is to have at least 80% of projects completed by the original
completion date. At the end of FY 2021, the average number of all contracts completed by the
original completion date was 69%.
Purpose:
This measure tracks the percentage of road and bridge projects opened by the commitment
date established in the contract. This commitment also includes local public agency projects
and multimodal projects (rail, aviation, waterway and transit).

Measurement and Data Collection:
For road and bridge projects, the project manager collaborates with the project team to
establish the project completion day which is specific to when the road or bridge project will
be opened to the public so to eliminate a financial penalty. The resident engineer uses the
SiteManager system to track and document the work. Local public agencies and multimodal
agencies use staff or consultant resources to set contract completion dates and track
performance.

The target for this measure was set by management directive.
Tracker Archive – July 2021

Focus on bridges program – 3d

Write up:

This measure tracks the progress made on the Governor's Focus on Bridges Program. This
program was initiated by Gov. Mike Parson to address 250 bridges in the state. The overall
program will repair or replace 250 bridges across the state.

The Focus on Bridges Program began in fiscal year 2020. During this seventh quarter of the
program, a total of 196 structures have been awarded for construction and 124 structures
have been opened to traffic. The program will be complete when all 250 bridges have been
awarded and opened. The number in progress for the early quarters is decreasing as early
projects are completed.
Purpose:

The purpose of this measure is to track the progress made on the Governor's Focus on Bridges
Program. Two hundred fifty bridges will be awarded to be repaired or replaced by the end of fiscal
year 2023. The measure will track quarterly progress on the number of bridges awarded, bridges in
progress and opened bridges.

Measurement and Data Collection:

The data for this Tracker measure is collected after each Missouri Highway and
Transportation Commission meeting where Statewide Transportation Improvement Program
projects are awarded. Award dates and notice to proceed dates are entered in a list that
includes all 250 Focus on Bridges structures. The Construction and Materials Division as well
as the Communications Division provides the date when each structure is opened to traffic.
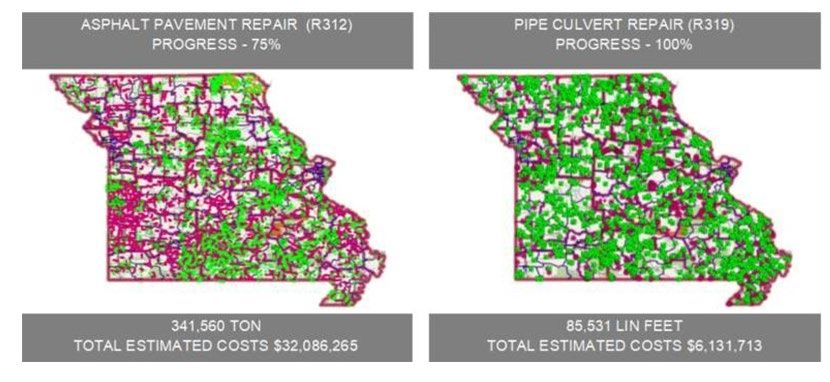
Tracker Archive – July 2021

Maintenance work plan progress– 3e

Write up:

This measure tracks how much of the planned maintenance operation work in the Statewide
Transportation Improvement Program and some additional activities, are accomplished each
year. The measure includes location-specific work such as bridge deck seals and
comprehensive statewide work such as striping. Since 2017, location-specific work in the
STIP has been tracked and the percent of locations accomplished recorded. In the past,
charges were recorded in Cognos, but as of early 2021 they are now tracked using the
Maintenance Management System. Since this is an entirely different approach, the reporting
updates will be changed to year to date status through 2021 and will update moving
forward.
A status report on mowing has been added, assuming 90% of the lane mileage equates to the
number of shoulder miles. This measure will track the quantities of the various planned work
Tracker Archive – July 2021

activities, compare them to the estimated quantities and report that progress as well as the
location-specific progress. This will address the needs to modify plans due to unavoidable
events and will be reported moving forward.
The Work Plan Progress and Budget module in MoDOT's Maintenance Management System
was completed in mid-June 2021. This tool will be utilized going forward to report progress
for this measure. An example visual is provided from MMS demonstrating work plan progress
for Asphalt Pavement Repair and Pipe Culvert Repair for calendar 2021 to date. So far
through mid-July all activities are progressing as expected with the exception of striping
which is only at 27% statewide. This is due to material shortages. The unprecedented freeze
in Texas this winter damaged the main production facilities for the resins used in the
paint. This entire season is expected to be impacted by this supply shortage.

Purpose:
MoDOT publishes the maintenance and operation work plans every year in the STIP for the
first three years. This measure is done to determine how each district adheres to the planned
work activities in the STIP from a location specific standpoint and an overall performance
level regardless of location.
Measurement and Data Collection:

The location specific activities planned in the STIP and other activities such at striping and mowing
are tracked in MMS. Planned amounts are also developed in MMS and are used for determining the
percent of work plan progress. One exception is the mowing, total shoulder miles are estimated at
90% of the lane miles for this measure. This measure could approach 300% towards the end of the
season as multiple mowing cycles are performed each year.

Innovative contracting and value engineering – 3f
Tracker Archive – July 2021

Write up:
MoDOT has delivered more than $2.4 billion in Design-Build contracts that have saved
taxpayers over $314 million and were completed more than 107 months ahead of schedule.
MoDOT leads the nation in partnering with the public and private sectors to deliver projects
that maximize available resources into collaborative solutions that achieve goals. MoDOT’s
Innovative Contracting Program includes Design-Build, A + B Contracting, Fixed Price Variable
Scope and Design-Bid-Build using Alternate Technical Concepts (ATC). Fixed Price Variable
Scope delivery is a new tool for MoDOT that has been added to the innovative contracting
opportunities that will be included in this measure moving forward following successful
delivery of these streamlined projects.

In fiscal year 2021, three Design-Build projects were awarded in the Southeast, Kansas City,
Northeast and Northwest Districts. The Bootheel Bridge Bundle was the first district lead
Tracker Archive – July 2021

Design-Build Project in the Southeast District that will efficiently deliver the rehabilitation
and replacement of 17 bridges while improving safety. The US 169 John Jordan “Buck” O’Neil
Memorial Bridge Project will replace the 60-year-old fracture critical structure with two new,
robust bridges that will provide a century of service and improve safety and mobility. The
FARM Bridge Bundle will efficiently replace 31 Bridges in the Northeast and Northwest District
on critical farm to market roads that are crucial to Missouri’s Agriculture Industry. MoDOT
used innovative contracting to deliver seven of 423 projects in FY 21 accounting for
approximately 29% of the $847.2 million program. The targets for use of innovative
contracting of two projects per year and 10% of program value were both achieved.

MoDOT pursues value throughout the life of a project utilizing the Value Engineering Program.
MoDOT uses design-phase value analysis to identify opportunities for innovation, reduce
project costs and improve project flexibility. MoDOT analyzed 32% of projects during design
phase in FY 21. MoDOT also partners with industry to find more cost-effective solutions
during the construction phase. MoDOT approved 25 VECPs at an 81% approval rate, resulting
in a MoDOT savings of $1.31 million. The target to review 24% of projects in the design-phase
was met this period. The target for increasing VECP savings from the previous year was not
met this period.

Purpose:
This measure tracks the use of innovative contracting methods on MoDOT projects including:
Design-Build contracts, A+B contracts, Fixed Price Variable Scope contracts, and Alternate
Technical Concept contracts. This measure also tracks the use of value engineering during
design and construction on traditional MoDOT projects including: value analysis during the
design phase and construction value engineering proposals.

Measurement and Data Collection:
MoDOT projects utilizing innovative contracting methods are reported during the fiscal year
in which they are awarded. Contract award values are collected through MoDOT’s bid
opening summaries and project records.
A target of 10% of the programmed Statewide Transportation Improvement Program, or two
projects per year, is an appropriate target for utilizing innovative contracting methods in
Missouri.
Information on value analysis during design is gathered from MoDOT’s Statewide
Transportation Improvement Program information management system.
Construction value engineering change proposal information is gathered from Value
Engineering data is collected through MoDOT’s Value Engineering Proposal database.
https://www.modot.org/design-build-
information
http://sp/sites/de/Innovations/default.aspx
Tracker Archive – July 2021

http://sp/sites/de/Innovations/Lead/Forms/AllItems.aspx
file://ghdata022/ghq_public/Value%20Engineering/VECP/Value%20Engineering.mdb
http://sp/sites/de/Innovations/Inovations%20Document%20Library/Forms/AllItems.aspx?Ro
otFolder=%2Fsites%2Fde%2FInnovations%2FInovations%20Document%20Library%2FVE%2
0Documents&FolderCTID=0x012000CD43DF3C2DBA184583A6202132A2CFBD&View=%7B6766
83F5%2D452B%2D4C50%2DA847%2DF6E578CA91F4%7D

Governor’s Cost Share Program – 3g

Write up:

This measure tracks the progress made on the Governor's Transportation Cost Share
program. This program was initiated by Gov. Mike Parson to build partnerships with local
communities to pool efforts and resources to deliver road and bridge projects. The overall
program will deliver 17 projects across the state.
The Governor's Transportation Cost Share Program started in fiscal year 2020. The program
will be complete when all 17 projects have been constructed. The number in progress will
vary as new projects are started and others are completed. For this reporting period, two
projects have been completed, five projects are in construction and 10 have started design
work.
Purpose:

The purpose of this measure is to track the progress made on the Governor's Transportation
Cost Share Program. Seventeen projects will be completed by the end of fiscal year 2023. The
measure will track the quarterly progress of projects based on their stage of project delivery:
design, construction and completion.
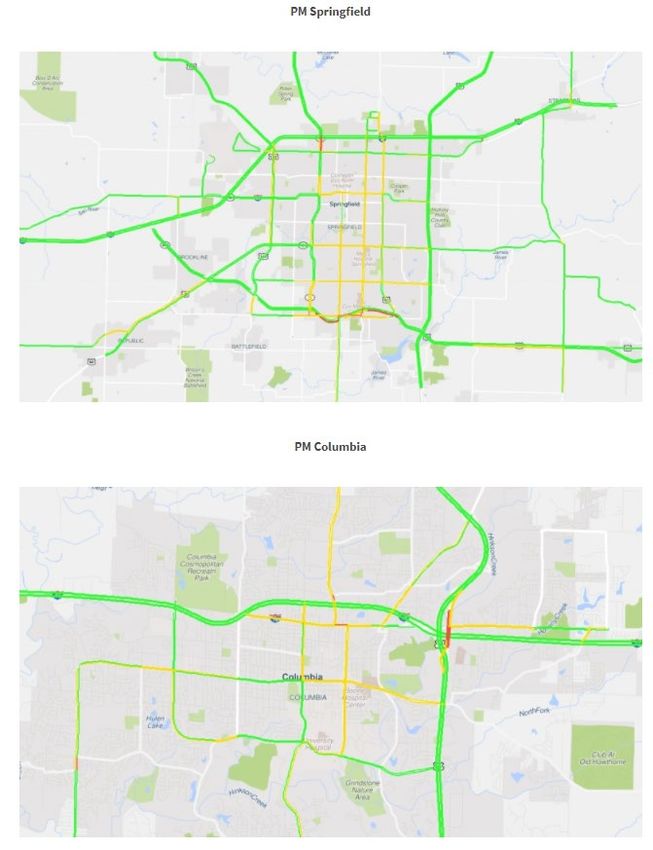
Tracker Archive – July 2021

Measurement and Data Collection:
The data for this Tracker measure is collected from district staff that are responsible for oversight of
the projects. Project delivery milestones are entered into a list that tracks the status of all 17
Governor's Transportation Cost Share projects.

Travel times and reliability on major routes – 4a
Tracker Archive – July 2021
Tracker Archive – July 2021
Tracker Archive – July 2021
Tracker Archive – July 2021
Tracker Archive – July 2021

Write up:
During the second quarter of 2021, average travel times and planning times were generally
higher than 2020, but lower than previous years. Average travel times increased during
morning rush and evening rush in Kansas City compared to the second quarter of 2020.
Average travel times decreased during morning rush and increased during evening rush in St.
Louis. Average speeds across both regions ranged from 56 to 65 mph, which is nearly identical
to the 55 to 65 mph range from the second quarter of last year. The morning average travel
times in both regions were below their respective targets, while the average travel times in
the evening were slightly higher than their targets.
Planning time accounts for unexpected delays and indicates how much time customers need
to plan for their trip in order to arrive on time 95% of the time. In St. Louis, motorists traveling
during morning rush needed to plan 22 seconds more for a 10-mile trip than they would
otherwise need in free-flow conditions. During the evening rush period, customers needed to
plan for an additional 3 minutes, 6 seconds for a 10-mile trip. Customers traveling during the
Kansas City morning rush needed to plan an additional 1 minute, 31 seconds more for a 10-
mile trip than they would need in free-flow conditions. During the evening rush, customers
needed to plan for an additional 4 minutes, 5 seconds of travel. The planning times were
greater than the second quarter of 2020 in all rush periods. The planning times for both
regions represent average rush-hour speeds between 43 and 58 mph.

Purpose:

This measure tracks the mobility of significant state routes in St. Louis, Kansas City,
Springfield, and Columbia.

Measurement and Data Collection:
Travel time data is collected continuously via wireless technology. To assess mobility, MoDOT
compares travel times during rush hour to free-flow conditions where vehicles can travel at
the posted speed limit. This measure also assesses reliability, an indicator of how variable
those travel times are on a daily basis.
The charts in this measure show the average travel time and the 95th percentile travel time,
which is the time motorists should plan in order to reach their destinations timely 95% of the
time.
The maps display the reliability of specific sections of roadways during rush hour.
The targets for average travel time are updated quarterly. The targets are established by
projecting a 10% improvement over the average of the same quarter over the previous two
years. The minimum value for the target time is 10 minutes. This corresponds to the time it
takes to travel 10 miles at the posted speed limit of 60 miles per hour.
Tracker Archive – July 2021

Cost & impact of traffic congestion – 4b

Write up:
Recurring congestion comes at regular times, although the traffic jams are not necessarily
consistent day-to-day. Nonrecurring congestion is an unexpected traffic crash or natural
disaster that affects traffic flow. When either occurs, the time required for a given trip
becomes unpredictable. This unreliability is costly for commuters and truck drivers moving
goods which results in higher prices to consumers.
While the desired trend for both costs is downward, challenges exist in Missouri’s
metropolitan regions and major truck freight corridors that continue to threaten this positive
outcome. A comprehensive look at congestion that goes beyond typical solutions of adding
capacity is needed. Using smarter technology to help guide motorists is a must. Still, the
desired outcome is to lower congestion costs and demonstrate that traffic is moving more
efficiently.
This report looks at the 2017 to 2020 cost of congestion in the urban areas of Kansas City and
St. Louis, as well as rural I-44 and I-70 across the state. The 2020 target for statewide
congestion cost was $634 million. The actual calculation from the Regional Integrated
Transportation Information System data for 2020 was $338 million. Reduction in travel due
You can also read