Optimal diagnosis of the skin cancer using a hybrid deep neural network and grasshopper optimization algorithm
←
→
Page content transcription
If your browser does not render page correctly, please read the page content below
Open Medicine 2022; 17: 508–517
Research Article
Gengluo Li*, Giorgos Jimenez
Optimal diagnosis of the skin cancer using a
hybrid deep neural network and grasshopper
optimization algorithm
https://doi.org/10.1515/med-2022-0439 the various layers of skin, there are two main layers
received June 29, 2021; accepted January 26, 2022 called the epidermis and dermis that act as a protector.
Abstract: When skin cells divide abnormally, it can cause The dermis is a layer that contains blood, hair follicles,
a tumor or abnormal lymph fluid or blood. The masses and glands. The epidermis contains three main types of
appear benign and malignant, with the benign being lim- cells called squamous cells, basal cells, and melanocytes.
ited to one area and not spreading, but some can spread When skin cells divide abnormally, it can cause a
throughout the body through the body’s lymphatic system. tumor or abnormal lymph fluid or blood. The masses
Skin cancer is easier to diagnose than other cancers because appear benign and malignant, with the benign being lim-
its symptoms can be seen with the naked eye. This makes us ited to one area and not spreading, but some can spread
to provide an artificial intelligence-based methodology to throughout the body through the body’s lymphatic system
diagnose this cancer with higher accuracy. This article pro- [1]. Skin cancer is easier to diagnose than other cancers
poses a new non-destructive testing method based on the because its symptoms can be seen with the naked eye.
AlexNet and Extreme Learning Machine network to provide The most common causes of skin cancer are exposure
better results of the diagnosis. The method is then optimized to ultraviolet (UV) rays from direct sunlight or exposure
based on a new improved version of the Grasshopper opti- to chemicals produced by certain types of light bulbs [2].
mization algorithm (GOA). Simulation of the proposed These two factors alter the DNA of the cells we talked
method is then compared with some different state-of- about above, altering the growth and development of
the-art methods and the results showed that the proposed these cells and turning them into cancerous masses [3].
method with 98% accuracy and 93% sensitivity has the The initial formation of cancer in an organ is called
highest efficiency. primary cancer. A malignant mass that has not yet spread
to other parts of the body is called a local. These masses
Keywords: medical imaging, skin cancer, AlexNet, extreme can grow into their blood vessels by attacking the sur-
learning machine, improved grasshopper optimization rounding tissues. Secondary cancer or metastasis occurs
algorithm when cancer cells grow elsewhere and form a new mass.
Therefore, the initial diagnosis of skin cancer can be
so useful for the early detection of this cancer. Diagnosis
of skin cancer is usually possible with a biopsy. But in
1 Introduction most cases, this method is a suffering process in both
pain and time for the patient. Recently, methods such
The skin is the protective layer of the body that covers it as dermoscopy have been used to help diagnose suspected
all around and protects us from sunlight, heat, cold, lesions, but ultimately a skin biopsy should be used to
superficial damage such as wounds and scratches, infec- diagnose the nature of any suspected skin lesions. In
tion, and penetration of bacteria and viruses. Between recent years, research has been conducted on methods
for rapid and accurate diagnosis of skin cancer from der-
moscopic images with different diagnostic accuracy. For
example, Zhang et al. [4] analyzed the diagnose of skin
* Corresponding author: Gengluo Li, School of Information
diseases using an optimum Convolution Neural Network
Engineering, NanChang University, NanChang, Jiangxi 330031,
China, e-mail: 1666970868@qq.com
(CNN). Quick diagnose of skin melanoma helps prevent
Giorgos Jimenez: University of Wisconsin-Madison, Madison, the disease. One of the most widely used methods in the
WI 53706, USA diagnosis of skin diseases is the use of image processing.
Open Access. © 2022 Gengluo Li and Giorgos Jimenez, published by De Gruyter. This work is licensed under the Creative Commons
Attribution 4.0 International License.Skin cancer diagnosis 509
In this study, a new method of CNN based on the Whale metaheuristic algorithms for this purpose is exponentially
optimization algorithm was used to diagnose melanoma. increasing. This study uses a hybrid technique based on
Xu et al. [5] diagnosed melanoma diseases using the deep learning and metaheuristics for the diagnosis of
K-Fuzzy C-, a technique based on the development of the skin cancer. The new metaheuristic is based on an
Red fox optimization (RFO) algorithm. In this study, an improved version of the Grasshopper optimization algo-
optimum pipeline process was used to accurately detect rithm (GOA) which provides results with higher accuracy
the melanoma spots from dermoscopic images. First, after and precision.
pre-processing of the image, areas of the skin were
divided into parts by the C-means Kernel Fuzzy tech-
nique. Then, the main features of the divided skin
are optimally selected by the optimized algorithm. The 2 Materials and methods
results showed that the optimum K-Fuzzy C-means was
the accurate diagnosis of melanoma spots on the skin.
2.1 Dataset
K-Fuzzy C- a technique based on the development of the
RFO algorithm provided more accurate and reliable
The designed module is an optimized deep learning-based
results in the classification of the skin and the detection
system that includes a general form to diagnose cancer
of melanoma spots on the skin.
from the input images, directly. The designed diagnosis
Tan et al. [6] used an intelligent technique to detect
in this study has been programmed in MATLAB R2019b
melanoma spots on the skin. They used Particle swarm
environment and its results are verified by applying to a
optimization (PSO) methods and deep learning techniques.
database, called PH2 [9]. The PH2 database includes some
The deep CNN is optimized by the PSO model. In this
different dermoscopic images that are gathered from the
research, the PSO method was used to optimize the identi-
Dermatology Service of Hospital Pedro Hispano (Mato-
fication of melanoma areas on the skin. The results of the
sinhos, Portugal) under identical conditions. The dataset
developed deep CNN were compared with classical methods
includes 8-bit 768 × 560 resolution RGB color images. The
and statistical tests. The results showed that developed deep
total dataset includes 200 dermoscopic images with 80
CNN had a better ability to detect damaged areas of the skin
atypical nevi, 80 common nevi, and 40 melanomas. This
and melanoma spots compared to classical methods.
database is available at: https://www.fc.up.pt/addi/ph2%
Parsian et al. [7] detected melanoma spots in dermo-
20database.html.
scopic images using the Wildebeest herd optimization
The training and the test data for the benchmarks are
(WHO) algorithm. A common method for diagnosing
set at 80 and 20%, respectively. Figure 1 shows some
skin cancer is a non-invasive dermatoscopic method
samples in the PH2 dataset in this study.
based on ocular inference. Therefore, it is difficult for
specialists to diagnose melanoma spots on the skin.
Therefore, the use of artificial intelligence techniques
can increase the accuracy of diagnosing melanoma. In 2.2 AlexNet
this study, deep learning optimized by WHO algorithm
was used to detect melanoma spots on the skin. The sug- AlexNet is a family of deep neural networks and a sub-
gested model was implemented on the ISIC-2008 skin division of the CNN, which is designed by Alex Krizhevsky
cancer dataset. The data analysis showed that this method and Ilya Sutskever, and Geoffrey Hinton [18]. The Alex
has a high ability to diagnose the disease. network does well the diagnosis targets, for example, the
Khamparia et al. [8] used the deep learning method classification of the ImageNet dataset with high precision
to detect the cancerous spots on the skin. Diagnosis and [10]. In this study, we used the batch normalization (BN)
classification of skin cancer in the early stages of develop- technique for improving the AlexNet reliability to be used
ment can increase the possibility of recovery of patients. as a diagnostic system in skin cancer detection. Due to the
For this purpose, the CNN was used to distinguish benign higher complexity of the database images because of their
from malignant spots. Observation of the results showed higher variance in terms of brightness, the distributions of
good performance of the CNN in the diagnosis and classi- the inputs in AlexNet are different in each layer. This pro-
fication of malignant skin lesions. cess increases the complexity of the system elapsed time
It can be observed from the literature that there are during training of the parameters with good initialization.
different research works for the diagnosis of skin cancer To resolve this problem, BN has been utilized [11]. With CNN
from dermoscopy. The results also show that using training based on the minibatch technique, a normalization510 Gengluo Li and Giorgos Jimenez
Figure 1: Some samples of the PH2 dataset in this study.
transform is used by the activations of the layer to recall the from the initial values of the parameters. Furthermore, BN
constant means and variances. So, with a random valuation adjusts and enhances the networkability generalization.
of a set of variables, (xi : i = 1, 2,…, n), that S defines their
mini-batch values, i.e., S = [z1 , z2,…, zn], their mean value
and variance are formulated as follows:
2.3 Extreme learning machine (ELM)
N
1
meanS = ∑ zi , (1) Because of the dependency of the AlexNet to the previous
N j=1
fully connected layers, it is better to improve it to get
N
1 better results. Therefore, the network is combined with
StDS2 = ∑ (zi − meanS)2 . (2)
N j=1 a popular efficient network, called ELM. This report pre-
sents the model and its relationship with SVM-based
Consequently, the normalized values (
xi ) are modeled as models. These models are in the field of binary classifica-
follows: tion. Of course, with techniques such as the one against
zi − meanS all and one against one, they can be developed in several
zi = , (3)
StDS2 + ε categories. The ELM is a simplified integration of the
PSVM, LS-SVM, and regulatory algorithms. The hidden
where ε is used for preventing steadiness. layers of the ELM model do not need to be tuned, and
Since, in some cases, the normalized activations are these layer functions are determined. Therefore, this net-
not the purpose of the learning goal, the following trans- work has been used for improving the accuracy of the
formation is used for that target: model. A general form of an ELM model has been illu-
yi = a + b × ẑi , (4) strated in Figure 2.
In Figure 2, b defines the bias of the hidden layer, w,
where a and b are two adjustable parameters in the and β describe the input and output weights, respec-
minibatch. tively, x and O represent the input and output.
By considering the BN, the speed for training in the CNNs An important reason for utilizing the ELM network
has been accelerated, such that their independence increases along with AlexNet for skin cancer diagnosis is that itSkin cancer diagnosis 511
algorithm is mathematically modeled and proposed inspired
1 1 o1 by grasshopper attack behavior in nature to solve optimiza-
g(x)
tion problems. Grasshoppers are small insects. But because
1 of the damage, they do to agricultural products, they are a
serious pest for crops. Although grasshoppers are usually
i j oj
found alone in the wild, they belong to the largest group
of insects. The size of a group of grasshoppers can be on a
L
continental scale and can be a big nightmare to the farmers.
L m om A unique aspect of grasshoppers is their group behavior in
childhood and adulthood. Millions of baby grasshoppers
jump and move like rolling hoses, eating and destroying
Figure 2: A general form of an ELM model.
almost every product in their path.
When they grow up, they form groups in the air and
doesn’t need more iterations for training, which enhances
travel long distances to migrate. The main feature of the
its efficiency in terms of convergence.
grasshopper group in the larval stage is their slow move-
With assuming a training set M :
ment and small steps. In contrast, sudden movement is
M = [(x1, t1) , (x2 , t2 ),…,(xn, tn)], (5) the main feature of larger grasshoppers. Searching for
where xi and ti represent the input vector and label, food is another important feature of the grasshopper
respectively. group.
The output matrix for hidden layer H has been The main article of the GOA claims that grasshopper
obtained by the following equation: life inherently has both exploitation and exploration. In
N this way, immature grasshoppers have smooth and con-
H= ∑fi × (wixi + bi ) , l = 1, 2,…, L, (6) tinuous movements, and next to them, adult grasshop-
l=1 pers have completely random and mutant movements.
where N describes the number of hidden nodes and f (⋅ ) Therefore, they have the role of exploitation and explora-
represents the hidden layer activation function. Finally, tion, respectively. As a result, modeling the GOA leads to
the target is to deliver the ELM model output, like the the creation of a powerful and appropriate algorithm [13].
actual sample labels, that is: Therefore, if this behavior is mathematically mod-
Hθ = T, (7) eled, a new nature-inspired algorithm can be designed.
The mathematical model used to simulate the group
where T = [t1, t2,…, tL].
So, the θ obtained by the following equation: behavior of grasshoppers is as follows:
θ = H t T, (8) Xi = Si + Gi + Ai , (9)
where t defines the pseudo-inverse operator. where Xi is the position of the i grasshopper, Si is the
As mentioned before, the ELM model has been used social interaction, Gi is the gravitational force in the i
to replace the preceding layers to decrease the com- grasshopper, and is the horizontal motion of the wind.
plexity of the system for the diagnosis purpose. Note that to create a random behavior, the equation can
One important case in designing the weights and be written as Xi = r1Si + r2Gi + r3Ai where r1, r2 , and r3 are
biases in the conventional methods is that they are random numbers in the range [0, 1]. The Si function,
selected randomly. Here to provide a more optimal model which defines social interaction, is calculated as follows:
for this study, the weights and biases are selected opti- N
mally based on a new improved version of the GOA. Si = ∑ = s(dij )dˆij, j ≠ i, (10)
j
where dij is the distance between grasshopper i and
3 Improved GOA grasshopper j and is calculated as dij = ∣Xj − Xi∣, S is
a function to define the power of social forces, and
3.1 The concept of GOA ‵
Xj − Xi
dij = dij
is a single vector of grasshopper i to the grass-
GOA optimization algorithm was presented for the first hopper j . The function S , which defines social forces, is
time in the year 2017 by Hamian et al. [12]. The proposed calculated as follows:512 Gengluo Li and Giorgos Jimenez
−r
S (r ) = f e l − e−r , (11) It ⎞w
β = βmax − ⎛ (βmax − βmin ) , (16)
⎝ MaxIt ⎠
where f represents the adsorption intensity and l repre-
sents the adsorption length scale. The Gi factor in Equation where βmax is the maximum value and βmin is the minimum
is calculated as follows: value, w is the geometric coefficient, it is the current itera-
Gi = −g ⋅ ēg , (12) tion, and MaxIt is the maximum number of iterations. For
this purpose, the update coefficient w is calculated as
where g is the constant of gravity and eg represents a
follows:
single vector toward the center of the earth. The factor
Ai in equation is calculated as follows: Wmax − Wmin
W = Wmax − it , (17)
Ai = u ⋅ ēw , (13) MaxIt
where u is a floating object constant and ew is a unit where Wmax is the maximum and Wmin is the minimum, it is
vector in the wind direction. Baby grasshoppers have the current iteration, and MaxIt is the maximum iteration.
no wings. As a result, their motion is highly dependent
on the wind direction. By substituting G , S, and A in
Equation this equation can be defined as follows:
N
3.2 Improved GOA
Xj − Xi
Xi = ∑ s(∣Xj − Xi∣) − g × e¯g + u × e¯w . (14)
j = 1, i ≠ j
dij The original GOA has some shortcomings like premature
convergence and lower consistency. This issue motivates
The situation update is as follows:
us to design an improved version of this algorithm with
N
⎛ ubd − lbd modifications on it about the aforementioned issues. Here
Xi = β × ⎜ ∑ β × × s × (∣xjd − xid∣)
j = 1, i ≠ j 2 we used two modifications to improve the algorithm.
⎝
(15)
xj − xi ⎞
× + T¯d,
dij ⎟
⎠ 3.2.1 The quasi-oppositional learning (quasi-OBL)
where ubd is the upper range in the D dimension, lbd is
the low range in the D dimension, d is the value of the D Quasi-oppositional learning is studied here to improve
dimension in the target (the best solution obtained), and the convergence speed of the algorithm. Based on the
β is the reduction coefficient to minimize the neutral zone OBL mechanism, the randomly generated candidate has
and the gravity-repulsion zone. been compared with its symmetric value to select the best
The equation shows that the next position of a grass- one during the process [14].
hopper is defined based on the current position, the target By considering the ith integer (Xi ) in a D-dimensional
position, and the position of the other grasshoppers. Note search space with Lb and Ub as lower and upper limita-
that the first factor in this equation is the current position tions, the symmetric value has been obtained by the fol-
of the grasshopper relative to the other grasshoppers. Keep lowing equation:
in mind that all grasshoppers need to be able to determine X¯i = Lbi + Ubi − Xi , (18)
the position of the search agents around the target.
To balance exploration and exploitation, a parameter where, i = 1, 2,…, D .
is needed to reduce repetition. This increases the utiliza- Besides, the quasi-opposite value (X̆i ) of the ith integer
tion factor, while also increasing the repetition rate. (Xi ) is obtained by the following equation:
Parameter β has been used twice in the above equation
X̆i = r and (Xi , 0.5 × Lbi + Ubi) . (19)
for the following reasons:
- Intra-sigma coefficient β reduces the gravitational-repul-
sive zone and the neutral zone between the grasshoppers.
- The coefficient β outside Sigma strikes a balance between 3.2.2 Merit function (MF)
exploration and exploitation
The MF is another modification that can be utilized for
To balance the two characteristics of exploration and improving the algorithm consistency. This mechanism pro-
operation, the update coefficient is considered as a geo- vides a proper balance between exploration and exploita-
metric sequence, which is calculated as follows: tion. Based on this mechanism, the optimization processSkin cancer diagnosis 513
begins with large steps (exploration), and then, it gradually where the minimum value of all the abovementioned
decreases its steps (exploitation). The MF can be formulated functions is 0.
as follows: To verify the efficiency of the proposed improved
GOA, it is compared with some popular and new algo-
⎧ mF (Xi − 1) X (t ) , mF (Xi ) ≥ mF (Xi − 1) rithms including Black hole (BH) [15], Multi-verse opti-
X (t + 1) = mF (Xi − 1) (20)
⎨ mizer (MVO) [16], Emperor penguin optimizer (EPO) [17],
⎩ Xi , mF (Xi ) < mF (Xi − 1) ,
and the original GOA [18].
where mF (Xi ) describes the MF that is obtained as follows: – BH [15]:
a = [0, 1]; number of stars = 100
∇T g (Xi )X (t ) (Xi )2 – MVO [16]:
mF (Xi ) = Xi − T
∇g (X (t ))2 + , (21)
∇ g (Xi )∇g (Xi ) (X0)2 Traveling distance rate = [0.6, 1]; Wormhole exis-
where X0 and ∇T g (Xi) signify random value and the gra- tence prob. = [0.2, 1]
dient vector of g (Xij ) at point Xi . – EPO [17]
→
A = 1; T ′ = 100; M = 2 ; f = 2 ; S = 1; l = 1.5.
– Bat Optimization [19]
α = 0.9; γ = 0.9.
3.3 Algorithm authentication – GOA [12]
cmin = 1; cmax = 0.00001.
To validate the effectiveness of the proposed improved
Due to the stochastic behavior of the presented improved
GOA, it has been applied to four standard benchmark
GOA, it is run 30 times, independently.
functions including two unimodal and two multimodal
To get a fair analysis, the maximum iteration number
basic functions including Schwefel 2.22 function, Sphere
is set at 200 and the population size is set at 35. The
function, Quartic function, and Rosenbrock function.
programming has been implemented on a 64-bit MATLAB
The studied functions are explained completely in the
R2019b environment. The configuration of the system is
following.
given in Table 1.
Schwefel 2.22: a function with 30 dimensions that is
Table 2 indicates the simulation results of the pre-
limited in the range [−10, 10]. The formula for this func-
sented improved GOA and its comparison with some
tion is as follows:
state-of-the-art metaheuristics based on the mean value
n n
(MEAN) and the standard deviation (SD) value.
F1(x ) = ∑|Xi| + ∏|xi|. (22)
i=1 i=1 As can be inferred from Table 2, the presented IGOA
has the minimum value of the results in terms of the
Sphere: a function with 30 dimensions that is limited in
mean value for all four benchmark functions which indi-
the range [−100, 100]. The mathematical formula for this
cates the better accuracy of this algorithm toward the
function is as follows:
comparative algorithms. Also, on checking the standard
n
deviation in the proposed algorithm, the minimum value
F2 (x ) = ∑xi2. (23)
of this parameter in the functions shows its higher con-
i=1
sistency toward the other state-of-the-art algorithms.
Quartic: a function with 30 dimensions that is limited in
the range [−128, 128]. The mathematical formula for this
function is as follows:
n 4 The proposed network
F3(x ) = ∑ ixi4 + random[0, 1) . (24)
i=1 This part of the article explains the method of optimiza-
Rosenbrock: a function with 30 dimensions that is limited tion for the proposed combined AlexNet and ELM net
in the range [−30, 30]. The mathematical formula for this by considering the batch normalized technique and the
function is as follows: design improved GOA. The method starts with a pre-
trained AlexNet for extracting the features from the dermo-
n−1
F4(x ) = ∑ [100(xi+1 − xi2)2 + (xi − 1)2], (25) scopy images. To resolve the internal covariate shifting
i=1 problem, BN is performed on the layers. Because of the514 Gengluo Li and Giorgos Jimenez
Table 1: The configuration of the system 5 Experimental results
Name Setting The performance analysis has been evaluated based on
Hardware ®
Intel Core™ i7-4720HQ six parameters, accuracy, specificity, precision, F1 score,
CPU 1.60 GHz sensitivity, and Matthew’s correlation coefficient (MCC).
RAM 16 GB The mathematical model of the mentioned measure for-
Frequency 1.99 GHz mulations has been given below:
Operating system Windows 10
Programming software MATLAB R2019b TN
Specificity = × 100, (27)
TN + FP
TP + TN
number of classes in this study, i.e., cancerous and normal, Accuracy = × 100, (28)
TP + TN + FP + FN
the last three layers of the pre-trained network should be
TP
modified. Because the default output number for this net- Precision = × 100, (29)
TP + FP
work is 1,000 nodes.
We also added six numbers of normalization layers, TP
Sensitivity = × 100, (30)
after the convolution and pooling layers. Finally, the ELM TP + FN
network has been addended as the classifier part of the Precision × Sensitivity
F1-score = 2 × × 100, (31)
AlexNet. The best numbers of the layers are achieved Precision + Sensitivity
based on trials and errors. For optimal designing of the
ELM model, its weights and biases are optimally selected MCC
TP × TN − TP × FN
based on the proposed improved GOA. To use the pro- =
posed IGOA for the network optimization, the following (TP + FP) × (TP + FN) × (TN + FP) × (TN + FN)
objective function has been utilized: × 100, (32)
N
where TP, TN, FP, and FN represent the true positive, true
f (w , b ) = ∑ (dj − yj )2 , (26)
negative, false positive, and false negative, respectively.
j=1
Table 3 illustrates the performance analysis of the
where N defines the number of training samples, d and yi proposed method toward some other state-of-the-art
describe the output of the ELM network and the image methods including AlexNet [20], CNN [21], and RCNN
label, respectively. [22] (Figure 3).
Table 2: The simulation results of the suggested improved GOA compared with other studied algorithms
Algorithm Sphere Schwefel 2.22 Quartic Rosenbrock
BH [15] Min 6.5483 0.0125 0.0098 8.2547
Max 3.2648 × 102 2.2648 × 10² 1.3471 × 10³ 0.2871 × 10⁴
AVE 2.2543 × 10² 2.0147 × 10² 2.8471 × 10³ 25.3487
SD 2.0582 × 10⁴ 1.9347 × 10² 2.0841 × 10³ 20.3481
MVO [16] Min 5.0348 1.0095 1.0041 2.4275
Max 254.3547 25.3147 9.1079 32.1284
AVE 145.2648 11.2647 5.2217 25.2647
SD 98.3547 10.2648 4.9647 14.2517
EPO [17] Min 3.9824 5.3473 × 10⁻³ 2.859 × 10⁻³ 1.2174
Max 201.6484 9.6471 5.0054 2.0364
AVE 82.2648 7.0021 2.0417 0.8217
SD 75.2648 5.0647 1.1654 0.6314
GOA [18] Min 1.2543 1.3481 × 10⁻⁵ 1.2517 × 10⁻⁶ 2.2581 × 10−7
Max 95.3487 1.6471 × 10⁻⁴ 4.2476 × 10⁻⁵ 0.6174 × 10⁻⁶
AVE 6.2648 1.1048 × 10⁻⁴ 3.1507 × 10⁻⁵ 1.6174 × 10⁻⁶
SD 44.2648 0.9421 × 10⁻⁴ 4.5973 × 10⁻⁵ 1.3416 × 10⁻⁶
IGOA Min 0.9358 6.3247 × 10⁻⁹ 5.0641 × 10⁻¹⁰ 3.5176 × 10−12
Max 55.0254 1.6471 × 10⁻⁸ 1.9437 × 10⁻⁹ 0.3728 × 10⁻¹¹
AVE 2.3647 1.2517 × 10⁻⁸ 2.6351 × 10⁻⁹ 1.3481 × 10⁻¹¹
SD 1.0254 1.1638 × 10⁻⁸ 2.1647 × 10⁻⁹ 1.0581 × 10⁻¹¹Skin cancer diagnosis 515
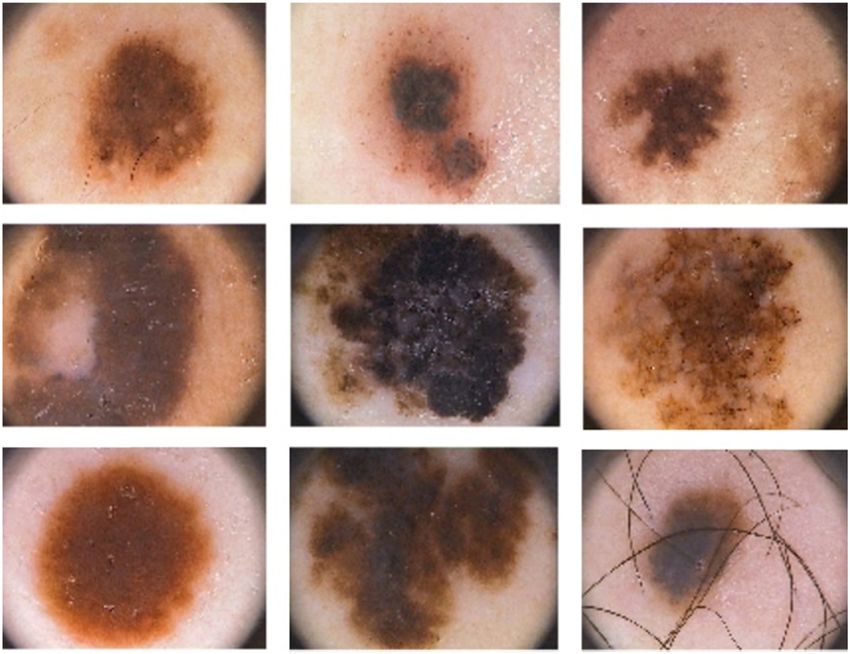
Table 3: The performance analysis of the proposed method toward some other state of the art methods
Method Accuracy Precision Specificity F1-score Sensitivity MCC
AlexNet [20] 0.85 0.95 0.97 0.86 0.77 0.56
CNN [21] 0.97 0.94 0.95 0.95 0.94 0.91
RCNN [22] 0.90 0.91 0.94 0.95 0.90 0.88
AlexNet-ELM-IGOA 0.98 0.96 0.98 0.94 0.93 0.91
1.2
1
0.8
0.6
0.4
0.2
0
Accuracy Precision Specificity F1-score Sensitivity MCC
AlexNet [17] CNN [18] RCNN [19] AlexNet-ELM-IGOA
Figure 3: The classification analysis of the proposed method toward some other state of the art methods.
From Table 3, it has been experimentally proved that TP
PPV = × 100, (33)
the proposed AlexNet-ELM-IGOA technique outperforms the TP + FP
other analyzed methods. For more clarification, it is clear that TN
NPV = × 100, (34)
the proposed methodology with 98% accuracy, 96% preci- TN + FN
sion, 96% specificity, 94% F1-score, 93% sensitivity, and
The comparison results of the simulation are given in
91% MCC has the highest values for all the measurements.
Table 4.
To provide more analysis for the proposed AlexNet-
To provide a graphical clarification, the results are
ELM-IGOA technique, its results are compared with some
also shown in Figure 4.
other methods including Brinker et al. [23], Mustafa and
As can be seen from Table 3 and Figure 4, the proposed
Kimura [24], Babino et al. [25], Hagerty et al. [26], and Bi
method has the highest accuracy again which shows its
et al. [27] from literature. To perform the analysis, sensi-
superiority toward the second series comparative algo-
tivity, accuracy, specificity, and negative predictive value
rithms; however, Brinker et al. and Babino et al. methods
(NPV), and positive predictive value (PPV) measures are
with 84 and 82% are placed in the second and the third
utilized where:
Table 4: The comparison results of the simulation
Method Sensitivity Specificity PPV NPV Accuracy
Proposed Method 0.93 0.98 0.86 0.88 0.98
Brinker et al. [23] 0.84 0.86 0.78 0.81 0.84
Bi et al. [27] 0.79 0.75 0.68 0.87 0.75
Hagerty et al. [26] 0.75 0.72 0.64 0.83 0.72
Mustafa and Kimura [24] 0.74 0.72 0.63 0.85 0.70
Babino et al. [25] 0.80 0.88 0.79 0.76 0.82516 Gengluo Li and Giorgos Jimenez
Babino’s [26]
Mustafa’s [25]
Hagerty’s [27]
Bi’s [28]
Brinker’s [24]
Proposed Method
0 0.2 0.4 0.6 0.8 1 1.2
Accuracy NPV PPV Specificity Sensitivity
Figure 4: The classification analysis of the proposed method toward some other state of the art methods.
ranks. Then, Bi’s method with 75% accuracy, Hagerty’s Conflict of interest: Authors state no conflict of interest.
method with 72%, and Mustafa’s with 70% accuracy are in
the next positions. Likewise, the proposed method with 93% Data availability statement: The database for our study is
sensitivity provides the highest reliability in solving the diag- available in: https://www.fc.up.pt/addi/ph2%20database.html.
nosis problem. A higher value of the specificity (98%) of the
proposed method toward the others specifies its sophisti-
cated occurrence-independent values.
References
[1] Pejin B, Jovanovic KK, Mojovic M, Savic AG. New and highly
6 Conclusion potent antitumor natural products from marine-derived fungi:
covering the period from 2003 to 2012. Curr Top Medicinal
Melanoma is the most dangerous skin cancer with a high Chem. 2013 Nov 1;13(21):2745–66.
[2] Pejin B, Mojovic M, Savic AG. Novel and highly potent
mortality rate, and the most worrying thing is that the
antitumour natural products from cnidarians of marine origin.
more fashionable tanning becomes in the world, the Nat Product Res. 2014 Dec 17;28(24):2237–44.
higher the incidence of this disease. The main benefit of [3] Pejin B, Jovanovic KK, Savic AG. New antitumour
diagnosing the first symptoms of melanoma is seeing a natural products from marine red algae: covering the
doctor and getting treatment very quickly, which will period from 2003 to 2012. Mini Rev Medicinal Chem.
2015 Jan 1;15(9):720–30.
be more helpful. One non-destructive test for this pur-
[4] Zhang N, Cai YX, Wang YY, Tian YT, Wang XL, Badami B. Skin
pose is to use dermoscopy images. To reduce human
cancer diagnosis based on optimized convolutional neural
errors, recently, image processing and artificial intelli- network. Artif Intell Med. 2020 Jan 1;102:101756.
gence techniques have been utilized. Therefore, in this [5] Xu Z, Sheykhahmad FR, Ghadimi N, Razmjooy N. Computer-
study, a new configuration of the deep learning based on aided diagnosis of skin cancer based on soft computing
the AlexNet and ELM network was utilized to provide techniques. Open Med. 2020 Jan 1;15(1):860–71.
[6] Tan TY, Zhang L, Lim CP. Intelligent skin cancer diagnosis
better results of the diagnosis. To get better results, the
using improved particle swarm optimization and deep learning
weights and biases of the network were optimally selected models. Appl Soft Comput. 2019 Nov 1;84:105725.
based on an improved version of the GOA. The final results [7] Parsian A, Ramezani M, Ghadimi N. A hybrid neural network-
showed that the proposed method with 98% accuracy and gray wolf optimization algorithm for melanoma detection.
93% sensitivity provides the highest accuracy compared to Biomed Res (0970-938X). 2017 Nov 18;28(8):3408–11.
[8] Khamparia A, Singh PK, Rani P, Samanta D, Khanna A, Bhushan B.
the other methods.
An internet of health things-driven deep learning framework for
detection and classification of skin cancer using transfer learning.
Funding information: The authors received no financial Trans Emerg Telecommun Technol. 2021 Jul;32(7):e3963.
support for the research, authorship, and/or publication [9] Leng H, Li X, Zhu J, Tang H, Zhang Z, Ghadimi N. A new wind
of this article. power prediction method based on ridgelet transforms, hybridSkin cancer diagnosis 517
feature selection and closed-loop forecasting. Adv Eng Inform. [19] Yang XS, Gandomi AH. Bat algorithm: a novel approach for
2018 Apr 1;36:20–30. global engineering optimization. Eng Comput.
[10] Hagh MT, Ebrahimian H, Ghadimi N. Hybrid intelligent water 2012;29:464–83.
drop bundled wavelet neural network to solve the islanding [20] Hosny KM, Kassem MA, Fouad MM. Classification of skin
detection by inverter-based DG. Front Energy. 2015 lesions into seven classes using transfer learning with
Mar;9(1):75–90. AlexNet. J Digital Imaging. 2020;33(5):1325–34.
[11] Razmjooy N, Sheykhahmad FR, Ghadimi N. A hybrid neural [21] Chabi Adjobo E, Sanda Mahama AT, Gouton P, Tossa J.
network–world cup optimization algorithm for melanoma Proposition of convolutional neural network based
detection. Open Med. 2018 Jan 1;13(1):9–16. system for skin cancer detection. In 2019 15th International
[12] Hamian M, Darvishan A, Hosseinzadeh M, Lariche MJ, Conference on Signal-Image Technology & Internet-Based
Ghadimi N, Nouri A. A framework to expedite joint energy- Systems (SITIS). 2019. p. 35–39, doi: 10.1109/SITIS.2019.
reserve payment cost minimization using a custom-designed 00018.
method based on mixed integer genetic algorithm. Eng Appl [22] Liu J, Chen C, Liu Z, Jermsittiparsert K, Ghadimi N. An IGDT-
Artif Intell. 2018 Jun 1;72:203–12. based risk-involved optimal bidding strategy for hydrogen
[13] Ghadimi N. A new hybrid algorithm based on optimal fuzzy storage-based intelligent parking lot of electric vehicles.
controller in multimachine power system. Complexity. J Energy Storage. 2020 Feb 1;27:101057.
2015;21.1:78–93. [23] Brinker TJ, Hekler A, Enk AH, Berking C, Haferkamp S,
[14] Razmjooy N, Ramezani M, Ghadimi N. Imperialist competitive Hauschild A, et al. Deep neural networks are superior to der-
algorithm-based optimization of neuro-fuzzy system para- matologists in melanoma image classification. Eur J Cancer.
meters for automatic red-eye removal. Int J Fuzzy Syst. 2017 2019 Sep 1;119:11–7.
Aug;19(4):1144–56. [24] Mustafa S, Kimura A. A SVM-based diagnosis of melanoma
[15] Mirzapour F, Lakzaei M, Varamini G, Teimourian M, Ghadimi N. using only useful image features. In 2018 International
A new prediction model of battery and wind-solar output in Workshop on Advanced Image Technology (IWAIT). IEEE; 2018.
hybrid power system. J Ambient Intell Humanized Comput. [25] Babino G, Lallas A, Agozzino M, Alfano R, Apalla Z,
2019 Jan;10(1):77–87. Brancaccio G, et al. Melanoma diagnosed on digital dermo-
[16] Khodaei H, Hajiali M, Darvishan A, Sepehr M, Ghadimi N. scopy monitoring: a side-by-side image comparison is needed
Fuzzy-based heat and power hub models for cost-emission to improve early detection. J Am Acad Dermatol. 2021 Sep
operation of an industrial consumer using compromise pro- 1;85(3):619–25.
gramming. Appl Therm Eng. 2018 Jun 5;137:395–405. [26] Hagerty JR, Stanley RJ, Almubarak HA, Lama N, Kasmi R, Guo P,
[17] Dhiman G, Kumar V. Emperor penguin optimizer: a bio- et al. Deep learning and handcrafted method fusion: higher
inspired algorithm for engineering problems. Knowl Syst. 2018 diagnostic accuracy for melanoma dermoscopy images. IEEE J
Nov 1;159:20–50. Biomed Health Inform. 2019 Jan 4;23(4):1385–91.
[18] Abualigah L, Yousri D, Abd Elaziz M, Ewees AA, Al-qaness MA, [27] Bi L, Kim J, Ahn E, Kumar A, Feng D, Fulham M. Step-wise
Gandomi AH. Aquila Optimizer: a novel metaheuristic optimi- integration of deep class-specific learning for dermoscopic
zation algorithm. Computers Ind Eng. 2021 Jul 1;157:107250. image segmentation. Pattern Recognit. 2019 Jan 1;85:78–89.You can also read