Overview of Dynamic Contrast-Enhanced MRI in Prostate Cancer Diagnosis and Management
←
→
Page content transcription
If your browser does not render page correctly, please read the page content below
G e n i t o u r i n a r y I m a g i n g • R ev i ew

Verma et al.
Contrast-Enhanced MRI in Prostate Cancer

Genitourinary Imaging
Review

                                                           Overview of Dynamic Contrast-
                  FOCUS ON:

                                                           Enhanced MRI in Prostate Cancer
                                                           Diagnosis and Management
Sadhna Verma1                                                 OBJECTIVE. This article is a primer on the technical aspects of performing a high-quality
Baris Turkbey 2                                            dynamic contrast-enhanced MRI (DCE-MRI) examination of the prostate gland.
Naira Muradyan 3                                              CONCLUSION. DCE-MRI is emerging as a useful clinical technique as part of a multi-
Arumugam Rajesh 4                                          parametric approach for evaluating the extent of primary and recurrent prostate cancer. Per-
Francois Cornud5                                           forming a high-quality DCE-MRI examination requires a good understanding of the techni-
                                                           cal aspects and limitations of image acquisition and postprocessing techniques.
Masoom A. Haider 6
Peter L. Choyke2
Mukesh Harisinghani 7

                                                             P
Verma S, Turkbey B, Muraydan N, et al.                                  rostate cancer is a commonly di-         However, DCE-MRI has become an impor-
                                                                        agnosed tumor in men that repre-         tant component of the multiparametric strat-
                                                                        sents a broad spectrum of severi-        egy and is emerging as a useful clinical tech-
                                                                        ty, ranging from indolent to highly      nique for evaluating the severity, location,
                                                           lethal [1]. The use of prostate-specific antigen      and extent of primary and recurrent pros-
                                                           (PSA) serum screening has increased the diag-         tate cancer. This technique differs from oth-
                                                           nosis of prostate cancer. Prostate cancers are        er functional MRI techniques in that it uses
Keywords: diffusion-weighted imaging, MR spectros-         composed of both indolent and more aggressive         an exogenous contrast agent (low-molecular-
copy, prostate cancer, prostate MRI, tumor angiogenesis
                                                           cancers. The earlier diagnosis of aggressive          weight gadolinium chelate) to assess tumor
DOI:10.2214/AJR.12.8510                                    cancers may account for a recent reduction in         angiogenesis. The purpose of this article is to
                                                           prostate cancer–specific death rates.                 provide a detailed summary of efforts to date
Received December 21, 2011; accepted after revision           One problem with the current standard of           in prostate DCE-MRI as well as to present a
February 24, 2012.                                         care is that elevated PSA values inevitably           guide for performing DCE-MRI in patients
1                                                          lead to random prostate biopsies, which, in           with known or suspected prostate cancer.
  Department of Radiology, University of Cincinnati
Medical Center, 234 Goodman St, PO Box 670761,             turn, lead to the discovery of incidental, of-
Cincinnati, OH 45267-0761. Address correspondence to       ten inconsequential, tumors [2]. Meanwhile,           Prostate Cancer Angiogenesis
S. Verma (drsadhnaverma@gmail.com).                        these same random biopsies may miss signif-              Like many tumors in other organs, prostate
2
                                                           icant disease. Thus, MRI may play a role in           cancer shows earlier and more pronounced
 The Molecular Imaging Program, National Cancer
Institute, National Institutes of Health, Bethesda, MD.
                                                           conjunction with PSA for localizing biopsy            enhancement than surrounding normal pros-
                                                           sites and identifying those tumors more like-         tate tissue on DCE-MRI [3]. This enhance-
3
    iCAD, Inc, Nashua, NH.                                 ly to cause death if left untreated.                  ment pattern is thought to be related to tumor
4
                                                              The current MRI evaluation consists of             angiogenesis. More aggressive tumors have
  University Hospitals of Leicester NHS Trust, Leicester
                                                           one or more anatomic and functional tech-             the ability to initiate an angiogenic “switch”
General Hospital, Leicester, United Kingdom.
                                                           niques, such as T2-weighted MRI, diffusion-           that upregulates molecular pathways, leading
5
    Hôpital Cochin, Paris, France.                         weighted MRI (DWI), MR spectroscopic                  to the production and release of angiogen-
                                                           imaging (MRSI), and dynamic contrast-en-              ic factors, such as the vascular permeability
6
  Department of Radiology, University of Toronto, and      hanced MRI (DCE-MRI). Therefore, the                  factor or vascular endothelial growth factor.
University Health Network, Toronto, ON, Canada.
                                                           current standard is to perform a multipara-           As a result, the number of vessels increases,
7
  Department of Radiology, Massachusetts General           metric prostate MRI examination, recog-               and these newly formed tumor vessels have
Hospital, Harvard Medical School, Boston, MA.              nizing that no single MRI sequence is suf-            higher permeability than do normal vessels
                                                           ficient to characterize prostate cancer. Each         because of weak integrity of the vessel wall
AJR 2012; 198:1277–1288                                    of the functional MR components has clini-            [4–6]. In general, tumor vessels are more per-
0361–803X/12/1986–1277
                                                           cal advantages and limitations, and the opti-         meable than normal vessels, more heteroge-
                                                           mal combination of anatomic and functional            neous in size, and more disorganized. Stud-
© American Roentgen Ray Society                            MR sequences still needs to be established.           ies suggest that the prognosis worsens as the

AJR:198, June 2012                                                                                                                                         1277
Verma et al.
1.5 220
Peak enhancement
200
180
Relative Enhancement
160
1.0
140
Change (%)
Slope
120
100
0.5 80
60
40
20
0.0 Time to peak 0
0 1 2 3 4 5 0 1 2 3 4 5 6 7 8 9 10 11 12 13 14 15 16 17 18 19 20 21 22 23 24
n/a 0.00 17.00 34.00 51.00 68.0 85.0 102.0 119.0 136.0 153.0 170.0
Time (min)
Timepoints After Injection (s)
A B
Bolus injection of gadolinium
vi vi
Extracellular extravascular space, ve
Extracellular extravascular space, ve
Capillary vascular
plasma space, vp
vi vi
Influx, Ktrans
Efflux, kep
Blood flow
vi vi
vi vi
C
Fig. 1—Semiquantitative and quantitative parameters for dynamic contrast-enhanced MRI (DCE-MRI) analysis.
A, Chart shows semiquantitative parameters. Time-signal intensity curves from DCE-MRI show faster and stronger enhancement and faster washout in prostate cancer
(red) than in healthy prostate tissue (blue). Commonly used semiquantitative parameters are derived from enhancement-time curve: onset time, slope of first-pass curve,
time to peak, peak enhancement, and washout.
B, Chart shows differentiation of three patterns of washout phase: type 1 (blue), progressive (enhancement increases over time); type 2 (green), plateau (no change in
enhancement over time); and type 3 (red), wash-out (early faster enhancement followed by decreasing enhancement over time).
C, Diagram shows quantitative parameters and method for calculating pharmacokinetic parameters using four-compartment model devised by Tofts et al [24]. These
compartments are usually expressed as fractions of tissue volume. Where ve is fractional extracellular space, vp is fraction occupied by plasma, and vi is fraction
occupied by intracellular space. Low-molecular-weight contrast agent (yellow dots) distributes exclusively in intravascular blood plasma and in extravascular
extracellular space. Pharmacokinetic parameters listed are Ktrans and kep. Transfer constant, Ktrans , describes diffusion of intravascular contrast medium into extracellular
space. When distribution in body and renal elimination cause contrast medium concentration in plasma to drop below that in extracellular space, contrast medium from
extracellular space diffuses back into plasma, which is described by rate constant, kep . Ktrans [min−1] = permeability surface area product per unit volume of tissue, kep
[min−1] = efflux rate constant, vp = fractional plasma volume, ve = Ktrans / kep = extracellular-extravascular volume fraction.
number of abnormal vessels in prostate can- Dynamic Contrast-Enhanced MRI: lus administration of contrast media combined
cer increases [7, 8]. For instance, it has been Principles and Technique with rapid acquisition methods.
shown that microvessel density, which is es- The term “dynamic” is derived from the mul- DCE-MRI requires the use of serial 3D ac-
tablished by immunohistochemistry on path- tiple serial images that are collected after injec- quisitions before, during, and after a bolus
ologic specimens, is an independent predic- tion of contrast media. The clinical application of low-molecular-weight gadolinium con-
tor of pathologic stage and often correlates of DCE-MRI for prostate cancer is based on trast media, typically via the antecubital vein,
with DCE-MRI results [9]. These histolog- data showing that malignant lesions show ear- using an injection rate of 2–4 mL/s followed
ic observations have prompted an interest in lier and faster enhancement and earlier contrast by a 20-mL saline flush. IV-injected contrast
DCE-MRI for the noninvasive assessment of agent washout compared with healthy prostate agents pass from the arteries to the tissue mi-
prostate cancer. tissues [10, 11] (Fig. 1). This requires fast bo- crovasculature and extravasate within seconds
1278 AJR:198, June 2012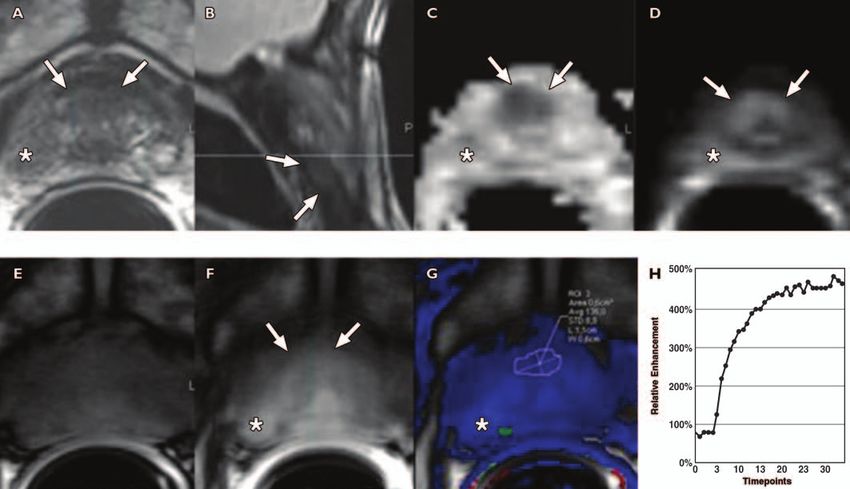
Contrast-Enhanced MRI in Prostate Cancer
TABLE 1: Summary of Dynamic Contrast-Enhanced MRI Protocols
Reconstruction
TR/TE Flip Angle FOV Acquisition Matrix Matrix No. of Thickness Temporal No. of
Vendor (ms) (°) (cm) Resolution (mm) Resolution (mm) Slices (mm) Resolution (s) Phases
GE Healthcare (3 T) 4.6/1.4 15 24 256/0.93 512/0.46 38 3 5.8a 48
GE Healthcare (1.5 T) 4.5/1.6 15 22 160/1.375 256/0.86 26 4 18 21
Philips Healthcare (3 T) 3.65/2.3 9 26.2 188 × 96/1.4 × 2.7 256/1.02 20 3 5.6 54
Siemens Healthcare (1.5 T) 4.9/1.8 10 18 128/1.4 256/0.7b 20 3.5 8.5 35
Note—Examinations performed using endorectal coil. Optimal slice thickness is 3 mm for diagnostic imaging at both 1.5 T and 3 T with maximal thickness of 4 mm.
Dynamic contrast-enhanced acquisition should be continued for at least 5 minutes to detect optimal washout.
aKeyhole approach used during image acquisition.
bKeyhole technique used during postprocessing with true 256 × 256 resolution. Mask dataset acquired before contrast injection.
to the extravascular extracellular space. Ex-
tracellular space is also called the “leakage
space.” Contrast agents in vessels and in the
extracellular space shorten local relaxation
times, leading to a rapid brightening of sig-
nal on T1-weighted sequences. Of course, the
ability to measure vessel leakiness is in part
related to blood flow (i.e., it is difficult to iden-
tify leakiness if the flow is too low). Thus,
the signal measured on DCE-MRI represents
a combination of perfusion and permeability.
A fast injection rate of the contrast agent cap-
tured with fast 3D acquisitions ensures that
early enhancement within prostate tumors rel-
ative to background will be detected. DCE-
MRI is sensitive to alterations in vascular per-
meability, extracellular space, and blood flow.
Image Acquisition
Dynamic contrast-enhancement techniques
typically use 3D T1-weighted fast spoiled gra-
dient-echo MRI sequences to repeatedly image
a volume of interest after the administration of a
bolus of IV contrast agent. T1-weighted spoiled
gradient-echo sequences provide high sensitiv-
ity to T1 changes, high signal-to-noise ratios,
adequate anatomic coverage, and rapid data
acquisition. Typically, 3D image sets are ob-
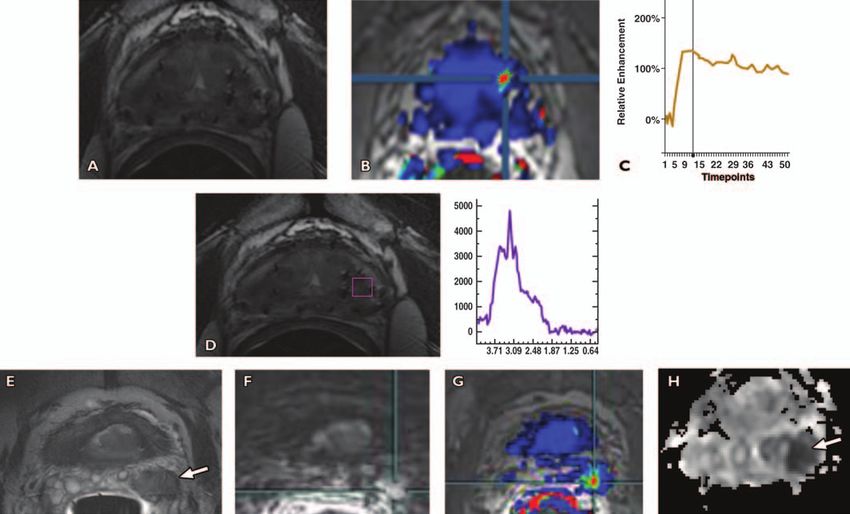
Fig. 2—Typical multiparametric prostate MRI examination in 56-year-old man with prostate-specific antigen tained sequentially every few seconds for up to
level of 4.5 ng/mL and histologically proven prostate cancer with Gleason score of 7 (3 + 4), biopsied 8 weeks
before staging MRI. Patient underwent nerve-sparing radical prostatectomy after staging MRI. 5−10 minutes. Ideally, the acquisitions should
A, Axial T2-weighted image shows low-signal-intensity mass in left midgland to apex peripheral zone (arrow) be obtained approximately every 5 seconds to
and normal right peripheral zone. allow the detection of early enhancement; how-
B, Apparent diffusion coefficient (ADC) map shows restricted diffusion in low-signal mass (arrow) (measured
ADC of carcinoma = 0.72 × 10 −3 mm2 /s).
ever, many centers use acquisition times up to
C, MR spectroscopy image overlying T2-weighted axial image shows high ch + cr / ci (choline + creatine / 10 seconds with good results. Longer acquisi-
citrate) ratio (purple voxel) corresponding to low-signal-intensity mass. MR spectrum from tumor shows tions (e.g., > 15 seconds) are not recommend-
high choline (cho) peak at 3.2 ppm that is above that of citrate (ci) at 2.64 ppm. cho + cr / ci = 1.42, where cr = ed because it becomes harder to identify early
creatine; this value is typical of prostate cancer.
D, Contrast-enhanced images are overlaid on T2-weighted MR image and plot of relative contrast enhancement in enhancement. The rapidity with which MRI
both regions of interest over time is obtained. Early contrast-enhanced T1-weighted gradient-recalled echo image at must be acquired necessitates that larger vox-
peak enhancement and color map (wash-in and washout) show avid enhancement in left midgland peripheral zone els (i.e., lower matrix sizes) must be obtained to
mass (arrows). Healthy peripheral zone tissue is marked by blue square. Prostate cancer (red) shows earlier onset
time, shorter time to peak, and higher peak enhancement than normal peripheral zone tissue. Prostate cancer also maintain adequate signal-to-noise ratios. Thus,
shows early washout of contrast material after maximum enhancement is reached, whereas healthy peripheral zone DCE-MRI is often not as high in resolution as
tissue (blue) shows enhancement plateau during acquisition period (5.8 s/timepoint). conventional T2-weighted sequences.
E and F, Fusion of transverse T2-weighted image with color-encoded Ktrans (forward volume transfer constant)
Spatial resolution and temporal resolution
map (E) and fusion of transverse T2-weighted image with color-encoded kep (reverse reflux rate constant) map
(F) delineate tumor area (arrow). need to be adjusted to avoid significant partial
G, Photomicrograph from prostatectomy specimen shows cancer in left midgland peripheral zone (arrow). volume averaging while obtaining an adequate
AJR:198, June 2012 1279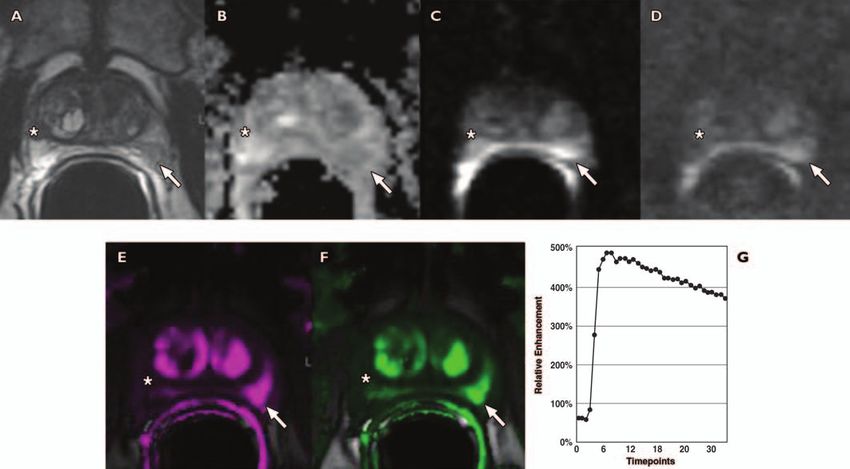
Verma et al.

sampling of the contrast enhancement over time       calculates various curve parameters, some-                                     after initial upslope. Type 3 is considered the
for each tissue voxel. A summary of vendor-spe-      times collectively referred to as “curveolo-                                   most suspicious for prostate cancer, espe-
cific parameters used at the authors’ institutions   gy.” Parameters are obtained to characterize                                   cially if there is a focal asymmetric enhanc-
is provided in Table 1. Although there is ongoing    the shape of the time-intensity curve, such                                    ing lesion; however, type 1 and 2 curves can
debate on the imaging parameters needed for op-      as the time of first contrast uptake, time to                                  be found in prostate cancer as well (Fig. 1B).
timal spatial and temporal resolution to yield the   peak, maximum slope, peak enhancement,                                         Although the semiquantitative approach is
highest diagnostic performance for DCE-MRI of        and wash-in and washout curve shapes. In                                       widely used in the assessment of DCE-MRI,
the prostate, the recently published recommen-       prostate cancer, there is early intense en-                                    it has limitations in terms of generalization
dations from a European consensus meeting sug-       hancement and rapid washout of contrast                                        across acquisition protocols, sequences, and
gest optimal temporal resolution of 5 seconds,       material [3, 13–20] (Fig. 1A).                                                 all other factors contributing to the MR sig-
with maximum temporal resolution of 15 sec-             There are three common dynamic curve                                        nal intensity, which in turn affect curve met-
onds [12]. Depending on the scanner, the num-        types after initial uptake: type 1, persistent                                 rics, such as maximum enhancement and
ber of dynamic series should be as high as pos-      increase; type 2, plateau; and type 3, decline                                 washout percentage.
sible (typically over a period of approximately 5
minutes) to allow optimal curve fitting.

Dynamic Contrast-Enhanced MRI and
Analysis Methods
   The analysis of DCE-MRI can be considered
in the framework of complexity versus stan-
dardization. The most readily accessible analyt-
ic method, but also the least standardized, is the
qualitative approach. The most complex, but
perhaps the most generalizable, method is the
quantitative approach. In between is the semi-                                                                1.5

quantitative or “curveology” approach. Next,
                                                                                       Relative Enhancement

we will consider each approach.                                                                               1.0

   Qualitative—The qualitative, or visual,
analysis of DCE-MRI and its use for pros-
                                                                                                              0.5
tate imaging is based on the general assump-
tion that tumor vessels are leaky and more
readily enhance after IV contrast materi-                                                                     0.0
                                                                                                                    0   8     16       24   32
al is expressed by a fast exchange of blood                                                                                 Timepoints

and contrast media between capillaries and
tumor tissues [7]. Thus, DCE-MRI patterns
for malignant tumors are expected to show
early rapid high enhancement after injection
followed by a relatively rapid decline com-
pared with a slower and continuously in-
creasing signal for normal tissues during the
first few minutes after contrast injection. Us-
ing early (arterial phase) enhancement and
morphologic criteria, higher accuracy and            Fig. 3—52-year-old man with prostate cancer of central gland, Gleason score 7 (4 + 3) and prostate-specific
less interobserver variability have been re-         antigen level of 19.3 ng/mL who underwent negative transrectal ultrasound prostate biopsy. Endorectal
ported for DCE-MRI than for T2-weighted              MRI was performed at 3 T for tumor detection. Axial diffusion-weighted image was markedly distorted and
                                                     nondiagnostic because patient had bilateral hip replacements.
MRI. However, there is overlap of malignant          A, Axial T2-weighted image shows ill-defined homogeneous low-signal-intensity masslike region in left central
and benign tissues, which also varies in dif-        gland (arrow).
ferent prostate zones, limiting the capabili-        B, Sagittal T2-weighted image shows homogeneous low-signal-intensity mass far anteriorly in central gland
ties of the qualitative DCE-MRI approach.            (arrow).
                                                     C, Early contrast-enhanced T1-weighted gradient-recalled echo image (at peak enhancement) (right) shows
Moreover, the qualitative approach is in-            avid enhancement in left central gland corresponding to T2-weighted abnormality (arrow). Benign prostate
herently subjective and therefore difficult to       hypertrophy (BPH) (asterisk) is seen in right central gland. Kinetic curve (percentage of enhancement over time)
standardize among institutions, making mul-          comparison (center) is made between prostate cancer (red) and BPH (blue). Vertical lines show location of
                                                     peak enhancement. BPH shows longer time to peak when compared with prostate cancer. Late enhancement
ticenter trials less reliable.                       pattern in BPH in this case shows washout, although to lesser degree than in prostate cancer. This example
   Semiquantitative—The semiquantitative             shows that BPH enhancement curves have characteristics that may closely resemble cancerous tissue.
approach is also based on the assumption of          Slightly delayed contrast-enhanced T1-weighted gradient-recalled echo image (just past peak enhancement)
early and intense enhancement and washout            (left) shows avid enhancement in entire central gland masking tumor (arrow) (5.8 s/timpoint).
                                                     D and E, Fusion of transverse T2-weighted images with color-encoded maps show utility of color map in
as a predictor of malignancy. Unlike the vi-         identifying tumor. Ktrans (forward volume transfer constant) (D) and kep (reverse reflux rate constant) (E) maps
sual approach, the semiquantitative analysis         delineate tumor area (arrow). Pharmacokinetic parameters may be helpful for better differentiation.

1280                                                                                                                                                            AJR:198, June 2012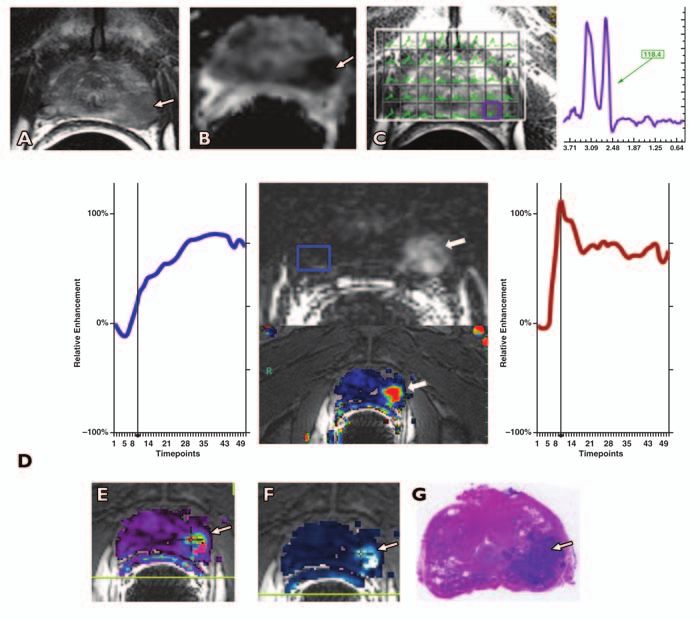
Contrast-Enhanced MRI in Prostate Cancer

   Differences in temporal resolution and in-      for normal brain tissues with an intact BBB.              itself can exchange between the cell and the
jection rates can easily change the shape of       However, as the model gained popularity                   extracellular space, thereby influencing sig-
wash-in/washout curves, making compar-             in tumor applications throughout the body,                nal changes in the extracellular space. The
ison and quantitation difficult. Moreover,         the vascular contribution to signal intensity             pharmacokinetic model (Fig. 1C) is applied
these descriptive parameters provide no            was included as an extension to this model.               to the time-dependent concentration chang-
physiologic insight into the behavior of the       In quantitative DCE-MRI analysis, “tissue”                es of the contrast agent in the artery supply-
tumor vessels. High interpatient variability       is modeled as four compartments: plasma,                  ing the tissue of interest, which is the arterial
also hampers the ability to define threshold       extracellular space, intracellular space, and             input function (AIF), and the tissue contrast
values for each parameter that could stan-         kidney excretory pathway. The intracellu-                 agent concentration [29]. As noted, commer-
dardize this approach. Nevertheless, the rel-      lar space is disregarded in many models be-               cial software packages are now available to
ative simplicity of this approach is appeal-       cause it is assumed that there is no contrast             input DCE-MRI data and produce paramet-
ing, and it has been applied successfully [15].    media exchange with the intracellular space,              ric maps, such as Ktrans and kep maps, that
Thus, relatively simple descriptive parame-        although others have pointed out that water               can be used for diagnostic purposes.
ters are useful in differentiating malignant
from normal and pathologic but benign pros-
tatic tissue [3, 21, 22].
   Quantitative—During the past decade,
the quantitative analysis of DCE-MRI has
gained increasing application in prostate im-
aging because of more widely available soft-
ware methods and a growing consensus on
this approach. The quantitative approach is
based on modeling the concentration change
of the contrast agent using pharmacokinet-
ic modeling techniques. After the work of
Kety [23], which described the flow-limit-
ed tracer uptake in tissue, several pharma-
cokinetic models were proposed by Tofts et
al. [24], Brix et al. [25], and Larsson et al.
[26]. Most of these models are based on de-
termining the rate of contrast exchange be-
tween plasma and extracellular space using
transfer rate constants, such as Ktrans (for-
ward volume transfer constant) and kep (re-
verse reflux rate constant between extracel-
lular space and plasma). These constants are
known to be elevated in many cancers [27,
28]. The transfer constant, Ktrans, is equal
to the permeability surface area product per
unit volume of tissue. Ktrans determines the
flux from the intravascular space to the ex-
tracellular space; it may predominantly rep-
resent the vascular permeability in a perme-
ability-limited situation (high flow relative to
permeability), or it may represent the blood
flow into the tissue in a flow-limited situation
                                                   Fig. 4—65-year-old man with prostate-specific antigen level of 29.1 ng/mL and three prior negative transrectal
(high permeability relative to flow) [29]. The     ultrasound–guided prostate biopsies over past 3 years.
ve is the extracellular extravascular volume       A, Axial T2-weighted image shows subtle asymmetric low-signal focus (arrow) in left anterior-lateral horn of
fraction, and kep = Ktrans / ve expresses the      peripheral zone of midgland.
                                                   B, Apparent diffusion coefficient map shows restricted diffusion in left midgland (arrow).
rate constant, describing the efflux of con-       C, Contrast-enhanced images are overlaid on T2-weighted MR images (wash-in and washout). Color
trast media from the extracellular space back      map shows marked enhancement in left midgland peripheral zone mass (arrow). Plot of relative contrast
to plasma. The vp is the fraction of plasma        enhancement in regions of interest over time shows earlier onset time, shorter time to peak, high peak
                                                   enhancement, and early washout of contrast after maximum enhancement in left midgland peripheral zone
per unit volume of tissue.                         lesion (5.8 s/timepoint).
   The initial model, described by Tofts et        D and E, Pharmacokinetic parameter maps for Ktrans (forward volume transfer constant) (D) and kep (reverse
al. [24], developed for blood-brain barri-         reflux rate constant) (E) show area of increased exchange constants in left anterior-lateral horn of peripheral
er (BBB) permeability measurements ig-             zone of midgland (arrow).
                                                   F and G, On basis of MRI results, MRI-guided biopsy was performed by placing endorectal needle guide (F). An
nored the contribution of the plasma to to-        18-gauge MRI-compatible needle was introduced through needle guide and two core biopsies were obtained
tal tissue concentration, which is acceptable      (G). Pathology of specimen yielded prostate cancer Gleason score of 7 (4 + 3).

AJR:198, June 2012                                                                                                                                            1281
Verma et al.

Fig. 5—Local tumor recurrence after prostatectomy
seen on multiparametric MRI in 64-year-old man with
rising prostate-specific antigen (1.22 ng/dL) 3 months
after radical prostatectomy.
A, Axial T2-weighted MR image through resection
bed shows minimal soft tissue on left (arrow).
B, Axial apparent diffusion coefficient image shows
signal restriction suggesting tumoral pattern (arrow).
C, Axial raw dynamic contrast-enhanced MR image
shows early and diffuse enhancement within left-
sided nodular lesion (arrow).
D, Reverse reflux rate constant (kep ) map derived
from dynamic contrast-enhanced MR image also
localizes left-sided area of nodular enhancement,
compatible with local recurrence (arrow).

   It is important to remember that signal in-
tensity must be converted to T1 values on the
basis of a T1 map because MRI signal inten-
sity is not linear with the gadolinium concen-
tration and the pharmacokinetic models re-
quire concentration values. Thus, T1 maps
are used to generate the concentration curves
of the contrast agent. Moreover, some models
also use AIF, which is individualized to each
patient or pooled on the basis of populations
of patients. Fortunately, a number of software            to cancer but can also be caused by inflam-    ty and limitations of a fully quantitative ac-
programs can now produce parametric col-                  matory conditions. Because of considerable     quisition and analysis, visual and semiquan-
or maps using these model-based parameters                overlap of the rate constants for benign and   titative methods are often substituted when
and can be overlaid on T2-weighted images.                cancerous tissue, DCE-MRI, whether qual-       quantitation is less important.
These maps can be computed after correcting               itative or quantitative, must always be read
for signal intensity and motion (Fig. 2).                 in conjunction with T2-weighted images and     Image Interpretation
   Even though a more complex approach                    DWI or MRSI to obtain better diagnostic           Consensus guidelines are being developed
than semiquantitative methods, quantitative               performance [33–38]. Given the complexi-       internationally for the interpretation of pros-
modeling has the potential for standardiza-
tion across various sequences and parame-
ters. DCE-MRI–driven physiologic param-
eters, such as Ktrans and kep, are elevated in
prostate cancer and have been used to detect
malignancy in the prostate, often in a mul-
tiparametric approach in combination with
other sequences: T2-weighted MRI, DWI,
and MRSI [30–32]. Obtaining stable mea-
surements from quantitative methods re-
mains a challenge because of the number of
variables that can affect it, including chang-
es in cardiac output, challenges in measuring
tissue T1, and problems with measurement of
a tissue AIF. In addition, angiogenesis is not
a constant feature of all tumors, especially
small ones, and not all angiogenesis is due

Fig. 6—Local tumor recurrence in 57-year-old man
who underwent electron-beam radiotherapy because
of tumor with Gleason score of 7 (3 + 4) in left base 3
years ago. Prostate-specific antigen was 2.15 ng/dL
at time of multiparametric MRI.
A and B, Axial T2-weighted images show diffuse low
signal throughout base with no definite tumor.
C, Contrast-enhanced images are overlaid on T2-
weighted MR image. Wash-in and washout color
map shows marked enhancement in anterior base
(cross-hair).

1282                                                                                                                                 AJR:198, June 2012
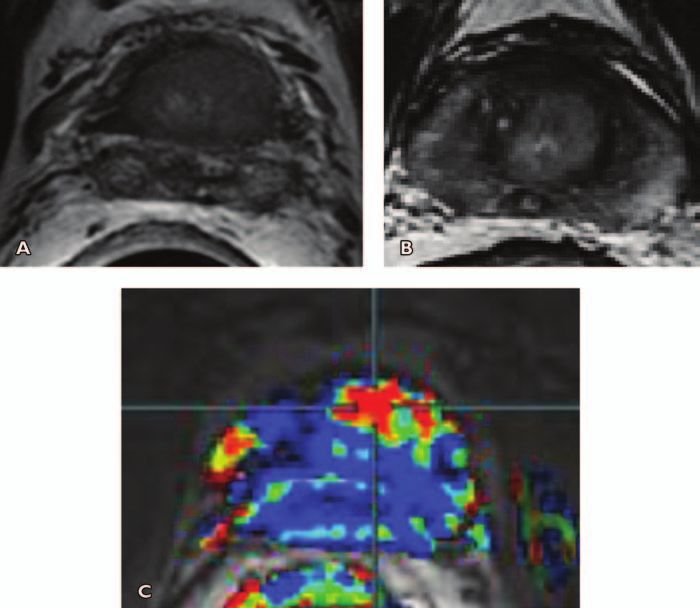
Contrast-Enhanced MRI in Prostate Cancer

Fig. 7—Local tumor recurrence after brachytherapy in 67-year-old man with Gleason score of 7 (3 + 4) in left midgland who underwent transperineal radioactive 125I seed
implantation 8 years ago. Patient had slowly rising prostate-specific antigen level over several years, with level of 2.9 ng/dL at time of multiparametric MRI.
A, Axial T2-weighted image shows featureless prostate gland with 125I seeds and no definite tumor. Diffusion-weighted image showed no signal restriction within
prostate gland.
B, Contrast-enhanced images are overlaid on T2-weighted MRI. Wash-in and washout color map shows marked enhancement in left midgland peripheral zone (cross-
hair).
C, Plot of relative contrast enhancement in regions of interest over time shows earlier onset time, shorter time to peak, high peak enhancement, and early washout of
contrast material in left midgland peripheral zone lesion (5.8 s/timepoint).
D, MR spectroscopy image overlying axial T2-weighted image (purple voxel) in left midgland shows metabolites at 3.2 ppm, corresponding to high (cho) peak and atrophy
in remainder of gland.
E, Axial T2-weighted image shows asymmetric low-signal-intensity enlargement of seminal vesicle on left (arrow).
F and G, Axial raw dynamic contrast-enhanced MR image (F) and color map (G) show early intense enhancement in left seminal vesicle lesion (cross-hair).
H, Apparent diffusion coefficient map derived from diffusion-weighted image shows focal signal restriction in seminal vesicle (arrow).This feature is diagnostic of tumor
recurrence.

tate MRI [39]; however, there is general agree-          duced diffusion, resulting in higher signal on            plasia (BPH). On T2-weighted images, the di-
ment on the major components of multipara-               images with a high b value and reduced sig-               agnosis of a central gland tumor [43] is sup-
metric MRI. The peripheral zone is typically             nal on apparent diffusion coefficient (ADC)               ported by findings of homogeneous low T2
interpreted distinctly from the central gland.           maps. ADC values correlate with the Glea-                 signal intensity, ill-defined irregular edges of
T2-weighted imaging is the oldest and most               son score of prostate cancers [40–42]. DCE-               the suspicious lesion, invasion into the urethra
studied of the MR sequences. Prostate can-               MRI is commonly used in conjunction with at               or the anterior fibromuscular stroma, lack of
cer is characterized by low T2 signal inten-             least two other MR sequences. For instance,               the low-signal-intensity rim commonly seen
sity replacing the normally high T2 signal               regions of the prostate that are low in T2 sig-           in association with BPH, and lenticular shape
intensity in the peripheral zone (Fig. 2A).              nal but that also show rapid wash-in and wash-            [44] (Fig. 3).
However, focal decreases in T2 signal inten-             out or high Ktrans or kep are more suspicious                However, these findings can be misleading
sity can be caused by benign processes, and              for cancer. Thus, these sequences are used to-            because low signal intensity can also be seen
many cancers show minimally reduced T2                   gether and are highly dependent on each other.            in the stromal type of BPH. Thus, in many
signal, making them nearly isointense on T2-                Prostate cancer arising in the central gland           studies, the performance of MRI for the lo-
weighted images. DWI has become a more                   (transition zone, central zone, and anterior fi-          calization of central gland tumors is either not
important ancillary sequence in prostate MRI             bromuscular stroma) are more difficult to di-             specifically reported or lower than for periph-
because of improvements in the ability to sup-           agnose because of the heterogeneity of signal             eral gland tumors [45]. A growing number of
press susceptibility artifacts. Tumors show re-          intensity arising from benign prostatic hyper-            MRI studies have shown that the detection

AJR:198, June 2012                                                                                                                                                  1283
Verma et al.

Fig. 8—Focal prostatitis simulating prostate cancer in 64-year-old man with rising prostate-specific antigen (PSA) level at two PSA levels (5, and 7 ng/m,) with normal
digital rectal examination. Asterisks indicate benign appearance of contralateral nodule showing no restriction of diffusion and no vascularity. Directed biopsies in both
nodules as well as sextant biopsies were negative. PSA level returned to baseline 3 months after biopsy.
A, T2-weighted image shows hypointense signal in left peripheral zone (arrow).
B–D, Apparent diffusion coefficient map derived from diffusion-weighted image (B) shows moderate signal restriction and bright focal signal of left peripheral zone
(arrow), which is more conspicuous at b2000 value (D) than at b1000 value (C).
E–G, Color maps, Ktrans (forward volume transfer constant) (E) and kep (reverse reflux rate constant) (F), and semiquantitative analysis (G) show high color-coded values of
dynamic parameters, Ktrans and kep (arrow), and type 3 curve at semiquantitative analysis (8.5 s/timepoint).

and characterization of prostate cancer can be               A study of DCE-MRI and combined DCE-                    MRSI) had sensitivity of 86% and specific-
significantly improved by performing the im-              MRI-MRSI in 150 patients with a negative                   ity of nearly 100% in a prospective trial of
aging examination on higher magnetic field                prior transrectal ultrasound–guided prostate               45 patients. Multiparametric MRI has been
strength MR scanners (3 T) and using either               biopsy showed that DCE-MRI had sensitiv-                   more successful in the peripheral zone than
DWI or MRSI with DCE-MRI [34–37, 46].                     ity, specificity, and positive and negative pre-           the central gland [35]. A recent study report-
In a multiparametric MRI examination, the                 dictive values of 76.5%, 89.5%, 84.5%, and                 ed that combined use of ADC maps and Ktrans
high sensitivity of DCE-MRI may be used to                83.7%, respectively, and these numbers im-                 values extracted from DCE-MRI improved
select lesions for biopsy. Thus, DCE-MRI is               proved with the combined use of DCE-MRI                    tumor detection in the central gland [38]. As
interpreted both independently and together               and MRSI [46]. Others have shown a high                    experience grows and technology improves,
with other sequences (Fig. 4).                            correlation of DCE-MRI findings in pros-                   the multiparametric MRI approach has also
                                                          tate cancer with whole-mount histopatholo-                 improved and very acceptable detection rates
Clinical Experience With Dynamic                          gy [48, 51, 55]. Thus, DCE-MRI contributes                 can now be obtained from both the peripheral
Contrast-Enhanced MRI                                     valuable information to prostate MRI.                      zone and central gland.
Diagnosis and Local Staging                                  In the last decade, the multiparametric ap-
   The performance of DCE-MRI is usually re-              proach has been shown to improve the accuracy              Detection of Tumor Recurrence:
ported for tumors of significant volume (> 0.5            of prostate MRI. Thus, DCE-MRI must always                 PSA Relapse After Treatment
mL) and Gleason grade (≥ 6) [47]. DCE-MRI                 be viewed in the context of other MRI param-                  Patients are followed by serum PSA and dig-
alone has reported sensitivity and specificity            eters. For instance, one study showed that com-            ital rectal examination after treatment of pros-
ranges of 46–96% and 74–96%, respectively,                bining T2-weighted MRI with DWI and DCE-                   tate cancer. Currently, clinical nomograms are
for detection of tumors, but, as always, these            MRI led to sensitivity of 83%, whereas the                 used to predict the risk of biochemical recur-
ranges are highly dependent on patient se-                sensitivity of DCE-MRI alone was only 43%                  rence; however, these nomograms have some
lection, technique and diagnostic criteria at             [36]. Recently, Turkbey et al. [37] report-                limitations related to their variables, such as the
MRI, pathology correlation method (biopsy                 ed that a four-sequence multiparametric ap-                low specificity of serum PSA and underestimat-
vs whole mount), and tumor size [48–55].                  proach (T2-weighted, DWI, DCE-MRI, and                     ed Gleason score at biopsy.

1284                                                                                                                                                  AJR:198, June 2012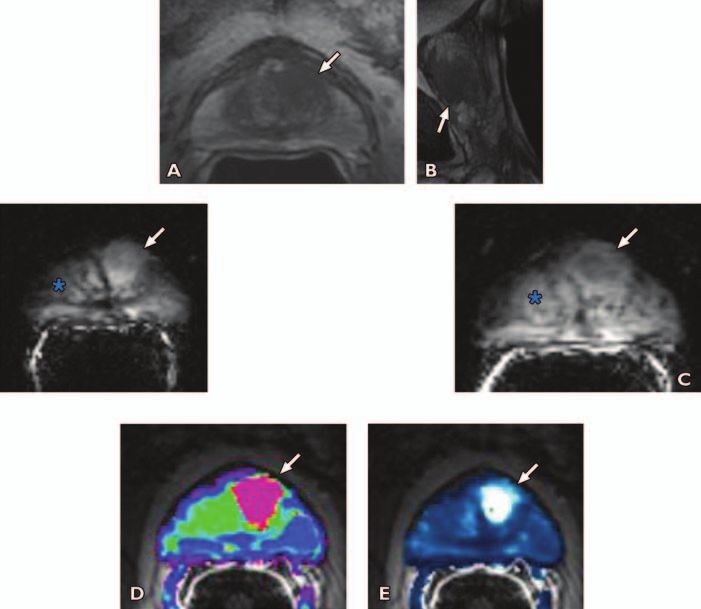
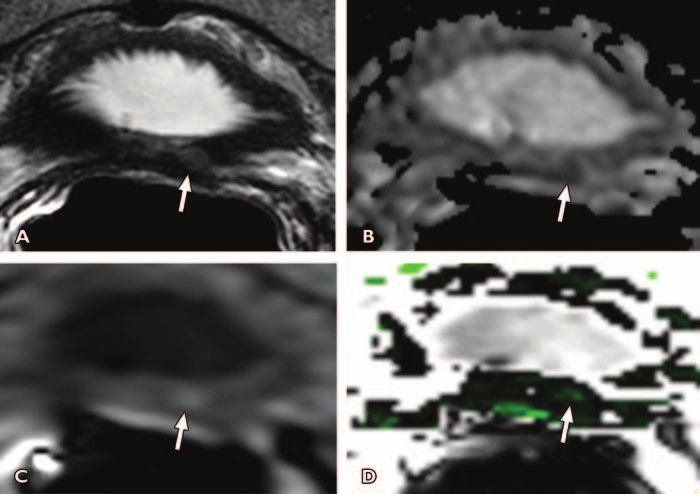
Contrast-Enhanced MRI in Prostate Cancer

Fig. 9—Anterior hypovascular central gland carcinoma in 68-year-old man with prostate-specific antigen level of 11 ng/mL. One set of 12 transrectal ultrasound (TRUS)-
guided prostate biopsy results was negative. Images show focal right nonspecific hypointense signal (asterisk, A) with no significant restriction of diffusion (asterisk,
C and D), and no washout on color-coded quantitative dynamic contrast-enhanced (DCE) map (asterisk, F and G). Four of four positive anterior biopsies directed within
anterior hypointense signal yielded prostate adenocarcinoma, Gleason score of 6, cancer length of 24 mm, negative biopsies in right peripheral zone and in 12 TRUS-
guided prostate biopsies.
A and B, Axial (A) and sagittal (B) T2-weighted MR images show anterior apical homogeneous ill-defined lenticular hypointense signal (arrows), suggesting central gland
tumor.
C and D, Low apparent diffusion coefficient value (C) and bright signal intensity at b1000 diffusion-weighted (D) images suggest malignancy (arrows).
E and F, Unenhanced (E) and qualitative DCE (F) MR images show no significant enhancement in anterior focal area (arrows, F).
G and H, Low-color-coded kep (reverse reflux rate constant) value (G) and type 1 semiquantitative DCE curve (8.5 s/timepoint) (H) suggest benign tissue.

   DCE-MRI has shown the ability to detect                  Biochemical recurrence can occur in 20–                that patients who have a rising PSA level after
cancer recurrence when PSA begins to rise                40% of patients who undergo external-beam                 therapy may benefit from an MRI examination
after a nadir in patients who have undergone             radiation therapy (EBRT) [61]. Detecting re-              to detect recurrent or residual disease.
radical prostatectomy (Fig. 5). For instance,            currence after radiation therapy can be clin-
biochemical relapse after radical prostatecto-           ically challenging because the PSA level                  Limitation and Pitfalls
my can occur in 15–30% of patients [56–59].              may not be a reliable marker, and the digi-                  Despite its advantages, there are a num-
Detection of tumor recurrence after radical              tal rectal examination can be nonspecific due             ber of limitations to DCE-MRI. A major
treatment can be difficult because the lack of           to fibrotic changes in the irradiated prostate            source of error in DCE-MRI is motion. Mo-
normal landmarks and the presence of scar                gland. Multiparametric MRI, specifically                  tion arises from rectal peristalsis and blad-
tissue can lead to uncertainty. Determining              DCE-MRI and MRSI, have shown the abil-                    der filling as well as bulk patient movement.
the site of recurrence is important because              ity to identify tumor recurrence (Figs. 6 and             Because the DCE-MRI study extends over 5
patients with isolated local recurrence can              7) with high accuracy in postradiotherapy pa-             or more minutes, significant misregistration
benefit from further treatments, such as ra-             tients [62–64].                                           between consecutive slices can occur. This
diation to the prostatectomy resection bed.                 Naturally, the most likely site for residu-            can lead to noise in the wash-in and wash-
   Panebianco et al. [60] evaluated 84 patients          al disease after radiation therapy is the site of         out curves, leading to difficulty in fitting the
with suspected local recurrence after prosta-            the original primary tumor [65], supporting               curve with pharmacokinetic models. For in-
tectomy using conventional MRI with MR                   the practice of boosting the radiation dose to            stance, marked anterior prostatic displace-
spectroscopy and DCE-MRI as well as 18F-                 the primary tumor. For prediction of local tu-            ments due to rectal motion can occur dur-
choline PET/CT and concluded that accura-                mor progression of prostate cancer after high-            ing DCE-MRI examinations and can lead to
cy was greater for multiparametric MRI than              intensity focused ultrasound ablation, DCE-               noisy curves [3, 67]. Commercially available
for PET/CT (area under the curve of MRI and              MRI was more sensitive than T2-weighted                   DCE-MRI postprocessing software has been
PET/CT, 0.971 and 0.837, respectively).                  MRI with DWI [66]. These results suggest                  introduced to correct for motion by automat-

AJR:198, June 2012                                                                                                                                                  1285
Verma et al.

                                                                                                          They may prove even more useful in the
                                                                                                          prostate, where the complexity of image in-
                                                                                                          terpretation poses even more burdens on the
                                                                                                          generalist. Also anticipated are further im-
                                                                                                          provements in technology that will enable
                                                                                                          faster 3D acquisitions with built-in motion
                                                                                                          compensation to improve the quality of the
                                                                                                          curves generated from DCE-MRI.

                                                                                                          Conclusion
                                                                                                             DCE-MRI techniques are becoming more
                                                                                                          widely available in clinical practice. The anal-
                                                                                                          ysis of this dynamic data can be performed
                                                                                                          with simple visual or semiquantitative ap-
                                                                                                          proaches or more complex nonstandardized
                                                                                                          quantitative approaches using pharmacoki-
                                                                                                          netic models. DCE-MRI and the correspond-
                                                                                                          ing pharmacokinetic models and parameters
                                                                                                          have shown great potential for improving
                                                                                                          the diagnosis of prostate cancer by adding
                                                                                                          functional information to the anatomic in-
                                                                                                          formation provided by conventional MRI se-
                                                                                                          quences. Semiquantitative methods may be
                                                                                                          sufficient for the principal clinical needs of
Fig. 10—Hemorrhage masking prostate cancer in left midgland in 77-year-old man with serum prostate-       prostate cancer localization and staging. Fur-
specific antigen level of 1.7 ng/dL. Biopsy was performed 8 weeks prior to MRI.
A, Axial T2-weighted MR image shows left midgland peripheral zone lesion (arrow).                         ther clinical validation is necessary to justify
B, Axial T1-weighted MR image shows biopsy related residual hemorrhage within lesion (arrow).             the need for a fully quantitative approach to
C, Axial raw dynamic contrast-enhanced (DCE) MR image shows no enhancement within left midgland           DCE-MRI in prostate cancer localization and
peripheral zone lesion secondary to presence of hemorrhage (arrow).
D, Ktrans (forward volume transfer constant) map derived from DCE MR image is also affected by presence
                                                                                                          staging in current clinical practice.
of hemorrhage (arrow). Pathologic correlation after prostatectomy yielded prostate adenocarcinoma, with      Initial clinical applications of DCE-MRI, in-
Gleason score of 6 in left midgland.                                                                      cluding the detection, localization, and staging
                                                                                                          of prostate cancer as well as the diagnosis of re-
ically repositioning the sequential images so          times. Moreover, the use of AIFs, individual-      currence, show that the technique offers diagnos-
they align better with each other.                     ized or pooled, is another source of variability   tic benefits when compared with conventional
    A central limitation of DCE-MRI is that            among studies. Because there has been an in-       MRI alone and as part of a multiparametric pros-
it is nonspecific. Increased vessel leakiness          crease in availability of commercially available   tate MRI examination. For the radiologist em-
can be seen in prostatitis in the peripheral           postprocessing tools, it is important to pay at-   barking on the use of these techniques, it is es-
zone (Fig. 8) and in highly vascularized BPH           tention to how these available tools process the   sential to develop an understanding of the need
nodules in the central gland. Additionally,            DCE-MRI data to generate parametric maps.          for rapid acquisition, overlap with other diseases
anterior hypovascular transitional zone tu-            Differences in postprocessing algorithms can       (prostatitis, BPH), and familiarity with a variety
mors may not show DCE-MRI uptake (Fig.                 also account for observed differences in the       of analytic methods. Understanding the relative
9). Residual postbiopsy hemorrhage can                 metrics of tumor vascularity. To enable further    advantages, limitations, and potential pitfalls will
also lead to both false-negative (Fig. 10) and         investigation of the value of DCE-MRI of the       improve the interpretation of DCE-MRI results.
false-positive results. Thus, DCE-MRI must             prostate, the technique of DCE-MRI and the
always be viewed in the context of other MRI           pharmacokinetic model used to analyze it must      References
parameters and cannot stand alone as a diag-           become more standardized.                           1. Jemal A, Siegel R, Ward E, Hao Y, Xu J, Thun MJ.
nostic modality regardless of curve shape or                                                                  Cancer statistics, 2009. CA Cancer J Clin 2009;
intensity of enhancement.                              Future Directions                                      59:225–249
    Because investigators use different DCE-              The role of DCE-MRI in prostate cancer           2. Thompson IM, Pauler DK, Goodman PJ, et al.
MRI sequences and different methods of anal-           detection is not in dispute. Looking forward,          Prevalence of prostate cancer among men with a
ysis, there is a lack of standardization in the        a major area of development is international           prostate-specific antigen level ≤ 4.0 ng per millili-
performance of DCE-MRI, making it difficult            standards so that the technique can be tested          ter. N Engl J Med 2004; 350:2239–2246 [erratum
to compare published studies. Shorter acqui-           in multicenter trials. Because of its complex-         in N Engl J Med 2004; 351:1470]
sition times (< 5 seconds per 3D acquisition)          ity, DCE-MRI may also benefit from auto-            3. Engelbrecht MR, Huisman HJ, Laheij RJ, et al.
have generally proven to be more valuable in           mated decision-support systems that suggest            Discrimination of prostate cancer from normal
prostate cancer than longer acquisition times,         to the radiologist areas of abnormality on             peripheral zone and central gland tissue by using
but one cannot reasonably compare two studies          MRI. These have been successfully applied              dynamic contrast-enhanced MR imaging. Radiol-
performed with markedly different acquisition          in screening mammography and breast MRI.               ogy 2003; 229:248–254

1286                                                                                                                                        AJR:198, June 2012
Contrast-Enhanced MRI in Prostate Cancer
4. Nicholson B, Schaefer G, Theodorescu D. Angio- JO. Diffusion and perfusion MR imaging of the for detection—histopathologic correlation. Radi-
genesis in prostate cancer: biology and therapeu- prostate. Magn Reson Imaging Clin N Am 2008; ology 2010; 255:89–99
tic opportunities. Cancer Metastasis Rev 2001; 16:685–695 31. Fütterer JJ, Heijmink SW, Scheenen TW, et al.
20:297–319 18. Casciani E, Polettini E, Carmenini E, et al. En- Prostate cancer localization with dynamic con-
5. Bigler SA, Deering RE, Brawer MK. Comparison dorectal and dynamic contrast-enhanced MRI for trast-enhanced MR imaging and proton MR spec-
of microscopic vascularity in benign and malignant detection of local recurrence after radical prosta- troscopic imaging. Radiology 2006; 241:449–458
prostate tissue. Hum Pathol 1993; 24:220–226 tectomy. AJR 2008; 190:1187–1192 32. Schmuecking M, Boltze C, Geyer H, et al. Dy-
6. Siegal JA, Yu E, Brawer MK. Topography of neo- 19. Bloch BN, Furman-Haran E, Helbich TH, et al. Pros- namic MRI and CAD vs. choline MRS: where is
vascularity in human prostate carcinoma. Cancer tate cancer: accurate determination of extracapsular the detection level for a lesion characterisation in
1995; 75:2545–2551 extension with high-spatial-resolution dynamic con- prostate cancer? Int J Radiat Biol 2009; 85:814–
7. Erbersdobler A, Isbarn H, Dix K, et al. Prognostic trast-enhanced and T2-weighted MR imaging— 824
value of microvessel density in prostate cancer: a initial results. Radiology 2007; 245:176–185 33. Panebianco DL, Maes A. Estimating time to
tissue microarray study. World J Urol 2010; 20. Carlani M, Mancino S, Bonanno E, Finazzi Agro steady state using the effective rate of drug accu-
28:687–692 E, Simonetti G. Combined morphological, [1H]- mulation. Pharm Stat 2011; 10:27–33
8. Mucci LA, Powolny A, Giovannucci E, et al. Pro- MR spectroscopic and contrast-enhanced imag- 34. Sciarra A, Panebianco V, Ciccariello M, et al. Val-
spective study of prostate tumor angiogenesis and ing of human prostate cancer with a 3-Tesla scan- ue of magnetic resonance spectroscopy imaging
cancer-specific mortality in the Health Profes- ner: preliminary experience. Radiol Med (Torino) and dynamic contrast-enhanced imaging for detect-
sionals Follow-Up Study. J Clin Oncol 2009; 2008; 113:670–688 ing prostate cancer foci in men with prior negative
27:5627–5633 21. Jackson AS, Reinsberg SA, Sohaib SA, et al. Dy- biopsy. Clin Cancer Res 2010; 16:1875–1883
9. Brawer MK, Deering RE, Brown M, Preston SD, namic contrast-enhanced MRI for prostate cancer 35. Scherr MK, Seitz M, Muller-Lisse UG, Ingrisch
Bigler SA. Predictors of pathologic stage in pros- localization. Br J Radiol 2009; 82:148–156 M, Reiser MF, Muller-Lisse UL. MR-perfusion
tatic carcinoma: the role of neovascularity. Can- 22. Kiessling F, Lichy M, Grobholz R, et al. Simple (MRP) and diffusion-weighted imaging (DWI) in
cer 1994; 73:678–687 models improve the discrimination of prostate prostate cancer: quantitative and model-based
10. Barentsz JO, Jager G, Mugler JP 3rd, et al. Staging cancers from the peripheral gland by T1-weighted gadobenate dimeglumine MRP parameters in de-
urinary bladder cancer: value of T1-weighted dynamic MRI. Eur Radiol 2004; 14:1793–1801 tection of prostate cancer. Eur J Radiol 2010;
three-dimensional magnetization prepared-rapid 23. Kety SS. The theory and applications of the ex- 76:359–366
gradient-echo and two-dimensional spin-echo se- change of inert gas at the lungs and tissues. Phar- 36. Tamada T, Sone T, Higashi H, et al. Prostate can-
quences. AJR 1995; 164:109–115 macol Rev 1951; 3:1–41 cer detection in patients with total serum prostate-
11 Boetes C, Barentsz JO, Mus RD, et al. MR char- 24. Tofts PS, Wicks DA, Barker GJ. The MRI mea- specific antigen levels of 4–10 ng/mL: diagnostic
acterization of suspicious breast lesions with a surement of NMR and physiological parameters efficacy of diffusion-weighted imaging, dynamic
gadolinium-enhanced turboFLASH subtraction in tissue to study disease process. Prog Clin Biol contrast-enhanced MRI, and T2-weighted imag-
technique. Radiology 1994; 193:777–781 Res 1991; 363:313–325 ing. AJR 2011; 197:664–670
12. Dickinson L, Ahmed HU, Allen C, et al. Mag- 25. Brix G, Semmler W, Port R, Schad LR, Layer G, 37. Turkbey B, Mani H, Shah V, et al. Multiparamet-
netic resonance imaging for the detection, locali- Lorenz WJ. Pharmacokinetic parameters in CNS ric 3T prostate magnetic resonance imaging to
sation, and characterisation of prostate cancer: Gd-DTPA enhanced MR imaging. J Comput As- detect cancer: histopathological correlation using
recommendations from a European consensus sist Tomogr 1991; 15:621–628 prostatectomy specimens processed in custom-
meeting. Eur Urol 2011; 59:477–494 26. Larsson HB, Stubgaard M, Frederiksen JL, Jen- ized magnetic resonance imaging based molds. J
13. Fütterer JJ, Engelbrecht MR, Huisman HJ, et al. sen M, Henriksen O, Paulson OB. Quantitation of Urol 2011; 186:1818–1824
Staging prostate cancer with dynamic contrast- blood-brain barrier defect by magnetic resonance 38. Oto A, Kayhan A, Jiang Y, et al. Prostate cancer:
enhanced endorectal MR imaging prior to radical imaging and gadolinium-DTPA in patients with differentiation of central gland cancer from be-
prostatectomy: experienced versus less experi- multiple sclerosis and brain tumors. Magn Reson nign prostatic hyperplasia by using diffusion-
enced readers. Radiology 2005; 237:541–549 Med 1990; 16:117–131 weighted and dynamic contrast-enhanced MR
14. Haider MA, Chung P, Sweet J, et al. Dynamic 27. van Dorsten FA, van der Graaf M, Engelbrecht imaging. Radiology 2010; 257:715–723
contrast-enhanced magnetic resonance imaging MR, et al. Combined quantitative dynamic con- 39. Barentsz JO, Richenberg J, Clements R, et al.
for localization of recurrent prostate cancer after trast-enhanced MR imaging and (1)H MR spec- ESUR prostate MR guidelines 2012. Eur Radiol
external beam radiotherapy. Int J Radiat Oncol troscopic imaging of human prostate cancer. J 2012; 22:746–757
Biol Phys 2008; 70:425–430 Magn Reson Imaging 2004; 20:279–287 40. Verma S, Rajesh A, Morales H, et al. Assessment of
15. Noworolski SM, Henry RG, Vigneron DB, 28. Knopp MV, Giesel FL, Marcos H, von Tengg- aggressiveness of prostate cancer: correlation of ap-
Kurhanewicz J. Dynamic contrast-enhanced MRI Kobligk H, Choyke P. Dynamic contrast-en- parent diffusion coefficient with histologic grade
in normal and abnormal prostate tissues as de- hanced magnetic resonance imaging in oncology. after radical prostatectomy. AJR 2011; 196:374–381
fined by biopsy, MRI, and 3D MRSI. Magn Reson Top Magn Reson Imaging 2001; 12:301–308 41. Turkbey B, Shah VP, Pang Y, et al. Is apparent
Med 2005; 53:249–255 29. Tofts PS, Brix G, Buckley DL, et al. Estimating diffusion coefficient associated with clinical risk
16. Puech P, Betrouni N, Makni N, Dewalle AS, Vil- kinetic parameters from dynamic contrast-en- scores for prostate cancers that are visible on 3-T
lers A, Lemaitre L. Computer-assisted diagnosis hanced T(1)-weighted MRI of a diffusable tracer: MR images? Radiology 2011; 258:488–495
of prostate cancer using DCE-MRI data: design, standardized quantities and symbols. J Magn Re- 42. Hambrock T, Somford DM, Huisman HJ, et al.
implementation and preliminary results. Int J son Imaging 1999; 10:223–232 Relationship between apparent diffusion coeffi-
Comput Assist Radio Surg 2009; 4:1–10 30. Turkbey B, Pinto PA, Mani H, et al. Prostate can- cients at 3.0-T MR imaging and Gleason grade in
17. Somford DM, Fütterer JJ, Hambrock T, Barentsz cer: value of multiparametric MR imaging at 3 T peripheral zone prostate cancer. Radiology 2011;
AJR:198, June 2012 1287Verma et al.
259:453–461 volume: correlation with radical prostatectomy choline PET/CT in the detection of local prostate
43. Hricak H, Choyke PL, Eberhardt SC, Leibel SA, findings. J Urol 2006; 176:2432–2437 cancer recurrence in men with biochemical pro-
Scardino PT. Imaging prostate cancer: a multidis- 52. Cheikh AB, Girouin N, Colombel M, et al. Evalu- gression after radical retropubic prostatectomy
ciplinary perspective. Radiology 2007; 243:28–53 ation of T2-weighted and dynamic contrast-en- (RRP). Eur J Radiol [Epub 2011 Feb 15]
44. Akin O, Sala E, Moskowitz CS, et al. Transition hanced MRI in localizing prostate cancer before 61. Kuban DA, Thames HD, Levy LB, et al. Long-term
zone prostate cancers: features, detection, local- repeat biopsy. Eur Radiol 2009; 19:770–778 multi-institutional analysis of stage T1-T2 prostate
ization, and staging at endorectal MR imaging. 53. Ogura K, Maekawa S, Okubo K, et al. Dynamic cancer treated with radiotherapy in the PSA era. Int
Radiology 2006; 239:784–792 endorectal magnetic resonance imaging for local J Radiat Oncol Biol Phys 2003; 57:915–928
45. Delongchamps NB, Rouanne M, Flam T, et al. staging and detection of neurovascular bundle in- 62. Akin O, Gultekin DH, Vargas HA, et al. Incre-
Multiparametric magnetic resonance imaging for volvement of prostate cancer: correlation with his- mental value of diffusion weighted and dynamic
the detection and localization of prostate cancer: topathologic results. Urology 2001; 57:721–726 contrast enhanced MRI in the detection of locally
combination of T2-weighted, dynamic contrast- 54. Lemaitre L, Puech P, Poncelet E, et al. Dynamic recurrent prostate cancer after radiation treat-
enhanced and diffusion-weighted imaging. BJU contrast-enhanced MRI of anterior prostate can- ment: preliminary results. Eur Radiol 2011; 21:
Int 2011; 107:1411–1418 cer: morphometric assessment and correlation 1970–1978
46. Panebianco V, Sciarra A, Ciccariello M, et al. with radical prostatectomy findings. Eur Radiol 63. Kara T, Akata D, Akyol F, Karcaaltincaba M, Oz-
Role of magnetic resonance spectroscopic imag- 2009; 19:470–480 men M. The value of dynamic contrast-enhanced
ing ([(1)H]MRSI) and dynamic contrast-en- 55. Isebaert S, De Keyzer F, Haustermans K, et al. MRI in the detection of recurrent prostate cancer
hanced MRI (DCE-MRI) in identifying prostate Evaluation of semi-quantitative dynamic con- after external beam radiotherapy: correlation with
cancer foci in patients with negative biopsy and trast-enhanced MRI parameters for prostate can- transrectal ultrasound and pathological findings.
high levels of prostate-specific antigen (PSA). Ra- cer in correlation to whole-mount histopathology. Diagn Interv Radiol 2011; 17:38–43
diol Med (Torino) 2010; 115:1314–1329 Eur J Radiol 2012; 81:e217–e222 64. Rouvière O, Valette O, Grivolat S, et al. Recurrent
47. Oon SF, Watson RW, O’Leary JJ, Fitzpatrick JM. 56. Han M, Partin AW, Zahurak M, Piantadosi S, Ep- prostate cancer after external beam radiotherapy:
Epstein criteria for insignificant prostate cancer. stein JI, Walsh PC. Biochemical (prostate specific value of contrast-enhanced dynamic MRI in lo-
BJU Int 2011; 108:518–525 antigen) recurrence probability following radical calizing intraprostatic tumor–correlation with bi-
48. Ocak I, Bernardo M, Metzger G, et al. Dynamic prostatectomy for clinically localized prostate opsy findings. Urology 2004; 63:922–927
contrast-enhanced MRI of prostate cancer at 3 T: cancer. J Urol 2003; 169:517–523 65. Pucar D, Hricak H, Shukla-Dave A, et al. Clini-
a study of pharmacokinetic parameters. AJR 57. Catalona WJ, Smith DS. 5-year tumor recurrence cally significant prostate cancer local recurrence
2007; 189:849; [web]W192–W201 rates after anatomical radical retropubic prostatecto- after radiation therapy occurs at the site of pri-
49. Tamada T, Sone T, Jo Y, et al. Prostate cancer: my for prostate cancer. J Urol 1994; 152:1837–1842 mary tumor: magnetic resonance imaging and
relationships between postbiopsy hemorrhage and 58. Kattan MW, Wheeler TM, Scardino PT. Postop- step-section pathology evidence. Int J Radiat On-
tumor detectability at MR diagnosis. Radiology erative nomogram for disease recurrence after col Biol Phys 2007; 69:62–69
2008; 248:531–539 radical prostatectomy for prostate cancer. J Clin 66. Kim CK, Park BK, Lee HM, Kim SS, Kim E. MRI
50. Kim JK, Hong SS, Choi YJ, et al. Wash-in rate on Oncol 1999; 17:1499–1507 techniques for prediction of local tumor progres-
the basis of dynamic contrast-enhanced MRI: use- 59. Zincke H, Oesterling JE, Blute ML, Bergstralh sion after high-intensity focused ultrasonic abla-
fulness for prostate cancer detection and localiza- EJ, Myers RP, Barrett DM. Long-term (15 years) tion of prostate cancer. AJR 2008; 190:1180–1186
tion. J Magn Reson Imaging 2005; 22:639–646 results after radical prostatectomy for clinically 67. Padhani AR, Khoo VS, Suckling J, Husband JE,
51. Villers A, Puech P, Mouton D, Leroy X, Ballereau localized (stage T2c or lower) prostate cancer. J Leach MO, Dearnaley DP. Evaluating the effect of
C, Lemaitre L. Dynamic contrast enhanced, pel- Urol 1994; 152:1850–1857 rectal distension and rectal movement on prostate
vic phased array magnetic resonance imaging of 60. Panebianco V, Sciarra A, Lisi D, et al. Prostate gland position using cine MRI. Int J Radiat Oncol
localized prostate cancer for predicting tumor cancer: 1HMRS-DCEMR at 3T versus [(18)F] Biol Phys 1999; 44:525–533
1288 AJR:198, June 2012You can also read