PEER REVIEW OF "COST OF CAPACITY FOR CALIBRATION OF BELGIAN CRM" STUDY - A report to Elia
←
→
Page content transcription
If your browser does not render page correctly, please read the page content below
PEER REVIEW OF "COST OF
CAPACITY FOR CALIBRATION OF
BELGIAN CRM" STUDY
A report to Elia
OCTOBER 2020
AFRY is an international
engineering, design and
advisory company.

We support our clients to
progress in sustainability
and digitalisation.

We are 17,000 devoted
experts within the fields of
infrastructure, industry and
energy, operating across
the word to create
sustainable solution for
future generations.

Making Future
PEER REVIEW OF "COST OF CAPACITY FOR CALIBRATION OF BELGIAN CRM"
                                                                                             STUDY

CONTACT DETAILS

                     Sean Daly
                     sean.daly@afry.com

                     Alexander Arch
                     alexander.arch@afry.com

AFRY Management Consulting provides leading-edge consulting and advisory services covering
the whole value chain in energy, forest and bio-based industries. Our energy practice is the
leading provider of strategic, commercial, regulatory and policy advice to European energy
markets. Our energy team of over 250 specialists offers unparalleled expertise in the rapidly
changing energy markets across Europe, the Middle East, Asia, Africa and the Americas.

                            Copyright ©2020 AFRY Management Consulting Ltd
                                                    All rights reserved
No part of this publication may be reproduced, stored in a retrieval system or transmitted in any form or by any
means electronic, mechanical, photocopying, recording or otherwise without the prior written permission of AFRY
Management Consulting Ltd (“AFRY”).
This report is provided to the legal entity identified on the front cover for its internal use only. This report may not be
provided, in whole or in part, to any other party without the prior written permission of an authorised representative of
AFRY. In such circumstances additional fees may be applicable and the other party may be required to enter into
either a Release and Non-Reliance Agreement or a Reliance Agreement with AFRY.
                                                       Important

This document contains confidential and commercially sensitive information. Should any requests for
disclosure of information contained in this document be received (whether pursuant to; the Freedom of
Information Act 2000, the Freedom of Information Act 2003 (Ireland), the Freedom of Information Act
2000 (Northern Ireland), or otherwise), we request that we be notified in writing of the details of such
request and that we be consulted and our comments taken into account before any action is taken.
                                                       Disclaimer

While AFRY considers that the information and opinions given in this work are sound, all parties must rely upon their
own skill and judgement when making use of it. AFRY does not make any representation or warranty, expressed or
implied, as to the accuracy or completeness of the information contained in this report and assumes no responsibility
for the accuracy or completeness of such information. AFRY will not assume any liability to anyone for any loss or
damage arising out of the provision of this report.
The report contains projections that are based on assumptions that are subject to uncertainties and contingencies.
Because of the subjective judgements and inherent uncertainties of projections, and because events frequently do not
occur as expected, there can be no assurance that the projections contained herein will be realised and actual results
may be different from projected results. Hence the projections supplied are not to be regarded as firm predictions of
the future, but rather as illustrations of what might happen. Parties are advised to base their actions on an awareness
of the range of such projections, and to note that the range necessarily broadens in the latter years of the projections.

AFRY MANAGEMENT CONSULTING                                                                                 October 2020
                                                                                               2020/Belgian CRM Peer Review
                                                                                                                         3
PEER REVIEW OF "COST OF CAPACITY FOR CALIBRATION OF BELGIAN CRM"
STUDY
TABLE OF CONTENTS
1 EXECUTIVE SUMMARY 5
2 INTRODUCTION 8
2.1 Introduction and background 8
2.2 Structure of this report 8
2.3 Conventions 8
3 FIXED COSTS FOR EXISTING UNITS 10
3.1 Approach and methodology 10
3.2 Review of Section 4.2 of the Fichtner study 11
3.3 Review of section 4.3 of the Fichtner study – OCGTs 12
3.4 Review of section 4.3 of the Fichtner study – CCGTs 31
3.5 Overlap between fixed O&M and lifetime extension costs 47
4 FIXED O&M COSTS FOR PUMPED STORAGE 48
4.1 General assumptions 48
4.2 Fixed OPEX cost assessment 50
4.3 Conclusions 53
AFRY MANAGEMENT CONSULTING October 2020
2020/Belgian CRM Peer Review
4PEER REVIEW OF "COST OF CAPACITY FOR CALIBRATION OF BELGIAN CRM" STUDY
1 EXECUTIVE SUMMARY
The new Belgian Capacity Remuneration Mechanism (CRM) is about to be
introduced with the first capacity auction set to take place in October 2021.
Elia and CREG have been working on the design parameters, including the
fixed cost estimates for existing units. These costs are used for the purposes
of defining the relevant price caps for existing capacity providers.
A study undertaken by Fichtner, and completed in April 2020, provides for
cost estimates for new entrant technologies and existing/operating
technologies in Belgium. We (AFRY) have been requested to review these
cost estimates and provide for a further independent view, and to provide for
estimates for the annual avoidable fixed costs of pumped storage units.
The Fichtner specific O&M cost estimates for existing peaking units is
broadly reasonable, but on the upper end of the spectrum for
turbojet units
Our review of the Fichtner analysis has highlighted the following:
⎯ the EPC cost suggested by Fichtner appears to be on the low side, and we
would recommend that this is set at 180% of the total equipment cost;
⎯ on the other hand, the annual operating cost put forward by Fichtner
appears to be rather conservative, and we would expect this to be
significantly lower;
⎯ the resulting specific O&M cost appears to be reasonable for frame GTs
and aero-derivatives, but on the upper end of the spectrum for turbojet
units.
Table 1 shows our estimates for the specific fixed O&M cost. These are based
n an assumed 800h of operation and 150 starts per annum. More restricted
operation would most likely mean lower maintenance costs and the fixed
O&M would be lower than that presented below.
AFRY MANAGEMENT CONSULTING October 2020
2020/Belgian CRM Peer Review
5PEER REVIEW OF "COST OF CAPACITY FOR CALIBRATION OF BELGIAN CRM" STUDY
Table 1 – Specific O&M cost for existing Belgian OCGTs
Specific fixed
O&M cost
Commercial (€/kW/a)
Capacity
Unit Type operation AFRY
(MW)
date (excl.
Fichtner AFRY
grid
charge)
Angleur 3 - TG31 25 Frame type 1978 25.40 40.68 40.19
Angleur 3 - TG32 25 Frame type 1978 25.40 40.68 40.19
Angleur 4 - TG41 63 Aero 2012 18.49 19.08 18.59
Angleur 4 - TG42 63 Aero 2012 18.49 19.08 18.59
Ham - HAM31 56 Aero 2006 19.38 19.08 18.59
Ham - HAM32 56 Aero 2006 19.38 19.08 18.59
Cierreux 18 Turbojet 1960's 33.83 29.49 29.00
Beerse 32 Turbojet 1960's 28.94 23.07 22.58
Zelzate 18 Turbojet 1960's 33.83 29.49 29.00
Aalter 18 Turbojet 1960's 33.83 29.49 29.00
Zedelgem 18 Turbojet 1960's 33.83 29.49 29.00
Noordschote 18 Turbojet 1960's 33.83 29.49 29.00
Zeebrugge 18 Turbojet 1960's 33.83 29.49 29.00
We are in agreement with the Fictner CCGT specific O&M cost
estimates; however, assuming a more limited operating profile for
existing CCGTs would result in lower annual maintenance costs
Our assessment of the Fichtner existing CCGT cost estimates suggests that
these are reasonable assuming ‘baseload’ operation. We do however,
recognise that existing CCGTs in Belgium are operating in a more mid-merit
fashion. This could then reduce the need for major maintenance, and the
corresponding costs could be lower.
Table 2 shows our specific O&M cost estimates for existing CCGTs in
Belgium. We present our cost estimates assuming both baseload and mid-
merit operation, and including and excluding electricity transmission charges.
AFRY MANAGEMENT CONSULTING October 2020
2020/Belgian CRM Peer Review
6PEER REVIEW OF "COST OF CAPACITY FOR CALIBRATION OF BELGIAN CRM" STUDY
Table 2 – Specific O&M cost for existing Belgian CCGTs
Specific fixed O&M cost (€/kW/a)
AFRY (8000h)
AFRY (4000h)
AFRY (8000h,
AFRY (4000h,
Fichtner
no elec)
no elec)
Commercial
Capacity operation
Unit (MW) Type date
T-Power 425 1x1 2011 41.41 41.39 34.55 36.46 29.62
Seraing 485 2x1 1994 40.21 42.10 34.53 37.16 29.59
Amercoeur 451 1x1 2010 40.58 40.26 33.81 35.32 28.88
Marcinelle 405 1x1 2011 41.73 42.36 35.18 37.42 30.24
Saint-Ghislain 350 1x1 2000 43.14 45.52 37.21 40.59 32.28
Drogenbos 460 2x1 1993 40.65 43.22 35.24 38.28 30.30
Knippergroen 315 1x1 2010 44.13 48.06 38.83 43.12 33.89
Ringvaart 357 1x1 1998 43.14 45.07 36.93 40.13 31.99
Herdersbrug 480 2x1 1998 40.21 42.31 34.66 37.38 29.73
Zandvliet 384 1x1 2005 42.19 43.47 35.90 38.53 30.96
Inesco 138 1x1 2007 53.99 56.46 46.35 51.52 41.42
There is a strong degree of variation in pumped storage annual O&M
costs, and believe that 19 €/kW is a reasonable estimate for Belgian
plants
Our review of different public data sources (from power utilities as well as
authorities) combined with our inhouse knowledge suggests annual fixed
O&M cost for PSP in the range of 10 to 30 €/kWh. There may, however, be a
significant difference between small and large PSP plants, and recommend
the use of an average cost of 19 €/kW for the purposes of defining a typical
fixed O&M value for a pumped storage plant in Belgium.
AFRY MANAGEMENT CONSULTING October 2020
2020/Belgian CRM Peer Review
7PEER REVIEW OF "COST OF CAPACITY FOR CALIBRATION OF BELGIAN CRM" STUDY
2 Introduction
2.1 Introduction and background
With the planned introduction of a Capacity Remuneration Mechanism
(CRM) in Belgium from 2025, and capacity auctions set to take place in
October 2021, Elia (along with CREG) has been working on the design
parameters. One key consideration is the gross (and net) cost of new
entry and the fixed cost estimates for existing units. These costs are used
for the purposes of defining the relevant price caps for new and existing
capacity providers.
A study undertaken by Fichtner (hereafter called the ‘Fichtner study’).
provides for cost estimates for new entrant technologies and for
existing/operating technologies in Belgium. The Fichtner study was
completed in April 2020. Subsequently Elia organised a public
consultation regarding a set of inputs to be used in the calibration
process with the cost estimates in Fichtner report being a focal point.
The objective of this project is to provide Elia with an independent peer
review of sections of the Fichtner report. The focus of this report is:
⎯ Section 4.2 on the detailed cost calculation for shortlisted existing
technologies; and
⎯ Section 4.3 on results for the existing units in Belgium.
We have also been asked to provide estimates for the annual avoidable
fixed costs for pumped storage assets in Belgium.
2.2 Structure of this report
This report is structured as follows:
⎯ Section 3 describes our review of the Fichtner study (Section 4.2 and
Section 4.3 of the Fichtner report), and our assessment of the annual
avoidable fixed costs for existing units;
⎯ Section 4 presents our independent estimates of the annual avoidable
fixed costs for a pumped storage asset in Belgium.
2.3 Conventions
All monetary values quoted in this report are in Euros (€) in real 2019 prices,
unless otherwise stated.
Plant efficiencies throughout this report are defined at the Higher Heating
Value (HHV) basis. Fuel prices are similarly quoted on a gross (HHV) basis.
AFRY MANAGEMENT CONSULTING October 2020
2020/Belgian CRM Peer Review
8PEER REVIEW OF "COST OF CAPACITY FOR CALIBRATION OF BELGIAN CRM" STUDY
2.3.1 Sources
Unless otherwise attributed the source for all tables, figures and charts is
AFRY Management Consulting.
AFRY MANAGEMENT CONSULTING October 2020
2020/Belgian CRM Peer Review
9PEER REVIEW OF "COST OF CAPACITY FOR CALIBRATION OF BELGIAN CRM" STUDY
3 FIXED COSTS FOR EXISTING
UNITS
3.1 Approach and methodology
Our general approach, as agreed with Elia, is as follows:
⎯ extract the values from the Fichtner study;
⎯ opine on whether the numbers proposed by Fichtner are reasonable or
unreasonable, alongside supporting justification; and
⎯ in cases where a number is considered to be unreasonable, provide a
counter proposal with supporting justification.
Any justification provided is also supported by publicly referenced sources
wherever possible. It is only when no such sources are publicly available
that we revert to using our own in-house knowledge and experience.
For the avoidance of doubt, AFRY has not held any discussions with
Fichtner for the purposes of preparing this independent report.
3.1.1 Definition of fixed O&M cost
The fixed O&M cost is considered to include the following components1:
⎯ fixed operating costs including personnel costs, administrative costs,
electricity and gas transmission charges (where applicable);
⎯ the O&M insurance for general liability, machine breakdown and
interruption of operation of a power plant;
⎯ fixed maintenance costs including intra-year maintenance and a provision
for major overhauls that do not necessarily take place on a yearly basis.
3.1.2 Technologies considered
Section 4.3 of the Fichtner study present the results of the detailed cost
calculations for the following existing technologies in Belgium:
⎯ Open cycle gas turbines (OCGTs);
⎯ Combined cycle gas turbines (CCGTs); and
⎯ Combined heat and power (decentralised).
1
Elia document “Explanatory note for the Public consultation on the scenario’s, sensitivities and data for the CRM parameter
calculation for the Y-4 Auction with Delivery Period 2025-2026”, dated May 2020
AFRY MANAGEMENT CONSULTING October 2020
2020/Belgian CRM Peer Review
10PEER REVIEW OF "COST OF CAPACITY FOR CALIBRATION OF BELGIAN CRM" STUDY
Elia has confirmed that combined heat and power (decentralised)
technology shall not be considered further on the basis that such
installations are expected to derive a significant part of their revenues from
sources other than electricity (e.g. from the value of produced heat), and
the respective ‘missing money’ will be more limited 2. The focus of this
review has therefore been on existing OCGT and CCGT technologies in
Belgium.
3.1.3 Publicly referenced sources
The following sources have been used in the preparation of this report:
⎯ “COST OF NEW ENTRANT PEAKING PLANT AND COMBINED CYCLE PLANT
IN I-SEM,” dated August 2018 prepared by Pöyry Management Consulting
(“Pöyry 2018”).
⎯ “PJM Cost of New Entry Combustion Turbines and Combined-Cycle Plants
with June 1, 2022 Online Date” dated April 2018 prepared by the Brattle
Group (“Brattle 2018”);
⎯ Independent Consultant Study to Establish New York ICAP Demand Curve
Parameters for the 2021/2022 through 2024/2025 Capability Years –
Final Report” dated Sept 2020 prepared by Analysis Group, Inc. and
Burns & McDonnell (“Analysis 2020”);
⎯ COST ESTIMATES FOR THERMAL PEAKING PLANT FINAL REPORT” dated
June 2008 prepared by Parsons Brinckerhoff New Zealand Ltd (“Parson
Brinckerhoff 2008”)
⎯ the Gas Turbine World Handbook for the year 2019 (“GTW 2019”).
3.2 Review of Section 4.2 of the Fichtner study
Section 4.2 of the Fichtner Study states that “…this section provides a
detailed cost calculation for the shortlisted existing technologies in
Belgium.”
We note there is no actual detailed cost calculation provided in Section 4.2.
In particular:
⎯ Section 4.2.1, which relates to the fixed O&M costs, lists the components
that are included in the fixed O&M costs, without providing for any
calculation methodology or breakdown for each cost component.
⎯ there are no “numbers” that can be extracted from Section 4.2 for us to
comment on.
The more detailed cost calculation is actually included in Section 4.3, and
this is discussed below.
2Elia document “Explanatory note for the Public consultation on the scenario’s, sensitivities and data for the CRM parameter
calculation for the Y-4 Auction with Delivery Period 2025-2026”, dated May 2020
AFRY MANAGEMENT CONSULTING October 2020
2020/Belgian CRM Peer Review
11PEER REVIEW OF "COST OF CAPACITY FOR CALIBRATION OF BELGIAN CRM" STUDY
3.3 Review of section 4.3 of the Fichtner study – OCGTs
3.3.1 Fichtner study estimates
First, we have extracted the numbers for the different existing OCGTs from
Section 4.3.1 of the Fichtner study. These are presented in the table below.
Table 3 – Fichtner estimates for existing OCGTs
Specific
Annual
Capacity Year of Annual Fixed
Unit name Configuration fixed O&M
(MW) construction O&M costs
costs (€/a)
(€/kW/a)
Angleur 3 50 OCGT - 1,270,000 25.40
Angleur 4 126 OCGT - 2,330,000 18.49
Ham 112 OCGT 2006 2,170,000 19.38
Cierreux 18 Turbojet - 609,000 33.83
Beerse 32 Turbojet - 926,000 28.94
Zelzate 18 Turbojet - 609,000 33.83
Aalter 18 Turbojet - 609,000 33.83
Zedelgem 18 Turbojet - 609,000 33.83
Noordschote 18 Turbojet - 609,000 33.83
Zeebrugge 18 Turbojet - 609,000 33.83
Source: Table 15 of the Fichtner study
We note the following when it comes to the units included in the above
table:
⎯ the “turbojet” units identified in the table above, installed between 1963
and 1968, are of the aircraft jet engine type (make is unknown and we
have assumed Rolls Royce Avon turbojet or similar);
⎯ these engines use kerosene as their fuel3;
⎯ the Angleur 3 plant was originally a 117 MWe combined cycle power
plant, comprising two gas turbine, two heat recovery boilers and one
steam turbine, built in 1978, and the plant was converted to open cycle in
2013;
⎯ the gas turbines are rated at 25 MWe each (TG31 and TG32)4;
3
Experience in Belgium with Aircraft Jet Engine Peaking Units, H. BOSQUET and J. REMEYSEN, presented at the
ASME gas turbine conference & products show, Brussels, Belgium, May 24- 28 1970
4
https://edfluminus.edf.com/edf/la-centrale-electrique-d-angleur
AFRY MANAGEMENT CONSULTING October 2020
2020/Belgian CRM Peer Review
12PEER REVIEW OF "COST OF CAPACITY FOR CALIBRATION OF BELGIAN CRM" STUDY
⎯ the Angleur 4 plant, commissioned in 2012 comprises two Rolls Royce
Trent 60 aeroderivative type gas turbines. The Trent 60 gas turbine was
derived from the Rolls-Royce Trent aero engine for the Boeing 777;
⎯ the gas turbines at Angleur are of the dual fuel type. The gas turbines
are rated for 63 MWe each (TG41 and TG42)5;
⎯ the Ham plant, commissioned in 2006, comprises two Rolls Royce Trent
60 aeroderivative type gas turbines. The plant is designed to burn
natural gas only;
⎯ the gas turbines are rated for 56 MWe each (HAM31 and HAM32)6;
The capacities quoted in the Fichtner table are at ISO conditions (15oC and
60% relative humidity).
We believe it would have been more appropriate for Fichtner to have listed
the individual gas turbines units for the Angleur and Ham facilities, as these
are individually dispatchable units.
It is not clear if the capacity figures in the above table are quoted on a
“clean and new” basis or “average degraded” basis. Average degraded net
plant capacities are typically used for reports of this nature to reflect
expected operations over the life of the relevant asset. New and clean
output is typically degraded by 2% to arrive at an average degraded figure.
3.3.2 Review of Fichtner estimates for Angleur 4 units
Section 4.3.1 of the Fichtner study states that “the numbers provided in
Table 15 are estimated by Fichtner (Fichtner 2020) based on the data
provided for the individual units, the methodology presented (i.a. in
Section 4.2) and Fichtner’s experience as a technical consultant).” Fichtner
2020 is described within the Fichtner study as “Internal data, calculations
and interviews with experts. Stuttgart”. These reference data have not
been provided to us for review.
In the absence of any information to the contrary, we consider it
reasonable to assume that Fichtner estimated the fixed O&M costs for the
existing plants in Belgium in the same way that they estimated the fixed
O&M costs for the gross CONE calculation.
The table below contains an estimate of fixed O&M costs for the Angleur 4
gas turbine units using the methodology used by Fichtner for the gross
CONE calculation (as set out in Section 3.3.3 of the Fichtner study).
5
https://www.rolls-royce.com/media/press-releases-archive/yr-2012/120515-plant-in-belgium.aspx
6
https://www.powerengineeringint.com/world-regions/europe/peak-practice-choosing-a-brand-new-engine-for-
variable-load-generation/
AFRY MANAGEMENT CONSULTING October 2020
2020/Belgian CRM Peer Review
13PEER REVIEW OF "COST OF CAPACITY FOR CALIBRATION OF BELGIAN CRM" STUDY
Table 4 – Fichtner Gross CONE calculation methodology applied to the Angleur 4
units
Parameter Units Value Remark
Plant - Angleur 4
Gas turbine model Trent 60
7
Fuel type Gas/oil (dual)
Rated output MWe 63
EPC cost
Equipment supply €/kW 323 GT World 2019
25% of equipment
Construction €/kW 80.84 supply
5% of equipment
Engineering €/kW 16.168 supply
Total €/kW 420.368
Plant capacity kW 63,000
EPC cost € 26,483,184
Fixed O&M
Fixed operating costs €/a 926,911 3.5% of EPC cost
Operating insurance €/a 132,416 0.5% of EPC cost
Fixed maintenance €/a 132,416 0.5% of EPC cost
Total €/a 1,191,743
Specific fixed O&M cost €/kW/a 18.9 18.49 in Fichtner study
The estimated specific fixed O&M cost (18.9 EUR/kW/a) following this
methodology is broadly aligned with the estimate in Table 15 of the
Fichtner study (18.49 €/kW/a).
The extent to which the Fichtner estimates used in the above calculation
(highlighted in bold text in the above table) is reasonable (or not) is
discussed in the sections below.
7
https://www.rolls-royce.com/media/press-releases-archive/yr-2012/120515-plant-in-belgium.aspx
AFRY MANAGEMENT CONSULTING October 2020
2020/Belgian CRM Peer Review
14PEER REVIEW OF "COST OF CAPACITY FOR CALIBRATION OF BELGIAN CRM" STUDY
EPC cost
Section 3.3.2.1 of the Fichtner study states that “every year the Gas
Turbine Handbook (GTW, 2019) publishes current turbine prices based on
real machines sold…. The main technical components comprise a gas
turbine, generator, associated mechanical and electrical auxiliaries,
systems and an operational control system (GTW, 2019).”
The gas turbine installed at the Angleur 4 facility are of the Trent 60 WLE
type capable of dual fuel operation (63 MWe). The closest unit in the 2019
GT World Handbook is the SGT-A65 DLE (Trent), rated at 61.9 MWe at ISO
conditions, and has a budget equipment supply price of 376 $/kW.
Converting to Euros gives a budget price of 323 €/kW, which is the figure
used in the table above.
The Fichtner study assumes the overall EPC price is 130% of the
“equipment supply” price (adding 25% for construction and 5% for
engineering). We consider this number to be on the low side:
⎯ GTW 2019 states that the “equipment supply” cost is “based on a
standard bare bones single-fuel (gas only) packaged units”. The Fichtner
study then does not make any allowance for the Angleur 4 units having
dual fuel capability.
⎯ GTW 2019 states that “mechanical packages include lube oil and hydraulic
fluid, sumps, pumps, controls and coolers.” The Fichtner study does not
make any allowance for other equipment typically found on an OCGT
plant including a dedicated fire water storage tank and associated fire
water pumps, compressed air plant, liquid fuel storage tank (in case of
dual fuel facilities), a water treatment plant (for water injection purposes
in case of a dual fuel facility), a workshop and warehouse, a natural gas
metering and regulating station, a gas compressor (if needed) etc.
⎯ GTW 2019 states “auxiliary transformers for conditioning power supply for
plant motors are usually optional, as is the main power step up
transformer”. The Fichtner study does not make any allowance for the
cost of the generator step up transformer.
⎯ GTW 2019 states that “that the cost of engineering, construction services
and other project costs can add from 60% to 100% and more of the cost
of equipment alone. A practical rule of thumb is to double the equipment
price for a rough estimate of the total installed cost.” The Fichtner Study
only adds 30%, far less than the 60% to 100% recommended in GTW
2019.
⎯ The EPC cost breakdown for an OCGT plant given in Brattle 2018 shows
that, excluding sales taxes, the overall EPC cost is around 180% of the
total equipment costs (“gas turbine” plus “other equipment”). [Table 9 of
Brattle 2018, CONE Area 3]
⎯ Thermoflow Inc provide a suite of engineering tools that are well-
established and recognised throughout the power generation industry.
The EPC cost breakdown data in the table below has been derived using
the Thermoflow GTPRO software (version 26.1 library) and associated
PEACE module for a similar sized OCGT plant to Angleur 4. The overall
AFRY MANAGEMENT CONSULTING October 2020
2020/Belgian CRM Peer Review
15PEER REVIEW OF "COST OF CAPACITY FOR CALIBRATION OF BELGIAN CRM" STUDY
EPC cost is 173% of the cost of the “equipment supply” cost (referring to
the line item named “Specialised Equipment”).
Table 5 – EPC cost breakdown provided for OCGT plant by PEACE
Cost component % of EPC cost
Specialized Equipment (i.e. GTG package) 58%
Other Equipment 1%
Civil 8%
Mechanical 7%
Electrical Assembly & Wiring 2%
Buildings & Structures 2%
Engineering & Plant Start-up 4%
Contractor's Soft & Miscellaneous Costs 17%
Total EPC Cost 100%
In line with the above, we recommend for the overall EPC cost to be set at
180% of the equipment supply cost, rather than the 130% used in Fichtner
study.
Fixed Operating Cost
The fixed operating costs include “personnel costs, administrative costs,
electricity and gas transmission charges”.
We note that property taxes and land lease costs, which are eligible
operating expenses in Brattle 2018 and Pöyry 2018, are excluded from the
above definition and have not been considered in the Fichtner study or in
the analysis below.
Section 3.3.2.1 of the Fichtner study states that the operating costs are
“usually presented as a percentage of the EPC contact price”. The
percentage used is not explicitly stated in the Fichtner study, however by
comparing the operating costs contained in Table 10 of the Fichtner study
with the EPC costs contained in Table 6, we can infer that Fichtner have
assumed operating costs at 3.5% of the EPC cost.
The Fichtner study states that “total fixed O&M costs for the different
technologies are given in several studies such as (IEA, 2010)”. The IEA,
2010 citation is described in the Fichtner study as “Gas-fired power,
https://iea-etsap.org/E-TechDS/PDF/E02-gas_fired_power-GS-AD-
gct.pdf: s.n.”. We have reviewed the IEA, 2010 document, but could not
find any clear justification for the 3.5% choice.
AFRY MANAGEMENT CONSULTING October 2020
2020/Belgian CRM Peer Review
16PEER REVIEW OF "COST OF CAPACITY FOR CALIBRATION OF BELGIAN CRM" STUDY
We have extracted the equivalent operating costs from the Pöyry 2018
report and calculated these as a percentage of the EPC cost. The results
are shown in the table below and reflect the situation for a 200MWe OCGT
plant construction in Ireland.
Table 6 – Operating Costs for 200MWe OCGT in Ireland
Parameter Cost (€) Remark
EPC cost 93,400,000
Operating costs
assumed 0.8% of the EPC
Trading and admin costs 740,362 contract price
assumed an O&M team
comprising 10 full time
employees and an average
Personnel costs 780,000 cost of €78k per employee
determined by tariffs
1,236,742 published by the Irish
Electricity transmission charges transmission system operator
Assumed zero for OCGT in
Gas capacity charges - Ireland
Total operating costs 2,757,104
Operating cost as percentage of EPC cost 3.0%
Source: Pöyry 2018
The operating costs as a percentage of the EPC cost is 3.0% based on the
Pöyry 2018 report. AFRY notes however that the electricity transmission
charge and gas transmission charges can be a significant component of the
overall cost in the above table and these are country-specific. We
understand that for a 200MW OCGT plant in Belgium, the electricity and
gas transmission charges would be as follows:
⎯ in terms of electricity transmission and connection charges, units pay a
fixed connection charge (on average 1€/kW) and charges for injecting
electricity to the grid, which is estimated at 98,704 €/year for a 200MWe
plant operating for 800 hours per year (160,000 MWh per annum); and
⎯ in terms of the gas transmission charges, we have assumed that short-
term gas capacity products are available, and peaking units treat these as
variable costs.
Replacing the above transmission charges in the table somewhat reduces
the above operating cost as percentage of EPC cost (from 3% to 1.9%),
reflecting the difference between grid charges in Ireland and Belgium.
AFRY MANAGEMENT CONSULTING October 2020
2020/Belgian CRM Peer Review
17PEER REVIEW OF "COST OF CAPACITY FOR CALIBRATION OF BELGIAN CRM" STUDY
In line with the above, we consider the Fichtner estimate to be on the high
side.
Operating Insurance Cost
The insurance cost includes “O&M insurance for general liability, machine
breakdown and interruption of operation of the power plant”.
Section 3.3.2.2 of the Fichtner Study states that “the annual costs for
insurances are set to 0.5 % of the EPC contract price for all technologies
based on Fichtner’s experience and values from (Konstantin 2013) and
(Pöyry 2018).”
Pöyry 2018 assumes the insurance cost at 0.6% of the EPC cost. Brattle
2018 assumes the insurance cost at 0.6% of the total project investment
cost (referred to as the overnight capital cost in Brattle 2018) which
equates to around 0.8% of the EPC cost. Analysis 2020 assumes the
insurance cost at 0.6% of the total project investment cost (referred to as
the capital cost in Analysis 2020) which equates to around 0.8% of the EPC
cost.
Based on the above AFRY considers Fichtner number (0.5%) to be on the
low side and AFRY would recommend increasing this to 0.6% as per Pöyry
2018 (albeit still lower than Brattle 2018 and Anaysis 2020).
Fixed Maintenance Cost
The fixed maintenance cost includes “intra-year maintenance and a
provision for major overhauls that do not necessarily take place on a yearly
basis.
Section 3.3.2.2 of the Fichtner study states that “based on Fichtner’s
expertise and values from literature (Konstantin, 2013), (Pöyry 2018) the
fixed maintenance costs are estimated with 0.5 % of the EPC contract
price”.
Pöyry 2018 assumed the fixed maintenance cost at 0.5% of the EPC
contract price. However, this fixed maintenance cost only covered routine
and preventative maintenance activities including consumables (filters,
fuses, bulbs, gaskets, pump mechanical seals, pump / motor bearings,
lubricating oil changes, etc). It did not cover the cost of planned
maintenance on the gas turbines (i.e. major overhauls that do not
necessarily take place on a yearly basis). Pöyry 2018 assumed that the
cost of this planned maintenance (parts and labour) would be covered
under a separate Long Term Service Agreement (LTSA) to be entered into
between the plant owner and the LTSA contractor (who is also typically the
gas turbine manufacturer).
Pöyry 2018, estimated the total annual LTSA costs for a 200MWe “frame”
type gas turbine, having an operating regime of 150 starts and 500
operating hours per annum, at € 2 million per annum (on top of the 0.5%
of the EPC cost allowance for fixed annual maintenance).
AFRY MANAGEMENT CONSULTING October 2020
2020/Belgian CRM Peer Review
18PEER REVIEW OF "COST OF CAPACITY FOR CALIBRATION OF BELGIAN CRM" STUDY
Brattle 2018 also follow the Pöyry 2018 approach. Brattle 2018 include
“minor maintenance and repairs” at 0.27% of the EPC cost and includes a
separate line item for the “LTSA” cost. With respect to the LTSA cost,
Brattle 2018 provides the following explanation:
“Major maintenance is assumed to be completed through a long-term
service agreement (LTSA) with the original equipment manufacturer that
specifies when to complete the maintenance based on either fired-hours
or starts. Each major maintenance cycle for a combustion turbine
typically includes regular combustion inspections, periodic hot gas path
inspections, and one major overhaul. [Section V(B)(1) of Brattle 2018]
In the report above, we included hours-based major maintenance costs as
variable O&M costs. Since June 2015, long-term major maintenance and
overhaul costs that are specified in Long-Term Service Agreements
(LTSAs) have been excluded from being counted as variable O&M costs in
the PJM cost guidelines for cost offers.103 We understand these guidelines
are being discussed in a current initiative within the Market
Implementation Committee. In case the guidelines remain unchanged, we
provide a second set of O&M costs and CONE estimates below that include
these costs as fixed O&M. [Appendix C of Brattle 2018]
Since major maintenance activities and costs are spaced irregularly over
the long-term, the cost in a given year represents an annual accrual for
future major maintenance. For hours-based major maintenance, the fixed
O&M cost is calculated based on the estimated hours-based costs of major
maintenance times the expected operation of the unit in a given year. For
a CC, we assume it will operate at 75% capacity factor based on the
capacity factors of actual units. For the CT, we assume it will start 240
times per year based on the results of PJM’s Peak-Hour Dispatch simulation
for estimating the E&AS revenue offset. Removing these costs from
variable O&M will increase Net E&AS revenues and offset some (or all) of
the increased CONE value in the calculation of Net CONE.” [Appendix C of
Brattle 2018]
Brattle 2018, estimated the total annual LTSA costs for a 321MWe “frame”
type gas turbine, having an operating regime of 240 starts per annum, at
USD 5.9 million (€ 5 million) per annum [Table 13 of Brattle 2018]. This
LTSA cost was addition to an allowance of 0.27% of the EPC cost for fixed
maintenance (referred to as “maintenance and minor repairs” in Brattle
2018).
The OCGT plants considered in Brattle 2018 and Pöyry 2018 were of the
large industrial frame type. The maintenance schedule for this type of
gas turbine typically involves combustion inspections, hot gas path
inspections and major inspections. The intervals for each type of
inspection are based on independent counts of either unit starts or unit
operating hours. The exact interval varies from manufacturer to
manufacturer however some typical figures are shown in the table below.
AFRY MANAGEMENT CONSULTING October 2020
2020/Belgian CRM Peer Review
19PEER REVIEW OF "COST OF CAPACITY FOR CALIBRATION OF BELGIAN CRM" STUDY
Table 7 – Typical maintenance intervals for frame type gas turbines
Planned maintenance action Hours Starts
Combustion inspection 8,000 450
Hot gas path inspection 24,000 900
Major inspection 48,000 2400
Source: Pöyry 2018
For an OCGT operating as a low merit peaking plant, it is typically the
number of starts that are the determining factor for when scheduled
maintenance is required to be carried out. The LTSA costs can therefore
be presented as a cost per start. This has been done for the LTSA costs
given in Pöyry 2018 and Brattle 2018 in the table below.
Table 8 – LTSA costs according to Pöyry 2018 and Brattle 2018
Reference source Units Pöyry 2018 Brattle 2018
GT type SGT5-2000E GE 7HA.02
Plant output MW 198.6 320
LTSA levelized annual cost MM € / year 2.0 5.0
starts per annum starts / year 150 240
LTSA cost per start €/start 13,333 21,015
There is a difference in cost per start between Pöyry 2018 and Brattle
2018. However, this is explained by the differences in capacity (200MW
versus 320 MW) and technology class (E class versus H class) of the gas
turbines considered.
Pöyry 2018 and Brattle 2018 use different operating regime assumptions.
For an OCGT plant we would recommend using the definition for a “utility
peaking” application in Part 9 of ISO 3977: 1999 (Gas turbines —
Procurement — Part 9: Reliability, availability, maintainability and
safety). This operating regime considers up to 150 starts each year and
up to 800 operating hours. The OCGT operating regime assumption is not
stated in the Fichtner study.
Both Pöyry 2018 and Brattle 2018 consider Frame type gas turbines.
However, the Angleur 4 and Ham units are of the aero-derivative type.
There is a basic difference in the maintenance regimes between aero-
derivative and frame type gas turbines. In particular, aero-derivatives are
designed to start and stop regularly without ‘penalty’ and are usually
maintained on an operating hours only basis.
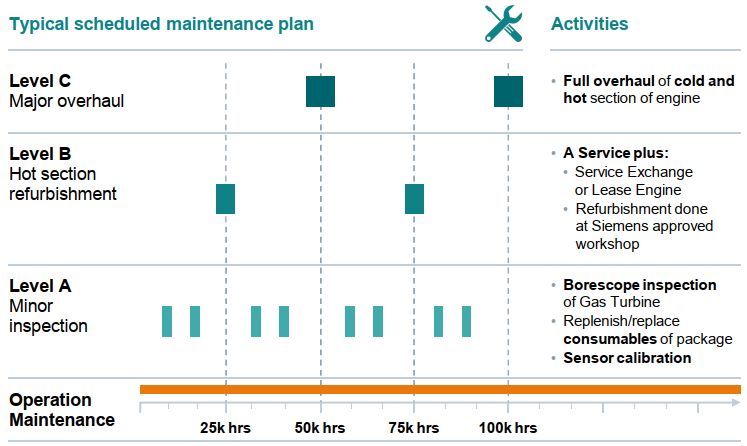
The typical maintenance interval requirements for an aeroderivative gas
turbine are presented in the Figure below.
AFRY MANAGEMENT CONSULTING October 2020
2020/Belgian CRM Peer Review
20PEER REVIEW OF "COST OF CAPACITY FOR CALIBRATION OF BELGIAN CRM" STUDY
Figure 1 – Typical maintenance intervals for aeroderivative
Source: Siemens 8]
The Analysis 2020 report provides major maintenance (i.e. LTSA) cost
data for both aeroderivative type and frame type gas turbines. These
costs are summarised in the table below and have been converted from
2020 to 2019 price levels (assuming inflation rate of 2%) and from $ to
€. The Analysis 2020 report clarifies that “major maintenance costs for
the Siemens SGT-A65 unit are estimated on dollar per gas turbine hourly
operation ($/GT-hr) basis and are not affected by number of starts. Note
that the $/GT-hr and $/start costs are not meant to be additive. The
operational profile determines whether the annual maintenance costs will
be based on hours or starts.”
Table 9 – Major maintenance costs according to Analysis 2020
60 Hz Siemens
Gas turbine model - SGT-A65 GE 7F.05 GE 7HA.02
Gas turbine type - Aero Frame Frame
Gas turbine rating MW 53 207 327
Specific Major maintenance
cost €/GT-hour 160.2 295.1 505.9
Specific Major maintenance
cost €/start 8,010 22,427
8
https://assets.new.siemens.com/siemens/assets/public.1527864266.4de437a8864594a098cf00eb86366a7ab1ad17
60.sgt-a45-sgt-750-gas-turbines.pdf
AFRY MANAGEMENT CONSULTING October 2020
2020/Belgian CRM Peer Review
21PEER REVIEW OF "COST OF CAPACITY FOR CALIBRATION OF BELGIAN CRM" STUDY
AFRY notes that the major maintenance cost for GE 7HA.02 from the
table above (22,427 €/h) is in close alignment with the corresponding
figure in Brattle 2018 which considers the same gas turbine model
(21,015 €/start as shown in the table above).
The SGT-A65 (formerly known as the Industrial Trent 60) is the 60 Hz
version of the gas turbines installed at Angleur 4. Scaling up this cost for
the slightly larger 50 Hz version installed at Angleur 4 (assuming power
increase is 6.3 MW as per product information on the Siemens website)
increases the specific maintenance cost from 160.2 €/hour to 173.4
EUR/hour. Based on this specific maintenance cost, and assuming an
operating regime of 800 hours per annum, the LTSA for one of the gas
turbine units at Angleur 4 would be €140,000 per annum.
The analysis for all existing peaking units is based on 800h of operation
per annum. This may be typical industry standard ,but it is on the upper
end of the spectrum. Lower operating hours and fewer starts may then
also mean a lower overall O&M cost.
Recalculation of Specific Fixed O&M cost for Angleur 4 based
on AFRY recommended numbers
The table below presents the results of recalculating the specific fixed
O&M cost for the gas turbine units at the Angleur 4 facility using the
numbers recommended by AFRY.
AFRY MANAGEMENT CONSULTING October 2020
2020/Belgian CRM Peer Review
22PEER REVIEW OF "COST OF CAPACITY FOR CALIBRATION OF BELGIAN CRM" STUDY
Table 10 – Recalculation of specific fixed O&M cost for GT unit at Angleur 4 using
AFRY recommended numbers
Parameter Unit Value Remark
Plant - Angleur 4
Gas turbine model Trent 60
Fuel type gas/oil
Rated output MWe 63
EPC cost
Specific “Equipment supply” cost €/kW 323 From GTW2019
80% of “equipment
Specific uplift for whole plant EPC cost €/kW 258.688
supply” cost
Specific EPC cost €/kW 582
Plant capacity kW 63,000
EPC cost € 36,669,024
Fixed O&M
(a) Annual operating €/a 696,711 1.9% of EPC cost
(b) Annual insurance €/a 183,345 0.6% of EPC cost
(c) Annual fixed maintenance (excl
183,345 0.5% of EPC cost
major maintenance)
Derived from
(d) Specific major maintenance €/hour 173 Analysis 2020
report
Upper end of range
for “utility
(e) run hours /annum - 800
peaker”;Part 9 of
ISO 3977 : 1999
(f) annual major maintenance €/a 138,749 (d) x (e)
(h) Total fixed O&M €/a 1,202,150 (a)+(b)+(c)+(f)
(h) divided by
Specific fixed O&M €/kW/a 19.1
rated output
Specific fixed O&M cost (Fichtner study) 18.49 For comparison
AFRY MANAGEMENT CONSULTING October 2020
2020/Belgian CRM Peer Review
23PEER REVIEW OF "COST OF CAPACITY FOR CALIBRATION OF BELGIAN CRM" STUDY
3.3.3 Review of Fichtner estimates for the 18MW turbojet units
The table below presents the results of recalculating the specific fixed
O&M cost for the 18MW turbojet units in Belgium using the numbers
recommended by us.
AFRY MANAGEMENT CONSULTING October 2020
2020/Belgian CRM Peer Review
24PEER REVIEW OF "COST OF CAPACITY FOR CALIBRATION OF BELGIAN CRM" STUDY
Table 11 – Recalculation of specific fixed O&M cost for turbojet unit at Cierreux using
AFRY recommended numbers
Parameter Units Value Remark
Also Zelzate, Aalter,
Plant - Cierreux Zedelgem, Noordschote and
Zeebrugge
Gas turbine model Turbojet
Fuel type Kerosene
Rated output MWe 18 From GTW2019 for LM 2500
EPC cost
Specific “Equipment supply” cost €/kW 473 From GTW2019 for LM 2500
Specific uplift for whole plant EPC 80% of “equipment supply”
€/kW 378
cost cost
Specific EPC cost €/kW 851
Plant capacity kW 18,000
15,325,20
EPC cost €
0
Fixed O&M
(a)Annual operating costs €/a 291,178 1.9% of EPC cost
(b) Annual operating insurance €/a 91,951 0.6% of EPC cost
(c) Annual fixed maintenance (excl
76,626 0.5% of EPC cost
major maintenance)
Derived from Analysis 2020
(d) specific major maintenance cost €/hour 88.8 report and scaled to smaller
GT size and fuel type
Upper end of range for
(e) run hours per annum - 800 “utility peaker” regime from
Part 9 of ISO 3977 : 1999
(f) annual major maintenance cost €/a 71,078 (d) x (e)
(h) Total fixed O&M cost €/a 530,833 (a)+(b)+(c)+(f)
(h) divided by rated output
Specific fixed O&M cost €/kW/a 29.49
(in kW)
Specific fixed O&M cost from Fichtner
33.8 For comparison
study
AFRY MANAGEMENT CONSULTING October 2020
2020/Belgian CRM Peer Review
25PEER REVIEW OF "COST OF CAPACITY FOR CALIBRATION OF BELGIAN CRM" STUDY
The “turbojet” units in Belgium were installed between 1963 and 1968.
The model is unknown to us and we assume a Rolls Royce Avon turbojet
or similar, which were commonly installed around this time. Given their
age, there is no identical unit in GTW 2019. We have therefore derived an
“equipment supply” cost from the cost curve given in GTW 2019. Based
on this cost curve, an 18MW capacity turbine is estimated to have an
equipment supply price of 550 USD/kW (2019 price level). Converting to
Euro gives a budget price of 473 €/kW, which is the figure used in the
table above.
The specific major maintenance cost (€/GT-hour) used in the table above
is based on the figure determined in connection with the Angleur 4 units
which has been scaled to take account of the difference in unit size. The
cost has then been multiplied by a factor of 1.2 to reflect the fact the
turbojet units burn kerosene rather than natural gas. The factor of 1.2
has been derived by comparing the variable O&M costs in Tables 3-5 and
3-6 of the Parson Brinckerhoff 2008 report.
3.3.4 Review of Fichtner estimates for the 32MW turbojet unit
The table below presents the results of recalculating the specific fixed
O&M cost for the 32MW turbojet units installed at Beerse using the
numbers recommended by us.
AFRY MANAGEMENT CONSULTING October 2020
2020/Belgian CRM Peer Review
26PEER REVIEW OF "COST OF CAPACITY FOR CALIBRATION OF BELGIAN CRM" STUDY
Table 12 – Recalculation of specific fixed O&M cost for turbojet unit at Beerse using
AFRY recommended numbers
Parameter Units Value Remark
Plant - Beerse
Gas turbine model Turbojet
Fuel type Kerosene
Rated output MWe 32 From GTW2019
EPC cost
Specific “Equipment supply” cost €/kW 366 From GTW2019
Specific uplift for whole plant EPC 80% of “equipment
€/kW 292
cost supply” cost
Specific EPC cost €kW 658
Plant capacity kW 32,000
EPC cost € 21,052,800
Fixed O&M
(a)Annual operating costs €/a 400,004 1.9% of EPC cost
(b) Annual operating insurance €/a 126,317 0.6% of EPC cost
(c) Annual fixed maintenance
105,264 0.5% of EPC cost
(excl major maintenance)
Derived from Analysis
(d) specific major maintenance 2020 report and scaled to
€/hour 133.4
cost smaller GT size and fuel
type
Upper end of range for
“utility peaker” regime
(e) run hours per annum - 800
from Part 9 of ISO 3977:
1999
(f) annual major maintenance
€/a 106,757 (d) x (e)
cost
(h) Total fixed O&M cost €/a 738,342 (a)+(b)+(c)+(f)
(h) divided by rated
Specific fixed O&M cost €/kW/a 23.1
output (in kW)
Specific fixed O&M cost from
28.9 For comparison
Fichtner Study
AFRY MANAGEMENT CONSULTING October 2020
2020/Belgian CRM Peer Review
27PEER REVIEW OF "COST OF CAPACITY FOR CALIBRATION OF BELGIAN CRM" STUDY
The “turbojet” units in Belgium were installed between 1963 and 1968.
Given its age, there is no identical unit in GTW 2019. AFRY has therefore
derived an “equipment supply” cost from the cost curve given in GTW
2019. Based on this curve, a 32 MW capacity turbine is estimated to have
an equipment supply price of 425 $/kW (2019 price level). Converting to
€ gives a budget price of 366 €/kW, which is the figure used in the table
above.
The specific major maintenance cost (€/GT-hour) used in the table above
is based on the figure determined in connection with the Angleur 4 units
which has been scaled to take account of the difference in unit size. The
cost has then been multiplied by a factor of 1.2 to reflect the fact the
turboject units burn kerosene rather than natural gas. The factor of 1.2
has been derived by comparing the variable O&M costs in Tables 3-5 and
3-6 of the Parson Brinckerhoff 2008 report.
3.3.5 Review of Fichtner estimates for Angleur 3 units
The table below presents the results of recalculating the specific fixed
O&M cost for the Angleur 3 gas turbine units using the numbers
recommended by us.
AFRY MANAGEMENT CONSULTING October 2020
2020/Belgian CRM Peer Review
28PEER REVIEW OF "COST OF CAPACITY FOR CALIBRATION OF BELGIAN CRM" STUDY
Table 13 – Recalculation of specific fixed O&M cost for Angleur 3 gas turbines using
AFRY recommended numbers
Parameter Units Value Remark
Plant - Angleur 3
Gas turbine model Frame Type Model is not known
Fuel type Gas
Rated output MWe 25
EPC cost
Specific “Equipment supply” cost €/kW 413 From GTW2019
Specific uplift for whole plant EPC 80% of “equipment
€/kW 330
cost supply” cost
Specific EPC cost €/kW 743
Plant capacity kW 25,000
EPC cost € 18,576,000
Fixed O&M
(a)Annual operating costs €/a 352,944 1.9% of EPC cost
(b) Annual operating insurance €/a 111,456 0.6% of EPC cost
(c) Annual fixed maintenance
92,880 0.5% of EPC cost
(excl major maintenance)
Derived from Pöyry 2018
(d) specific major maintenance
€/start 3,065.2 report and scaled to
cost
smaller GT size
Upper end of range for
“utility peaker” regime
(e) starts per annum starts/annum 150
from Part 9 of ISO 3977 :
1999
(f) annual major maintenance
€/a 459,775 (d) x (e)
cost
(h) Total fixed O&M cost €/a 1,017,055 (a)+(b)+(c)+(f)
(h) divided by rated
Specific fixed O&M cost €/kW/a 40.7
output (in kW)
Specific fixed O&M cost from
25.4 For comparison
Fichtner Study
The Angleur 3 gas turbines first entered operation in 1978 as part of a
combined cycle power plant. The units were converted to open cycle in
AFRY MANAGEMENT CONSULTING October 2020
2020/Belgian CRM Peer Review
29PEER REVIEW OF "COST OF CAPACITY FOR CALIBRATION OF BELGIAN CRM" STUDY
2013. The model is unknown but we have assumed an industrial frame
type, such as the Brown Boveri GT13 series or similar, which had a
capacity of around 35MW at that time.
Given their age, there is no identical unit in GTW 2019. We have
therefore derived an “equipment supply” cost from the cost curve given
in GTW 2019. Based on this cost curve, a 25MW capacity turbine is
estimated to have an equipment supply price of 480 $/kW (2019 price
level). Converting to Euro gives a budget price of 413 €/kW, which is the
figure used in the table above.
The specific major maintenance cost (€/GT-hour) used in the table above
is based on the figure shown for a SGT5-2000E frame type gas turbine,
which has been scaled to take account of the difference in unit size.
The calculated specific fixed O&M cost (40.7 €/kW/a) is higher than the
result contained in Table 15 of the Fichtner study (25.4 €/kW/a).
3.3.6 Conclusions
The table below presents the results of recalculating the specific fixed
O&M cost for each of the OCGT units in Belgium. The Fichtner number is
shown for comparison purposes.
Electricity transmission charges are incurred in line with amount of
electricity injected to the grid. They can therefore be viewed as variable
cost element, and we therefore also present the specific O&M cost
excluding the electricity transmission charges.
AFRY MANAGEMENT CONSULTING October 2020
2020/Belgian CRM Peer Review
30PEER REVIEW OF "COST OF CAPACITY FOR CALIBRATION OF BELGIAN CRM" STUDY
Table 14 – Results of recalculating specific fixed O&M cost for all OCGT units
Specific fixed
O&M cost
Commercial (€/kW/a)
Capacity
Unit Type operation AFRY
(MW)
date (excl.
Fichtner AFRY
grid
charge)
Angleur 3 - TG31 25 Frame type 1978 25.40 40.68 40.19
Angleur 3 - TG32 25 Frame type 1978 25.40 40.68 40.19
Angleur 4 - TG41 63 Aero 2012 18.49 19.08 18.59
Angleur 4 - TG42 63 Aero 2012 18.49 19.08 18.59
Ham - HAM31 56 Aero 2006 19.38 19.08 18.59
Ham - HAM32 56 Aero 2006 19.38 19.08 18.59
Cierreux 18 Turbojet 1960's 33.83 29.49 29.00
Beerse 32 Turbojet 1960's 28.94 23.07 22.58
Zelzate 18 Turbojet 1960's 33.83 29.49 29.00
Aalter 18 Turbojet 1960's 33.83 29.49 29.00
Zedelgem 18 Turbojet 1960's 33.83 29.49 29.00
Noordschote 18 Turbojet 1960's 33.83 29.49 29.00
Zeebrugge 18 Turbojet 1960's 33.83 29.49 29.00
The EPC costs used in the calculation of fixed O&M costs have been
derived from the price curves contained in GTW 2019. Based on our
experience, costs provided by GTW 2019 are found to be on the
conservative side when compared to prices subsequently obtained via a
competitive bidding process. A 10 to 15% reduction would not be
unusual. This is also supported even by GTW 2019, which attaches a plus
or minus accuracy of 15% to the estimated budget prices.
3.4 Review of section 4.3 of the Fichtner study – CCGTs
3.4.1 Fichtner study estimate
In accordance with the agreed methodology for this peer review, the first
step has been to extract the numbers from Section 4.3.1 of the Fichtner
study. The numbers with have a bearing on the fixed O&M costs are
presented in the table below.
AFRY MANAGEMENT CONSULTING October 2020
2020/Belgian CRM Peer Review
31PEER REVIEW OF "COST OF CAPACITY FOR CALIBRATION OF BELGIAN CRM" STUDY
Table 15 – Fichtner estimates for existing CCGTs
Annual Specific
Fixed Annual
Capacity GT Year of
Unit name Config O&M Fixed O&M
(MW) model construction
costs costs
(€/a) (€/kW/a)
SGT5-
T-Power 425 1x1 2011 17,600,000 41.41
4000F
SGT5-
Seraing 485 2x1 1994 19,500,000 40.21
2000E
Amercoeur 451 1x1 GE 9FB 2010 18,300,000 40.58
SGT5-
Marcinelle 405 1x1 2011 16,900,000 41.73
4000F
Saint-Ghislain 350 1x1 GE 9FA 2000 15,100,000 43.14
SGT5-
Drogenbos 460 2x1 1993 18,700,000 40.65
2000E
Knippergroen 315 1x1 2010 13,900,000 44.13
Ringvaart 357 1x1 GE 9FA 1998 15,400,000 43.14
SGT5-
Herdersbrug 480 2x1 1998 19,300,000 40.21
2000E
SGT5-
Zandvliet 384 1x1 2005 16,200,000 42.19
4000F
Inesco 138 2x1 SGT-800 2007 7,450,000 53.99
Source: Table 16 of Fichtner study
AFRY has the following observations on the above table:
⎯ all the CCGT plants are based around large frame type industrial gas
turbines;
⎯ all the plants used F class gas turbine technology (Siemens SGT5-4000F
and GE 9F) with the exception of Seraing, Drogenbos, Herdesbrug which
are based on E class technology (GE 9E and Siemens SGT5-2000E) and
Inesco which is based on Siemens SGT-800 gas turbines;
⎯ the capacities quoted in the table above are understood to be at ISO
conditions (15oC and 60% relative humidity);
⎯ Zandvliet and Inesco are categorised in CCGT-CHP to reflect their ability
to operate in CHP mode. The MW capacities in the above table relate to
CCGT operation.
AFRY MANAGEMENT CONSULTING October 2020
2020/Belgian CRM Peer Review
32PEER REVIEW OF "COST OF CAPACITY FOR CALIBRATION OF BELGIAN CRM" STUDY
⎯ the Inesco (INEOS Essent Cogeneration) plant is powered by two natural-
gas-fired 43MW SGT-800 gas turbines.9
3.4.2 Review of Fichtner estimates for T-Power plant
Section 4.3.2 of the Fichtner study states “The numbers provided in Table
16 are estimated by Fichtner (Fichtner 2020) based on the data provided
for the individual units, the methodology presented (i.a. in Section 4.2)
and Fichtner’s experience as a technical consultant).” Fichtner 2020 is
described within the Fichtner study as “Internal data, calculations and
interviews with experts. Stuttgart”. This reference data has not been
provided to AFRY for review.
In the absence of any information to the contrary, AFRY considers it
reasonable to assume that Fichtner estimated the fixed O&M costs for the
existing plants in Belgium in the same way that they estimated the fixed
O&M costs for the gross CONE calculation.
The Table below contains an estimate of fixed O&M costs for the T-Power
plant using the methodology used by Fichtner for the gross CONE
calculation (as set out in Section 3.3.3 of the Fichtner study).
9
https://www.powerengineeringint.com/coal-fired/equipment-coal-fired/flexible-cogeneration-for-
chemicals-plant/
AFRY MANAGEMENT CONSULTING October 2020
2020/Belgian CRM Peer Review
33PEER REVIEW OF "COST OF CAPACITY FOR CALIBRATION OF BELGIAN CRM" STUDY
Table 16 – Fichtner’s Gross CONE calculation methodology applied to the T-power
plant
Parameter Units Value Remark
Plant - T-Power
Gas turbine model SGT5-4000F
Fuel type Gas only
Rated output MWe 425
EPC cost
From GTW2019 (price
Specific EPC cost €/kW 637 curve)
Plant capacity kW 425,000
EPC cost € 270,764,480
Fixed O&M
Operating costs € 14,215,135 5.25%
Insurance € 1,353,822 0.50%
Maintenance € 2,030,734 0.75%
Total € 17,599,691
Specific fixed O&M cost €/kW/a 41.41
Fichtner specific fixed O&M cost €/kW/a 41.41 For comparison
The calculated specific fixed O&M cost (41.41 €/kW/a) is in exact
alignment to the result contained in Table 16 of the Fichtner study (41.41
€/kW/a).
The reasonableness of each of the Fichtner “numbers” used in the above
calculation (high-lighted in red text in the above table) are discussed in
the sections below.
EPC cost
As for the OCGT plant, GTW 2019 is once again used as the basis for
deriving the EPC cost for the CCGT plant. Fichtner note that the approach
is different however, as the prices quotes in GTW2019 are already for the
full EPC “turnkey” scope (including major equipment supply, plant
engineering and construction), rather than just being for “equipment
supply” as is the case for the OCGT plants.
The specific EPC cost in the table above is derived from the 2019
combined cycle cost curve given in GTW 2019. Based on this cost curve,
AFRY MANAGEMENT CONSULTING October 2020
2020/Belgian CRM Peer Review
34You can also read