PLANNING TOWARDS 2028 - DEVELOPMENT PLAN COMPREHENSIVE - Buena Vista County
←
→
Page content transcription
If your browser does not render page correctly, please read the page content below
COMPREHENSIVE
  DEVELOPMENT PLAN
PLANNING TOWARDS 2028

        Prepared For

    TRUESDALE, IOWA
  BUENA VISTA COUNTY

        Prepared By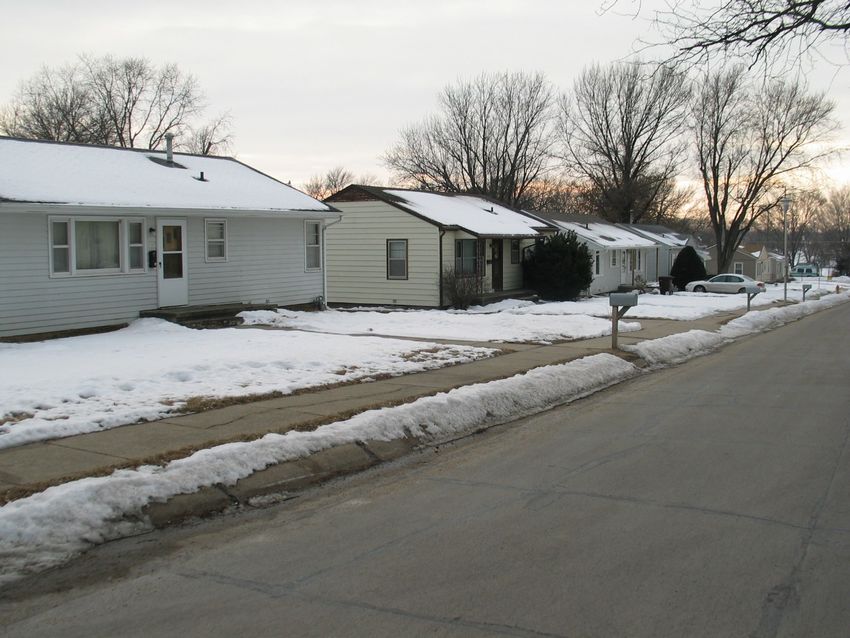
TRUESDALE, IOWA

Comprehensive Development Plan 2008 Project Participants

City Council
STANLEY BUCHHOLZ, MAYOR
LINDA WEILAND ANDERSON
TINA BARRICKMAN-SHANNON
BARRY MEYER
CHRISTOPHER BARRICKMAN
JIM WEILAND

CITY PERSONNEL
MELISSA NIELSEN                CLERK
JOHN MURRAY                    CITY ATTORNEY
MARK NIELSEN                   FIRE CHIEF

BUENA VISTA COUNTY PERSONNEL
KIM JOHNSON                    ENVIRONMENTAL HEALTH AND ZONING DIRECTOR

                               PLANNING CONSULTANT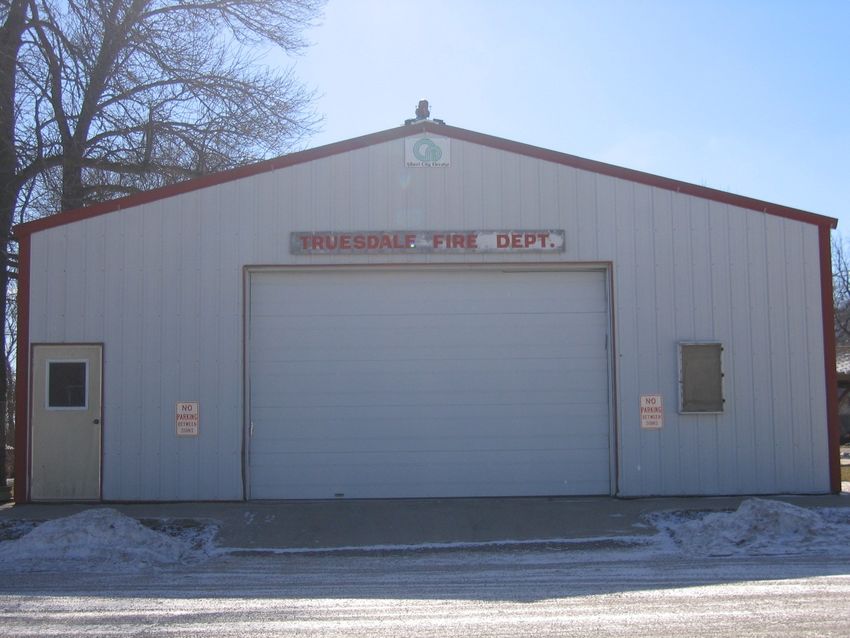
TABLE OF CONTENTS

INTRODUCTION.........................................................................................................................................................4

   INTRODUCTION................................................................................................................................................................5
       Location .................................................................................................................................................................5
   THE PURPOSE OF COMPREHENSIVE PLANNING......................................................................................................................5
   THE COMPREHENSIVE PLANNING PROCESS .........................................................................................................................5
   COMPREHENSIVE DEVELOPMENT PLAN COMPONENTS............................................................................................................6
   GOVERNMENTAL AND JURISDICTIONAL ORGANIZATION..........................................................................................................7

PROFILE TRUESDALE.............................................................................................................................................9

   DEMOGRAPHIC PROFILE..................................................................................................................................................10
       Population Trends and Analysis...........................................................................................................................10
       Age Structure Analysis..........................................................................................................................................11
       Population Projections.........................................................................................................................................13
   HOUSING PROFILE.........................................................................................................................................................16
       Age of Existing Housing Stock..............................................................................................................................16
   ECONOMIC AND EMPLOYMENT PROFILE............................................................................................................................21
       Income Statistics...................................................................................................................................................21
       Regional Basic/Non-Basic Analysis.....................................................................................................................24
   COMMUNITY FACILITIES.................................................................................................................................................28
       Truesdale Facilities Inventory..............................................................................................................................28
   RECREATIONAL FACILITIES ..............................................................................................................................................28
       State Recreational Facilities.................................................................................................................................28
       County Recreational Facilities.............................................................................................................................29
       Community Recreational Facilities......................................................................................................................30
       Other Recreational Activities...............................................................................................................................30
   FIRE AND POLICE PROTECTION........................................................................................................................................33
   LAW ENFORCEMENT.......................................................................................................................................................36
   COMMUNICATION FACILITIES...........................................................................................................................................36
       Radio.....................................................................................................................................................................36
       Television..............................................................................................................................................................37
       Newspapers...........................................................................................................................................................37
   PUBLIC UTILITIES..........................................................................................................................................................37
       Electrical Service..................................................................................................................................................37
       Telephone Services...............................................................................................................................................37
       Cable Television Providers...................................................................................................................................37
       Municipal Water Systems.....................................................................................................................................37
Sanitary Sewer......................................................................................................................................................38
      Solid Waste Disposal Facilities............................................................................................................................38
   HEALTH FACILITIES.......................................................................................................................................................38
      Hospital.................................................................................................................................................................38
      Medical Clinics.....................................................................................................................................................39
      Nursing Home Facilities.......................................................................................................................................39
   EXISTING LAND USE .....................................................................................................................................................40
   TRANSPORTATION SYSTEM AND FACILITIES........................................................................................................................45

ENVISION TRUESDALE.........................................................................................................................................47

   ENVISION THE FUTURE...................................................................................................................................................48
   TRUESDALE’S TOWN HALL MEETING...............................................................................................................................48
   TRUESDALE TOWN HALL MEETING RESULTS....................................................................................................................49
    TRUESDALE’S VISION....................................................................................................................................................50
   VISION STATEMENT.......................................................................................................................................................50
   TRUESDALE’S GOALS.....................................................................................................................................................50
      Economic Development........................................................................................................................................51
      Land Use ..............................................................................................................................................................51
      Housing.................................................................................................................................................................52
      Public Health and Safety......................................................................................................................................52
      Transportation......................................................................................................................................................53

ACHIEVE TRUESDALE...........................................................................................................................................55

   FUTURE LAND USE PLAN...............................................................................................................................................56
      Future Land Use Classification............................................................................................................................57
      Agricultural Land Uses.........................................................................................................................................57
      Residential Land Uses..........................................................................................................................................58
      Commercial (C)....................................................................................................................................................60
      Industrial (I)..........................................................................................................................................................60
      Public/Quasi-Public (P) ......................................................................................................................................60
      Parks/Recreation (P/R).........................................................................................................................................61
   FUTURE LAND USE PLAN MAP.......................................................................................................................................63
      Land Use Suitability Criteria................................................................................................................................63
      Land Use Transitions............................................................................................................................................63
      Community Growth...............................................................................................................................................63
      Community Entrances...........................................................................................................................................64
      Future development challenges/barriers..............................................................................................................64
      Annexation ...........................................................................................................................................................64
   TRANSPORTATION FACILITIES AND SYSTEM FUTURE............................................................................................................65
      Street and Road Classification System.................................................................................................................65

PLAN IMPLEMENTATION.....................................................................................................................................69
PLAN IMPLEMENTATION..................................................................................................................................................70
   Achieving Truesdale’s Future Plan......................................................................................................................70
   Action Agenda.......................................................................................................................................................70
   Support Programs for the Action Agenda............................................................................................................70
PLAN MAINTENANCE.....................................................................................................................................................71
   Annual Review of the Plan....................................................................................................................................71
   Unanticipated Opportunity ..................................................................................................................................71
   Methods for Evaluating Development Proposals.................................................................................................71
   Immediate Recommendations...............................................................................................................................72
   Short Term Recommendations..............................................................................................................................72
   Long Term Recommendations..............................................................................................................................72
   Continuing Recommendations..............................................................................................................................72
   Public Education..................................................................................................................................................72
TABLE OF CONTENTS

                                                             TABLE OF FIGURES

FIGURE 1: POPULATION TRENDS AND PROJECTIONS, CITY OF TRUESDALE, 1940 TO 2030.........15

FIGURE 2: AGE OF EXISTING HOUSING STOCK, CITY OF TRUESDALE, 2000.....................................16

FIGURE 3: SCHOOL DISTRICT MAP.................................................................................................................31

FIGURE 4: RESCUE DISTRICT MAP...................................................................................................................34

FIGURE 5: FIRE DISTRICT MAP..........................................................................................................................35

FIGURE 6: EXISTING LAND USE MAP, TRUESDALE.....................................................................................44

FIGURE 7: FUTURE LAND USE MAP..................................................................................................................62

FIGURE 8: TRANSPORTATION PLAN MAP......................................................................................................68
TABLE OF CONTENTS
TABLE OF TABLES
TABLE 1: POPULATION TRENDS, BUENA VISTA COUNTY & COMMUNITIES, 1980 TO 2004...........10
TABLE 2: AGE-SEX CHARACTERISTICS, CITY OF TRUESDALE, 1990 TO 2000....................................11
TABLE 3: POPULATION PROJECTION SERIES, BUENA VISTA COUNTY AND COMMUNITIES, 2000
TO 2030........................................................................................................................................................................15
TABLE 4: COMMUNITY HOUSING TRENDS, CITY OF TRUESDALE, 1990 AND 2000............................17
TABLE 5: HOUSING UNITS BY COMMUNITY, BUENA VISTA COUNTY AND COMMUNITIES - 2000
.......................................................................................................................................................................................18
TABLE 6: TENURE OF HOUSEHOLD BY SELECTED CHARACTERISTICS, CITY OF TRUESDALE,
1990 TO 2000...............................................................................................................................................................19
TABLE 7: SELECTED HOUSING CONDITIONS, TRUESDALE AND BUENA VISTA COUNTY, 1990
AND 2000.....................................................................................................................................................................20
TABLE 8: HOUSEHOLD INCOME, TRUESDALE AND STATE OF IOWA, 1990 AND 2000......................21
TABLE 9: HOUSEHOLD INCOME BY AGE OF HOUSEHOLDER (55 YEARS & OLDER), CITY OF
TRUESDALE, 2000....................................................................................................................................................22
TABLE 10: HOUSING COSTS AS A PERCENTAGE OF HOUSEHOLD INCOME, CITY OF
TRUESDALE, 2000....................................................................................................................................................23
TABLE 11: AGE 65 AND OLDER COSTS AS PERCENTAGE OF INCOME, CITY OF TRUESDALE, 2000
.......................................................................................................................................................................................24
TABLE 12: BASIC/NON-BASIC EMPLOYMENT BY OCCUPATION, CITY OF TRUESDALE, 2000.......25
TABLE 13: BASIC/NON-BASIC EMPLOYMENT BY INDUSTRY, CITY OF TRUESDALE, 2000.............26
TABLE 14: TRAVEL TIME TO WORK, TRUESDALE, 1990 TO 2000............................................................27
TABLE 15: STATE PARKS......................................................................................................................................29
TABLE 16: COUNTY PARKS AND FACILITIES................................................................................................29
TABLE 17: AREA GOLF COURSES......................................................................................................................30
TABLE 18: BUENA VISTA COUNTY PUBLIC SCHOOLS BY SCHOOL DISTRICT...................................32
TABLE 19: PRIVATE SCHOOLS...........................................................................................................................33
TABLE 20 FIRE AND RESCUE EQUIPMENT.....................................................................................................33
TABLE 21: SWORN OFFICERS, BUENA VISTA AND SURROUNDING COUNTIES, 2000 – 2004...........36
TABLE 22: EXISTING LAND USE, TRUESDALE, 2006.....................................................................................41
TABLE 23: ACRES PER 100 PERSONS COMPARISON, BUENA VISTA COUNTY COMMUNITIES.....42
TABLE 24: LAND USE COMPARISONS (IN ACRES), 2006..............................................................................43
TABLE 25: WHAT DO YOU LIKE ABOUT TRUESDALE, 2006......................................................................49TABLE OF CONTENTS TABLE 26: WHAT NEEDS TO BE IMPROVED IN TRUESDALE, 2006..........................................................49 TABLE 27: WHAT IS YOUR VISION OF TRUESDALE, 2006.........................................................................49 TABLE 28: WHAT NEEDS TO BE DONE TO ACHIEVE THIS VISION IN TRUESDALE, 2006................49
INTRODUCTION

INTRODUCTION
INTRODUCTION

INTRODUCTION

LOCATION
Truesdale, the smallest community in Buena Vista County, had a 2000 census population of 91. The City is north of the
City of Storm Lake. Truesdale is located on U.S. Highway 71.

THE PURPOSE OF COMPREHENSIVE PLANNING

The Truesdale Comprehensive Development Plan is
designed to promote orderly growth and development for
the city. The Comprehensive Development Plan will
provide policy guidelines to enable citizens and elected
officials to make informed decisions about the future of
the city.

  The Plan acts as a tool to “Develop a road map that
            guides the community through change”

The Comprehensive Development Plan will provide a guideline for the location of future developments within the
planning jurisdiction of Truesdale. The Comprehensive Development Plan is intended to encourage a strong economic
base for the city so the goals of the city are achieved.

The Plan will assist Truesdale in evaluating the impacts of development (i.e. economic, social, fiscal, service and
amenity provision, health, safety and general welfare) and encourage appropriate land uses throughout the jurisdictional
area of the Truesdale. The objective of planning is to provide a framework for guiding the community—whether a city
or county, toward orderly growth and development. The Plan assists Truesdale in balancing the physical, social,
economic, and aesthetic features as it responds to private sector interests.

Planned growth will make Truesdale more effective in serving residents,
more efficient in using resources, and able to meet the standard of living
and quality of life every individual desires.

THE COMPREHENSIVE PLANNING PROCESS

Comprehensive planning begins with the data collection phase. Data is
collected that provides a snapshot of the past and present city conditions.
                                                                                The Comprehensive Development
Analysis of data provides the basis for developing forecasts for future land-   Plan is interconnected to the
use demands in the city.                                                        community’s future; just like the
                                                                                pieces of a jigsaw puzzle
INTRODUCTION
The second phase of the planning process is the development of general goals and policies, based upon the issues facing
the city. These are practical guidelines for improving existing conditions and guiding future growth. The Comprehensive
Development Plan is a vision presented in text, graphics and tables that represent the desires of Truesdale for the future.
The Comprehensive Development Plan represents a blueprint designed to identify, assess, and develop actions and
policies in the areas of population, land use, transportation, housing, economic development, community facilities, and
utilities. The Comprehensive Development Plan contains recommendations that when implemented will be of value to
the residents of Truesdale.
Implementation is the final phase of the process. A broad range of development policies and programs are required to
implement the Comprehensive Development Plan. The Comprehensive Development Plan identifies the tools, programs,
and methods necessary to carry out the recommendations. Nevertheless, the implementation of the development policies
contained within the Comprehensive Development Plan is dependent upon the adoption of the Plan by the governing
body, and the leadership exercised by the present and future elected and appointed officials of the city.
The Plan was prepared under the direction of the Buena Vista County Planning Commission, with the assistance and
participation of the Truesdale City Council, the Plan Review Committee and citizens of Truesdale. The time period for
achieving goals, programs, and developments identified in the Truesdale Comprehensive Development Plan is
approximately 20 years. However, Truesdale should review the Plan annually and complete an update of the document
every five to ten years. Updating the Comprehensive Development Plan will allow Truesdale to incorporate ideas and
developments that were unknown at the time of the present process.
COMPREHENSIVE DEVELOPMENT PLAN COMPONENTS
Iowa Code permits cities to regulate land use by ordinance. All citations to the Iowa Code in this Plan are from the Iowa
General Assembly website. Pursuant to Iowa Code, the Truesdale City Council has the authority to:
“For the purpose of promoting the health, safety, morals, or the general welfare of the community or
for the purpose of preserving historically significant areas of the community, any city is hereby
empowered to regulate and restrict the height, number of stories, and size of buildings and other
structures, the percentage of lot that may be occupied, the size of yards, courts, and other open spaces,
the density of population, and the location and use of buildings, structures, and land for trade, industry,
residence, or other purposes.” (Iowa Code Ann § 414.1) However, the Council is limited in their
authority; their “powers exercised only with reference to land and structures located within the city
limits.” (Iowa Code Ann § 414.23)
Pursuant to Iowa Code:
“The regulations shall be made in accordance with a comprehensive plan and designed to preserve the
availability of agricultural land; to consider the protection of soil from wind and water erosion; to
encourage efficient urban development patterns; to lessen congestion in the street; to secure safety
from fire, flood, panic, and other dangers; to promote health and the general welfare; to provide
adequate light and air; to prevent the overcrowding of land; to avoid undue concentration ofINTRODUCTION
population; to promote the conservation of energy resources; to promote reasonable access to solar
energy; and to facilitate the adequate provision of transportation, water, sewerage, schools, parks, and
other public requirements.” (Iowa Code Ann § 414.3).
The Iowa Code defines factor regulations as follows:
“Such regulations shall be made with reasonable consideration, among other things, as to the character
of the area of the district and the peculiar suitability of such area for particular uses, and with a view to
conserving the value of buildings and encouraging the most appropriate use of land throughout such
city.” (Iowa Code Ann § 414.3).
The Truesdale Comprehensive Plan is comprised of the following chapters and sections:
• Profile Truesdale
o Demographic Analysis – Conditions and Trend Analysis
o City Facilities
o Existing Land Use
• Envision Truesdale
o Town Hall Meeting Results
o Goals and Objectives
• Achieve Truesdale
o Future Land Use Plan
o Transportation Plan
• Truesdale Plan Implementation
Analyzing past and existing demographic, housing, economic, and social trends permits the projection of likely
conditions in the future. Projections and forecasts are useful tools for planning the community’s future; however, these
tools are sometimes lacking in accuracy and may change due to unforeseen factors. In addition, past trends may be
skewed or the data may be inaccurate, creating a distorted picture of past conditions. It is important for Truesdale to
closely monitor population, housing, and economic conditions that may influence the city. Through periodic monitoring,
the City can adapt and adjust to changes at the local level. Having the ability to adapt to socio-economic change allows
the City to maintain an effective Comprehensive Development Plan for the future, to enhance the quality of life, and to
raise the standard of living for all residents.
The Comprehensive Development Plan records where Truesdale has been, where it is now, and where it likely will be in
the future. Having this record in the Comprehensive Development Plan will serve to inform City officials as much as
possible. The Comprehensive Development Plan is an information and management tool for City leaders to use in their
decision-making process when considering future developments. The Comprehensive Development Plan is not a static
document; it should evolve as changes in the land-use, population or local economy occur during the planning period.
This information is the basis for Truesdale’s evolution as it achieves its physical, social, and economic goals.
GOVERNMENTAL AND JURISDICTIONAL ORGANIZATIONINTRODUCTION The Truesdale city government consists of a five member City Council and the mayor who perform the governmental functions for the City. The planning and zoning jurisdiction of Truesdale, pursuant to Iowa Code Ann. § 335.3, includes all land and uses within the corporate limits of the city. There is one limitation, however, on the power to regulate land use, which is the regulation of agriculture or agricultural structures as long as they are being used for agricultural purposes. (Iowa Code Ann. § 335.2) Iowa Code also dictates how county and city zoning efforts interact in areas where they overlap. When cities enact zoning, they are empowered to extend their authority over any unincorporated areas within two miles of the city’s limits, unless the County has already zoned the area. (Iowa Code Ann § 414.23). However, “Whenever a county in which this power is being exercised by a municipality adopts a county zoning ordinance the power exercised by the municipality and the specific regulations and districts thereunder shall be terminated within three months of the establishment of the administrative authority for county zoning, or at such date as mutually agreed upon by the municipality and county.” (Iowa Code Ann. § 414.23) Also, pursuant to Iowa Code Ann. § 335.24, if more than one statute, ordinance, or regulation conflict, the one that imposes the highest standards governs. However, there is one caveat to this general rule. Where a city has zoning regulations pertaining to subdivisions, those regulations can be authorized over the area within two miles of the city, even when the county has general jurisdiction over the area pursuant to Iowa Code Ann. § 414.23. Under authority of Iowa Code Ann. § 354.9, the city may pass an ordinance clearly establishing the area over which it will exercise subdivision review. In which case, the city must use the same standards it uses within its limits, and the city and county many enter into a 28E intergovernmental agreement on standards and conditions for review. In essence, according to the Code of Iowa, counties and cities have the power to regulate land use through zoning ordinances. When a county adopts a zoning ordinance, agricultural land is generally exempt, and the ordinance extends to the corporate limits of cities. In the case of a city that has zoning at a time when the county does not, that city has zoning authority over the unincorporated area within two miles of its corporate limits. However, when a county enacts zoning, the county authority extends over that two mile area, and the city authority is them limited to land within its corporate limits. The only exception to this rule is the city may still exercise subdivision review powers within the two- mile area if they do so pursuant to a specific city ordinance clearly defining the two-mile limit.
PROFILE TRUESDALE
PROFILE TRUESDALE
TRUESDALE, IOWA COMPREHENSIVE DEVELOPMENT PLAN 2008 9PROFILE TRUESDALE
DEMOGRAPHIC PROFILE
Population statistics aid decision-makers by developing a broad picture of the City of Truesdale. It is important for the
community to understand where it has been, where it is, and where it appears to be going. Population is the driving force
behind housing, local employment, economic, and fiscal stability of the City. Historic population conditions assist in
developing demographic projections, which in turn assist in determining future housing, retail, medical, employment,
and educational needs within the City. Projections provide an estimate for the City to base future land-use and
development decisions. However, population projections are only estimates and unforeseen factors may effect
projections significantly.
POPULATION TRENDS AND ANALYSIS
Table 1 shows the population for Truesdale and other incorporated and unincorporated areas in Buena Vista County,
between 1980 and 2004. This information provides an understanding of the past and present population trends and
changes. Truesdale’s population in 2000 was 91 persons, which was a decrease of 41 persons, or -31.1%, from 1990.
The City’s population in 2004 was estimated to be 88, a decrease of 3 persons, or -3.3%, over 2000. The table indicates
Truesdale had a net decrease of 40 persons, or -31.3%, between 1980 and 2004.
TABLE 1: POPULATION TRENDS, BUENA VISTA COUNTY & COMMUNITIES, 1980 TO 2004
% Change % Change % Change % Change
Community 1980 1990 1980 to 2000 1990 to 2004 2000 to 1980 to
1990 2000 2004 2004
Albert City 818 779 -4.8% 709 -9.0% 691 -2.5% -15.5%
Alta 1,720 1,820 5.8% 1,865 2.5% 1,852 -0.7% 7.7%
Lakeside 589 522 -11.4% 484 -7.3% 496 2.5% -15.8%
Linn Grove 205 194 -5.4% 211 8.8% 213 0.9% 3.9%
Marathon 442 320 -27.6% 302 -5.6% 297 -1.7% -32.8%
Newell 913 1,089 19.3% 887 -18.5% 870 -1.9% -4.7%
Rembrandt 291 229 -21.3% 228 -0.4% 222 -2.6% -23.7%
SiouxRapids 897 761 -15.2% 720 -5.4% 703 -2.4% -21.6%
StormLake 8,814 8,769 -0.5% 10,076 14.9% 9,981 -0.9% 13.2%
Trues dale 128 132 3.1% 91 - 31.1% 88 - 3.3% - 31.3%
Incorporated Areas 14,817 14,615 -1.4% 15,573 6.6% 15,413 -1.0% 4.0%
Unincorporated Areas 5,957 5,350 -10.2% 4,838 -9.6% 4,743 -2.0% -20.4%
Buena Vis ta County 20,774 19,965 - 3.9% 20,411 2.2% 20,156 - 1.2% - 3.0%
Source: U.S. Census Bureau, Census of Population and Housing, 1980 - 1990, 2000, 2004
As shown in Table 1, Truesdale exhibited a small gain in population between 1980 and 1990, when it recorded an
increase of 4 persons, or 3.1%. During this period, both the incorporated (as a whole) and unincorporated areas of Buena
Vista County experienced a decrease in population of 607 and 202 persons, respectively. Through the 1980’s this is
counter to what happened in many small towns during the economic decline associated with changing farm conditions.
TRUESDALE, IOWA COMPREHENSIVE DEVELOPMENT PLAN 2008 10PROFILE TRUESDALE
AGE STRUCTURE ANALYSIS
Age structure is an important component of population analysis. By analyzing age structure, one can determine which
age groups (cohorts) within the City of Truesdale are being affected by population shifts and changes. Each age cohort
affects the population in a number of different ways. For example, the existence of larger young cohorts (20-44 years)
means that there is a greater ability to sustain future population growth than larger older cohorts. On the other hand, if
the large, young cohorts maintain their relative size, but do not increase the population as expected, they will, as a group,
tend to strain the resources of an area as they age. Understanding what is happening within the age groups of the City’s
population is necessary to effectively plan for the future.
TABLE 2: AGE-SEX CHARACTERISTICS, CITY OF TRUESDALE, 1990 TO 2000
1990 2000 1990- 2000 1990- 2000
Age M ale and M ale and Net Co ho rt
% o f To tal % o f To tal % C hange % Change
Female Female Change Change
0-4 10 7.6% 3 3.3% -7 -70.0% 3 -
5-9 13 9.8% 5 5.5% -8 -61.5% 5 -
10-14 16 12.1% 3 3.3% -13 -81.3% -7 -70.0%
15-19 8 6.1% 7 7.7% -1 -12.5% -6 -46.2%
20-24 9 6.8% 5 5.5% -4 -44.4% -11 -68.8%
25-29 14 10.6% 2 2.2% -12 -85.7% -6 -75.0%
30-34 12 9.1% 3 3.3% -9 -75.0% -6 -66.7%
35-44 20 15.2% 26 28.6% 6 30.0% 0 0.0%
45-54 11 8.3% 15 16.5% 4 36.4% -5 -25.0%
55-64 6 4.5% 8 8.8% 2 33.3% -3 -27.3%
65-74 8 6.1% 7 7.7% -1 -12.5% 1 16.7%
75 &older 5 3.8% 7 7.7% 2 40.0% -6 -46.2%
To tal 132 100.0% 91 100.0% - 41 - 31.1% - 41 - 31.1%
1990 2000 To tal Change
Under 18 years of age 44 Under 18 years of age 14 18 and under - 30
%of total population 33.3% %of total population 15.4% %change - 68.2%
Total 65 yrs and older 13 Total 65 yrs and older 14 65 and older 1
%of total population 9.8% %of total population 15.4% %change 7.7%
Median Age 28.6 Median Age 41.8 Median Age 13.2
Total Females 67 Total Females 43 Total Females - 24
Total Males 65 Total Males 48 Total Males - 17
To tal P o pulatio n 132 To tal P o pulatio n 91 To tal Change - 41
Source: U.S. Census Bureau, Census of Population and Housing, STF-1A, 1990; DP-1 2000
Table 2 exhibits the age cohort structure for Truesdale in 1990 and 2000. Population age structure may indicate
significant changes that are affecting the different population segments within the City. Realizing the number of persons
in each age cohort, and at what rate the age cohorts are changing in size, will allow for informed decision-making in
order to maximize the future use of resources. As shown in Table 2, changes between 1990 and 2000 occurred within a
number of different age group cohorts.
One method of analyzing cohort movement in a population involves comparing the number of persons aged between 0
and 4 years in 1990 with the number of persons in the same age cohort 10 years later, or aged between 10 and 14 years in
2000. For example, in Truesdale, there were 10 children between the ages of 0 and 4 in 1990, and in 2000 there were 3
children between the ages of 10 and 14, a decrease of 7 children. A review of population by this method permits one to
TRUESDALE, IOWA COMPREHENSIVE DEVELOPMENT PLAN 2008 11PROFILE TRUESDALE undertake a detailed analysis of the cohorts moving in and out of the City. The negative change in this cohort indicates out-migration. Truesdale experienced growth in only a few of its age cohorts. The 0 to 4 and 5 to 9 cohorts always indicate an increase, since the persons in those groups were not born when the previous census was completed. Note that the cohorts represented in Table 2 differ from those listed below due to the consolidation of the 25-29 and 30-34 cohorts from 1990 into a 35-44 cohort in 2000. Besides the 0 to 4 and 5 to 9 age groups, only one age group increased in population between 1990 and 2000, as shown below: 1990 Age Cohort Number 2000 Age Cohort Number Change NA NA 0-4 years 3 persons + 3 persons NA NA 5-9 years 5 persons + 5 persons 55-64 years 6 persons 65-74 years 7 persons + 1 person Total Change + 9 persons Many of the age-cohorts that existed in 1990 and 2000 declined in number. While the City’s population decreased during this ten year span, an analysis of where the changes took place will lead to an understanding of what services will be needed in the future. Decreases in the cohorts occurred in eight of the age groups between 1990 and 2000, as follows: 1990 Age Cohort Number 2000 Age Cohort Number Change 0-4 years 10 persons 10-14 years 3 persons - 7 persons 5-9 years 13 persons 15-19 years 7 persons - 6 persons 10-14 years 16 persons 20-24 years 5 persons - 11 persons 15-19 years 8 persons 25-29 years 2 persons - 6 persons 20-24 years 9 persons 30-34 years 3 persons - 6 persons 35-44 years 20 persons 45-54 years 15 persons - 5 persons 45-54 years 11 persons 55-64 years 8 persons - 3 persons 65 years + 13 persons 75 years + 7 persons - 6 persons Total Change - 50 persons The two age cohorts, from 2000, representing the most negative change, are the 10-14 and 20-24 age cohorts, losing 7 and 11 persons, respectively. Four others each decreased by 6 people. The changes in the 75 years and older age cohort were most likely due to deaths or people moving into elderly care facilities located in other counties. The changes in the 20-24 and 25-29 age cohorts in 2000 is most likely related to persons completing their postsecondary education and moving onto new careers outside of the City. The change in the 25-29 and 30-34 age cohorts indicates that the City needs to focus on economic development strategies that attempt to capture a larger share of that age group as they finish their college education. TRUESDALE, IOWA COMPREHENSIVE DEVELOPMENT PLAN 2008 12
PROFILE TRUESDALE The median age in Truesdale increased sharply from 28.6 years in 1990 to 41.8 years in 2000. The proportion of persons less than 18 years of age decreased by 68.2% between 1990 and 2000, while the proportion of those aged 65 years and older increased by 7.7% overall. The number of persons aged 55-74 decreased by 2 persons. In order to accommodate a growing number of elderly, who typically desire the ability to remain in place as they age, Truesdale, in cooperation with Buena Vista County, should be involved in developing facilities that can house those in need of assistance and allow them to feel safe and comfortable. To encourage the return of the younger and middle age groups, the City should be involved in economic development activities, including housing options and the continued maintenance and improvement of infrastructure to accommodate new growth, making Truesdale an attractive place to live and work. POPULATION PROJECTIONS Population Projections are estimates based upon past and present circumstances. Population projections allow Truesdale to estimate what the population will be in future years by looking at past trends. By analyzing population changes in this manner, the City will be able to develop a baseline of change from which they can create different future scenarios. A number of factors (demographics, economics, social, etc.) may affect projections positively or negatively. At the present time, these projections are the best crystal ball Truesdale has for predicting future population changes. There are many methods to project the future population trends; the eight projections used below are intended to give Truesdale a broad overview of the possible population changes that could occur in the future. Trend Line Analysis Trend Line Analysis is a process of projecting future populations based upon changes during a specified period of time. In the analysis of Truesdale, three different trend lines were reviewed: 1940 to 2004, 1990 to 2004, and 2000 to 2004. A review of these trend lines indicates the City is likely to experience a decrease in population through 2030. The following projections summarize the decennial population for Truesdale through 2030. Truesdale Trend Analysis Year Trend: 1940 to 2004 Trend: 1990 to 2004 Trend: 2000 to 2004 2010 84 persons 76 persons 86 persons 2020 73 persons 58 persons 79 persons 2030 63 persons 44 persons 72 persons TRUESDALE, IOWA COMPREHENSIVE DEVELOPMENT PLAN 2008 13
PROFILE TRUESDALE Cohort Survival Analysis Cohort Survival Analysis reviews the population by different age groups and sex. The population age groups are projected forward by decade using survival rates for the different age cohorts. This projection model accounts for average birth rates by sex and adds the new births into the future population, but excludes migration factors. The Cohort Survival Model projection indicates Truesdale’s population will decrease slightly through year 2010, followed by increases during the two decades through 2030. Truesdale’s Cohort Survival Analysis Year Cohort Survival Model 2010 87 persons 2020 86 persons 2030 85 persons Summary of Population Projections Using the modeling techniques discussed in the previous paragraphs, a summary of the six population projections for Truesdale through the year 2030 is shown in Figure 1. Three population projection scenarios were selected and include (1) a Low Series; (2) a Medium Series; and, (3) a High Series. All of the projections forecast a slight decrease in City population through the year 2030. The following population projections indicate the different scenarios that may be encountered by Truesdale through the year 2030. Year Low Series = 1940-2004 Medium Series = 1990-2004 High Series = Cohort 2010 76 persons 86 persons 87 persons 2020 58 persons 79 persons 86 persons 2030 44 persons 72 persons 85 persons Figure 1 reviews the population history of Truesdale between 1900 and 2004, and identifies the three population projection scenarios into the years 2010, 2020, and 2030. Figure 3 indicates the peak population for Truesdale occurred in 1950 with 158 people. Beginning in 1940, Truesdale has had an overall steady population. The only major changes occurred during the 1990’s when the population dropped significantly from 132 to 91 in 2000. TRUESDALE, IOWA COMPREHENSIVE DEVELOPMENT PLAN 2008 14
PROFILE TRUESDALE
FIGURE 1: POPULATION TRENDS AND PROJECTIONS, CITY OF TRUESDALE, 1940 TO 2030
250
225
200
175
158
153
150
1 35
1 32
1 32
128
125
91
100
88
87
86
86
85
79
76
72
75
58
44
50
25
0
1940 1950 1960 1970 1980 1990 2000 2004 2010 2020 2030
Cit y of T ruesdale Low Series Medium Series High Series
Source: U.S. Census Bureau, Census of Population and Housing, 1940-2000, 2004
As stated previously, the projections have been developed from data and past trends, as well as present conditions. A
number of external and internal demographic, economic, and social factors may affect these population forecasts.
Truesdale should monitor population trends, size, and composition periodically in order to understand the direction their
community is heading. Truesdale’s greatest population threat continues to be out-migration, and strategies should be
developed to further examine and prevent this phenomenon.
TABLE 3: POPULATION PROJECTION SERIES, BUENA VISTA COUNTY AND COMMUNITIES, 2000 TO 2030
2000 Lo wSeries M edium Series High Series
Co mmunity
Cens us 2010 2020 2030 2010 2020 2030 2010 2020 2030
Albert City 709 913 918 922 934 969 1,004 933 986 1,042
Alta 1,865 2,403 2,414 2,425 2,458 2,548 2,641 2,454 2,594 2,740
Lakeside 484 624 627 629 638 661 685 637 673 711
Linn Grove 211 272 273 274 278 288 299 278 294 310
Marathon 302 389 391 393 398 413 428 397 420 444
Newell 887 1,143 1,148 1,154 1,169 1,212 1,256 1,167 1,234 1,303
Rembrandt 228 294 295 297 300 311 323 300 317 335
SiouxRapids 703 906 910 914 926 960 996 925 978 1,033
Storm Lake 9,981 12,860 12,920 12,980 13,153 13,634 14,134 13,134 13,884 14,664
Truesdale 88 113 114 114 116 120 125 116 122 129
Incorporated Areas 15,458 19,916 20,010 20,103 20,370 21,116 21,890 20,341 21,503 22,711
Unincorporated Areas 4,953 6,382 6,411 6,441 6,527 6,766 7,014 6,518 6,890 7,277
Buena Vis ta Co unty 20,411 26,298 26,421 26,544 26,897 27,882 28,904 26,859 28,393 29,988
Source: Population projections, JEO Consulting Group, 2005
Table 3 shows the population projection by series for each of the areas within Buena Vista County. The population
projections for the communities were found by determining the proportion of the total population that each community
had in 2000 and calculating that percentage for each series. This method of projection is helpful and gives an idea of
where people are likely to live if the current trends throughout the county continued. This method does not consider the
TRUESDALE, IOWA COMPREHENSIVE DEVELOPMENT PLAN 2008 15PROFILE TRUESDALE
social issues that people use when choosing a place to live, which have the potential to alter population projections in
any direction.
Truesdale’s population is projected to increase from 88 in 2000 to as high as 129 in 2030 in Table 3. This projection
differs from the summary of population projections listed above which projects a low population of 44 and a high
population of 85 by 2030.
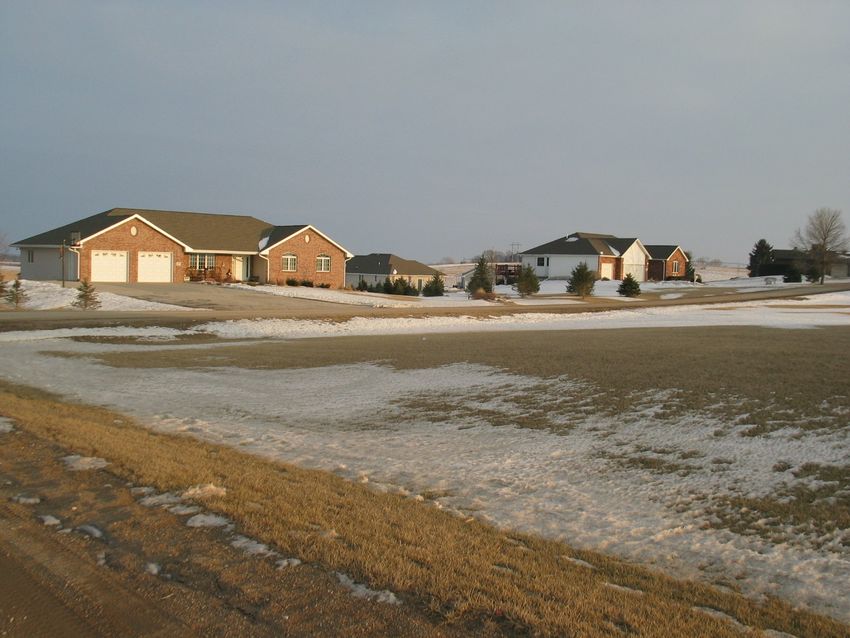
HOUSING PROFILE
The Housing Profile in this Plan identifies existing housing characteristics and projected housing needs for residents of
Truesdale. The primary goal of the housing profile is to allow the City to determine what needs to be done in order to
provide safe, decent, sanitary, and affordable housing for every family and individual residing within Truesdale. The
housing profile is an analysis that aids in determining the composition of owner-occupied and renter-occupied units, as
well as the existence of vacant units. It is important to evaluate information on the value of owner-occupied housing
units, and monthly rents for renter-occupied housing units, to determine if housing costs are a financial burden to
Truesdale residents.
To project future housing needs, several factors must be considered. These factors include population change, household
income, employment rates, land use patterns, and residents' attitudes. The following tables and figures provide the
information to aid in determining future housing needs and develop policies designed to accomplish the housing goals
for the City of Truesdale.
AGE OF EXISTING HOUSING STOCK
An analysis of the age of Truesdale’s housing stock reveals a great deal about population and economic conditions of the
past. The age of the housing stock may also indicate the need for rehabilitation efforts, or new construction within the
community. Examining the housing stock is important in order to understand the overall quality of housing and the
quality of life in Truesdale.
FIGURE 2: AGE OF EXISTING HOUSING STOCK, CITY OF TRUESDALE, 2000
30
27
25
20
15
15
10
10
5
2
0 0 0 0
0
1939 or earlier 1940-1949 1950-1959 1960-1969 1970-1979 1980-1989 1990-1998 1999-3/2000
Source: U.S. Census Bureau, Census of Population and Housing, SF3, 2000
TRUESDALE, IOWA COMPREHENSIVE DEVELOPMENT PLAN 2008 16PROFILE TRUESDALE
Figure 2 indicates 27, or 50.0% of Truesdale’s housing units were constructed prior to 1940. There were 25 additional
housing units constructed between 1940 and 1959, which indicates there was a strong economy during this time. In
addition, there were 2 housing units built between 1980 and 1989, which coincides with the population growth
experienced during this decade. Half of Truesdale’s housing units were built prior to 1940, which may indicate a need
for a housing rehabilitation program to improve the quality and energy efficiency of these older homes. Additionally,
demolition of units that are beyond rehabilitation may be necessary.
Housing Trends
An analysis of housing trends can reveal a great deal about the different sectors of the population in Truesdale. Housing
trends may also indicate the potential demand for additional owner- or renter-occupied housing. Examining housing
trends is important in order to understand the overall diversity of the population and their quality of life within the
community.
TABLE 4: COMMUNITY HOUSING TRENDS, CITY OF TRUESDALE, 1990 AND 2000
% Change
Sele cted C haracteris tics 1990 2000 Change
1990- 2000
Population 132 91 (41) -31.1%
Persons in Households 132 91 (41) -31.1%
Persons in Group Quarters - - - -
Persons per Household 3.00 2.33 -0.67 -22.3%
To tal Ho us ing Units 48 47 (1) -2.1%
Occupied Housing Units 44 39 (5) -11.4%
Owner-Occupied units 35 34 (1) -2.9%
Renter-Occupied units 9 5 (4) -44.4%
Vacant Housing Units 4 8 4 100.0%
Owner-Occupied vacancyrate - 0.0% - -
Renter-Occupied vacancyrate - 0.0% - -
M edian Co ntract Rent - 1990 and 2000
Cityof Truesdale $175 $225 $50 28.6%
Buena Vista County $218 $320 $102 46.8%
Io wa $ 261 $ 383 $ 122 46.7%
M edian Value o f Owne r- Occupie d Units - 1990 and 2000
Cityof Truesdale $14,999 $22,700 $7,701 51.3%
Buena Vista County $41,400 $65,900 $24,500 59.2%
Io wa $ 45,900 $ 82,100 $ 36,200 78.9%
Source: U.S. Census Bureau, Census of Population and Housing, STF-1A, 1990, DP-4 2000
Table 4 indicates the number of persons living in households decreased between 1990 and 2000 by 41 persons, or
-31.1%, with no persons living in group quarters. In addition, the number of persons per household decreased from 3.00
to 2.33 persons. Nationally, the trend has been towards a declining household size, and Truesdale appears to be
coinciding with this trend.
Table 4 also indicates the number of occupied housing units decreased from 44 in 1990 to 39 in 2000, or -11.4%, while
vacant housing units doubled from 4 in 1990 to 8 in 2000.
TRUESDALE, IOWA COMPREHENSIVE DEVELOPMENT PLAN 2008 17PROFILE TRUESDALE
Median contract rent in Truesdale increased from $175 per month in 1990 to $225 per month in 2000, or 28.68%, while
rent in Buena Vista County and the State of Iowa increased by 46.8% and 46.7%, respectively. This indicates Truesdale
has seen contract rent grow at a rate nearly two-thirds of that of the County and State. Comparing changes in monthly
rents between 1990 and 2000 with the Consumer Price Index (CPI) enables the local housing market to be compared to
national economic conditions. Inflation between 1990 and 2000 increased at a rate of 32.1%, indicating Truesdale rents
increased at a rate less the rate of inflation. Thus, tenants were paying lower monthly rents in 2000, in terms of real
dollars, than they were in 1990, on average.
The median value of owner-occupied housing units in Truesdale increased from $14,999 in 1990 to $22,700 in 2000, an
increase of 51.3%. The median value for owner-occupied housing units in Buena Vista County and the State showed an
increase of 59.2% and 78.9%, respectively. Housing values in Truesdale increased at nearly 1.5 times the rate of the CPI.
This indicates housing values at all levels exceeded inflation and were valued significantly higher in 2000, in terms of
real dollars, than in 1990, on average. This trend has created a seller’s market, it can also act as an incentive to property
owners to update and rehabilitate housing units.
TABLE 5: HOUSING UNITS BY COMMUNITY, BUENA VISTA COUNTY AND COMMUNITIES - 2000
Housing Occupied Housing Vacant Owner- Renter- Persons per
Units Units Units Occupied Occupied Household
Community 2000 2000 2000 2000 2000 2000
Albert City 312 284 28 233 51 2.38
Alta 791 726 65 526 200 2.56
Lakeside 211 184 27 152 32 2.63
Linn Grove 99 89 10 75 14 2.37
Marathon 162 138 24 109 29 2.19
Newell 381 361 20 295 66 2.32
Rembrandt 102 96 6 73 23 2.38
SiouxRapids 338 306 32 239 67 2.28
Storm Lake 3,706 3,466 240 2,215 1,251 2.57
Trues dale 47 39 8 34 5 2.33
Incorporated Areas 6,149 5,689 460 3,951 1,738 2.40
Unincorporated Areas 1,996 1,810 186 1,328 482 2.62
Buena Vista County 8,145 7,499 646 5,279 2,220 2.54
Source: U.S. Census Bureau, Census of Population and Housing, SF1 – DP1 2000
Table 5 examines housing characteristics for each of the communities and the unincorporated areas in Buena Vista
County in the year 2000. The table indicates that the majority of the housing units are located within communities. More
specifically, 47 or 0.6% are located in the City of Truesdale.
TRUESDALE, IOWA COMPREHENSIVE DEVELOPMENT PLAN 2008 18PROFILE TRUESDALE
TABLE 6: TENURE OF HOUSEHOLD BY SELECTED CHARACTERISTICS, CITY OF TRUESDALE, 1990 TO 2000
1990 2000 O.O. R.O.
Ho us eho lder Owner- Renter- Owner- Renter- P ercent
% O.O % R.O % O.O % R.O
Characteris tic Occupied Occupied Occupied Occupied Change
Tenure by Number o f P ers o ns in Ho us ing Unit (Occupied Ho us ing Units )
1person 8 22.9% 1 11.1% 10 29.4% 2 40.0% 25.0% 100.0%
2 persons 6 17.1% 1 11.1% 12 35.3% 0 0.0% 100.0% -100.0%
3 persons 7 20.0% 4 44.4% 6 17.6% 2 40.0% -14.3% -50.0%
4 persons 8 22.9% 2 22.2% 5 14.7% 0 0.0% -37.5% -100.0%
5 persons 5 14.3% 1 11.1% 1 2.9% 0 0.0% -80.0% -100.0%
6 persons or more 1 2.9% 0 0.0% 0 0.0% 1 20.0% -100.0% NA
TOTAL 35 100.0% 9 100.0% 34 100.0% 5 100.0% - 2.9% - 44.4%
Tenure by Age o f Ho us eho lder (Occ upied Ho us ing Units )
15 to 24 years 1 2.9% 2 40.0% 0 0.0% 2 40.0% -100.0% 0.0%
25 to 34 years 5 14.3% 4 80.0% 1 2.9% 0 0.0% -80.0% -100.0%
35 to 44 years 10 28.6% 3 60.0% 10 29.4% 2 40.0% 0.0% -33.3%
45 to 54 years 8 22.9% 0 0.0% 9 26.5% 0 0.0% 12.5% 0.0%
55 to 64 years 3 8.6% 0 0.0% 5 14.7% 1 20.0% 66.7% 100.0%
65 to 74 years 5 14.3% 0 0.0% 4 11.8% 0 0.0% -20.0% 0.0%
75 years and over 3 8.6% 0 0.0% 5 14.7% 0 0.0% 66.7% 0.0%
TOTAL 35 100.0% 9 180.0% 34 100.0% 5 100.0% -2.9% -44.4%
Source: U.S. Census Bureau, Census of Population and Housing, STF-1A, 1990 / SF4 2000
Table 6 shows tenure (owner-occupied and renter-occupied) of households by number and age of persons in each
housing unit. Analyzing this data allows the City the ability to determine where there may be a need for additional
housing. In addition, the City could target efforts for housing rehabilitation and construction at those segments of the
population exhibiting the largest need.
The largest section of owner-occupied housing in Truesdale in 2000, based upon number of persons, was two-person
households, with 12 units, or 35.3% of the total owner-occupied units. By comparison, the largest household sizes for
rentals were the one-person and three-person households with 2 units each, or 40.0%, of the total renter-occupied units.
Truesdale was comprised of 24 1- or 2-person households, or 61.5% of all households. Households having 5 or more
persons comprised only 2.9% of the owner-occupied segment, and 20.0% of the renter-occupied segment. Citywide,
households of 5- or more persons accounted for only 2 units, or 5.1% of the total.
When compared to 1990, two of the six owner-occupied household groups grew in number. Owner-occupied household
groups of two persons grew by the greatest percentage, increasing by 6 units, or 100.0%, while numerically, units with
five persons decreased by 4 units, or -80.0%. Only one of the six renter-occupied housing unit groups increased, with
one-person units increasing by 1 new unit. Three renter-occupied categories (those with two-, four- and five-persons)
dropped to zero units over the ten-year period.
According to the 2000 data in Table 6, the largest groups of the owner-occupied units were the 35 to 44 and 45 to 54
year categories. The age groups accounted for 29.4% and 26.5% of the total, respectively, for a combined total of 55.9%.
TRUESDALE, IOWA COMPREHENSIVE DEVELOPMENT PLAN 2008 19You can also read