Priorities Viewer 2017-2021 Map Viewer Instructions - SDMMP
←
→
Page content transcription
If your browser does not render page correctly, please read the page content below
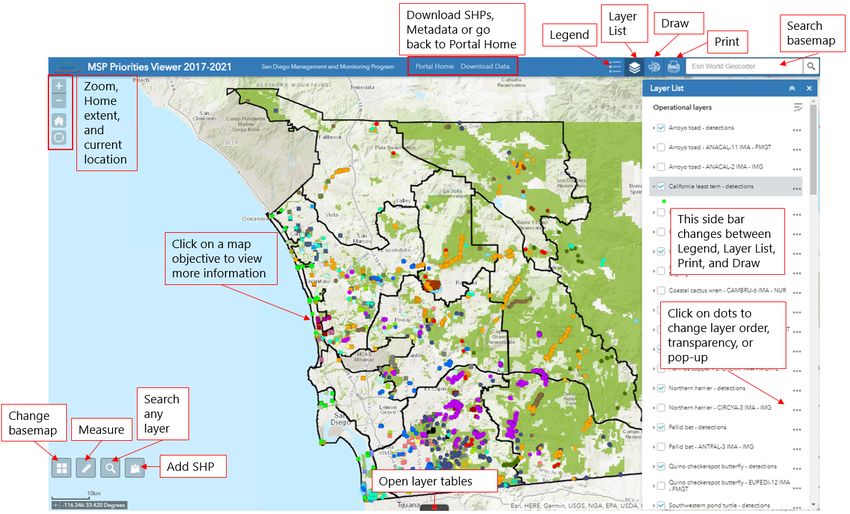
Priorities Viewer 2017-2021
Map Viewer Instructions
SDMMP provides stakeholders with access to spatial information through an
ArcGIS online map viewer. A map viewer is a software program, accessed from a
webpage, which displays a specific set of spatial layers and allows users to
access tools to investigate the layers interactively. Because the map viewer
simply displays spatial information, multiple viewers can be used to display
different combinations of same layers. A spatial layer is a collection of related
objects (or features) that can be viewed through either an online or desktop
viewer.

This instruction sheet provides more detailed instructions and overview of all
the available layers, links, and tools. Additional questions can be sent to Emily
Perkins, SDMMP GIS Manager, at eperkins@usgs.gov.

Main Map Functions
Use the figure on the next page to locate each function on the map viewer’s
interface (Figure 1). The sections below describe each in more detail.

Along the top of the viewer, there are 3 links that will lead outside of the map
page, on a new tab. “Data Downloads” will lead to the USGS online data
repository called Sciencebase and contains all the SDMMP layers (including
many not shown on this viewer) available to download in a form used on a
desktop mapping program, including layer metadata. “Portal Home” returns to
the portal home page.

Figure 1: Layout of Viewer
Pop-up information
To get more information about an object, click on the map where the object is located and a pop-
up window will appear. Attributes include the species name, management category, links to
species information, and priority objective information. Links include the Goals, Objectives, and
Actions (tracker), the species profile, and the species summary page. Information about the
priority objective(s) includes the objective number, the objective code, the short objective
description, the MUs, and the IMA description.

  Figure 2: Pop-up windows

Some locations may include multiple pop-up windows. This may be because a single plant
occurrence was surveyed in multiple years or an animal polygon overlaps a plant or another
animal occurrence. At the top of the pop-up box, on the left side, a statement (1 of XX) indicates
how many overlapping objects occur in that location. Click the triangle on the top right corner of
the box, to scroll through all the pop-up information available. Take note of the bright blue
outline that appears on the map. It will change to highlight the selected object.

                                                                                                    3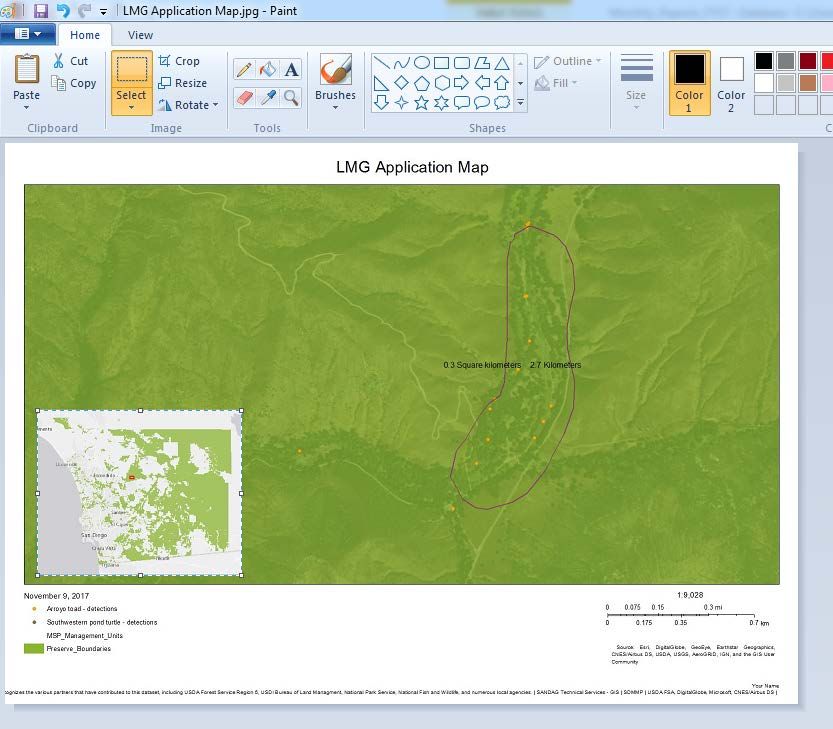
Sidebar Options
The sidebar on the right of the map, is controlled by clicking on
the icons along the top right of the map viewer. Each option is discussed below.
Legend
The legend simply displays the symbology of all the active (checked) layers in the order they are
drawn on the map (Figure 4, next page). To toggle the layers, use the Layers List.
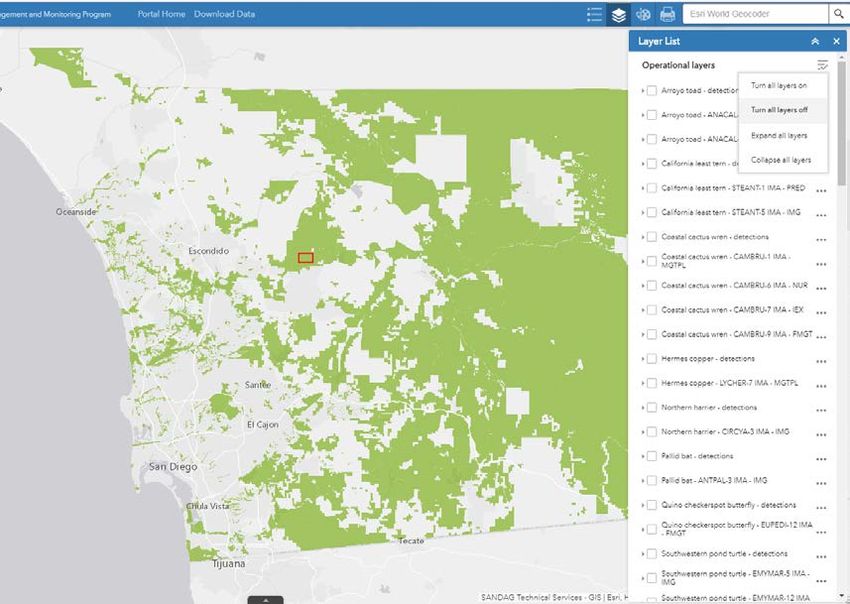
Layers List
The Layers List displays the map’s layers in the
order they are viewed (Figure 3). Layers lower
on the list will appear under layers higher up
on the list. The check box next to the layer
name turns the layers on and off. If you click
on the layer name, additional information
will appear. Clicking on the sublayer names
will show the symbology for that particular
layer. In Figure 3, The Non-Prioritized
Occurrences have been expanded to view a
list of sub-layers. The sub-layer has been
further expanded to show the symbology of
the layer. Symbols can also be seen by
viewing the legend.
The check boxes work in a hierarchical
structure. For instance, turning off the “Non-
Prioritized Occurrences” layer will also
remove all sublayers from the map display
but they will remain checked. It is helpful to
turn off layers at the highest level necessary
and only turn on layers that are necessary.
This will keep down confusion in the Layer
List as well as pop-ups in the map display.
Click on the grey, down arrow to the right to
open the attribute table for each layer.
Figure 3: Layer List
4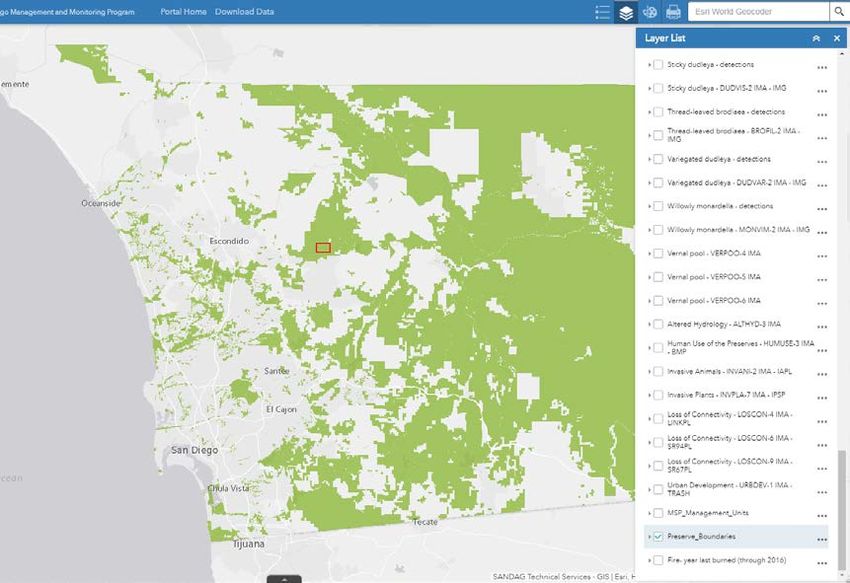
Figure 5: Print

                   Figure 5: Draw

Figure 4: Legend

                                             5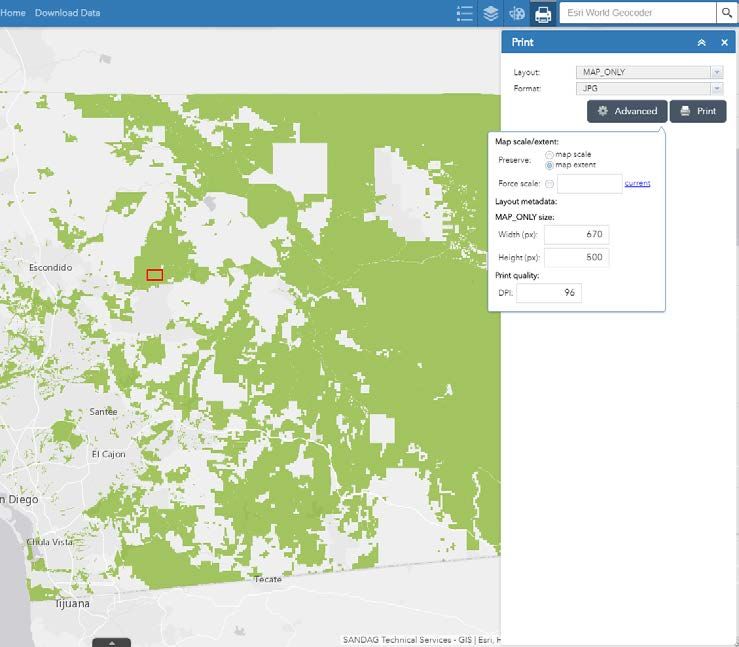
Figure 6: Print

                  6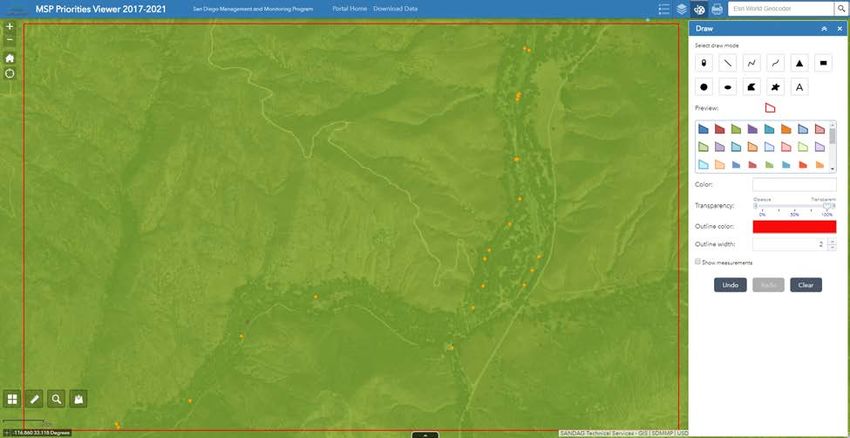
Draw
The draw tools allows you to create points, lines, shapes or polygons to the map (Figure 5).
Choose a type of drawing, and select the color, transparency, and outline color. The check box at
the bottom “Show Measurements” will display on the map the area or length of the drawing
created. Be sure to check this box before drawing or the area will not show up. Once drawn, it
cannot be edited but the drawing can be cleared and redone. This will not show in the legend
but will be displayed on the printed map.

Print
The print function allows you to create a PDF or JPG map of the area currently in the map’s
extent. There are several options for layouts and formats available. Type in a Map Title and
choose one of the pre-set layouts. A3 or A4 formats are recommended for a complete layout
with legend items. In the advanced area, you can choose to maintain the map’s current scale or
extent, type in an author and copyright information, turn the legend on or off, and control the
map size and quality (Figure 6). Once the parameters are set, click print. A loading bar will
appear for a brief time and be replaced with the title of your map, once it is complete. Click on
the title to open a new tab with the map and save the file to your computer.

Widgets
Widgets are located in the bottom left corner of the map and provide the functions Query,
measure, and change basemaps.

Basemap
A basemap is a static layer with basic location information. The default for this viewer displays
general topography and locations. To change the basemap to any of the default ESRI basemaps by
clicking the icon with 4 smaller boxes. Click on the new basemap in the dialog box and the map will
be automatically updated. A description of each of the basemaps can be found at:
http://www.esri.com/software/arcgis/arcgisonline/maps/maps-and-map-layers.

Measure Tool
The measure tool will calculate distance and area in several available units. It will also calculate the
XY coordinates for any location on the map. Open the dialog box by clicking on the ruler icon.
Choose from the icons at the top (either distance, area, or location). Use the drop down list next to
the icons to specify units. Then draw on the map the shape to be measured. This will not be shown
in the legend or on a printed map.
                                                                                                        7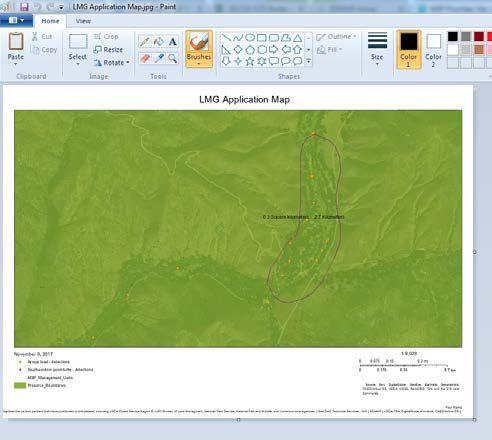
Search Layers
The magnifying glass icon queries layer information. Click on the icon, and type in a search term.
You do not need to select which layer you want to search. It will search all species, vegetation
communities, threats, and preserves. Click on the items in the search results to zoom to the
object and open the pop-up window.

 Adding an overview map (inset) to your map image.
Unfortunately, the automatic inset feature is not available. But an inset map can still be added
manually by using these steps.
   1. Create the area-specific map (zoomed in). Change the advanced properties and save the
       map as a jpg file.

   2. While still zoomed into the map area, open the draw tool. Clear the existing drawings (only
      after the map has been printed and saved). Choose the square shape. Make in the inside
      100% transparent. Make the outline color red. Do not show measurements. Draw a square
      around the full current extent.

                                                                                                     8
3. Zoom out to the full county. Turn off all of the species layers and change the basemap. The
   square drawing will now show where your map is located.

                                                                                            9
4. Use the print tool again. Choose layout = MAP_ONLY and the format as jpg. In the
advanced settings, in the “Map scale/extent” section, choose “map extent”.
5. Open Paint or another image editing software (power point would work). Cut and paste the
MAP_ONLY (full county extent) into a corner of your larger map.
16. Save the file as a jpg.
Conclusion
This map viewer gives users the ability to search layers, change basemaps, draw shapes, calculate
acreages, and print custom maps. This instruction sheet covers the basics of each of these
functions. For additional help, contact Emily Perkins of SDMMP, eperkins@usgs.gov.
1You can also read