Prioritizing Tanzania's agricultural development policy to build smallholder climate resilience
←
→
Page content transcription
If your browser does not render page correctly, please read the page content below

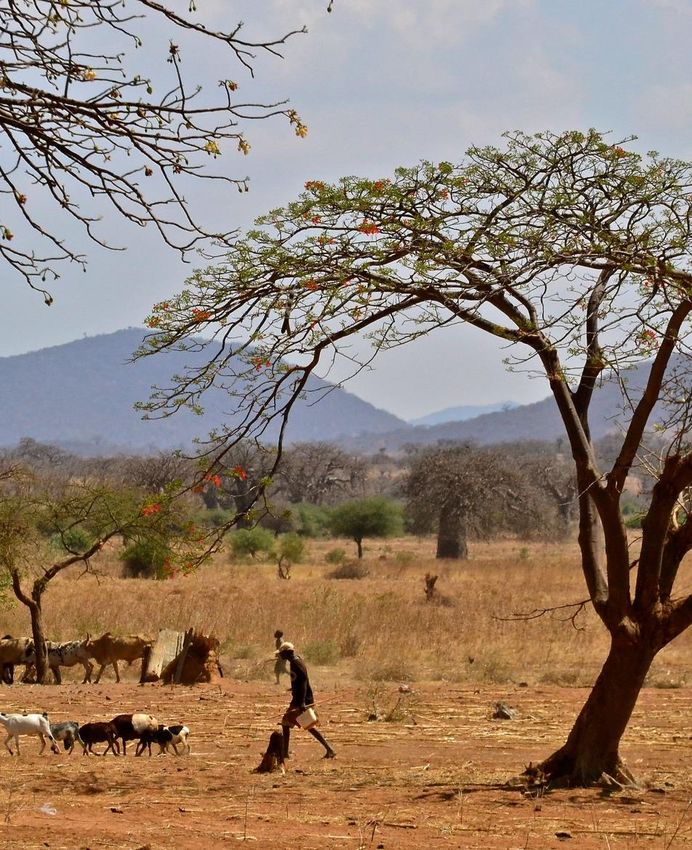
Prioritizing Tanzania’s agricultural
development policy to build
smallholder climate resilience
Final report for the Bill & Melinda Gates Foundation Grand Challenges Explorations
22: Risk-explicit and Evidence-based Policy Prioritization (REAP)

Christine Lamanna, Barbaros Yet, Anthony Kimaro, Keith D. Shepherd, Kristal Jones, Megan
Mayzelle, Andreea Nowak, Kate Salemo, and Todd S. Rosenstock.

 Photo: C. Schubert (CCAFS)

 PAGE 1

CITATION:
Lamanna C, Yet B, Kimaro A, Shepherd KD, Jones K, Mayzelle M, Nowak AC, Salermo K, and
Rosenstock TS. 2021. Prioritizing Tanzania’s agricultural development policy to build smallholder
climate resilience. Final report for the Bill & Melinda Gates Founadtion Grand Challengex
Explotations 22: Risk-explicit and Evidence-based Policy Prioritization (REAP). World Agroforestry
(ICRAF), Nairobi, Kenya.

ACKNOWLEDGEMENTS:
This work was conducted under the CGIAR Research Programs on Climate Change, Agriculture,
and Food Security (CCAFS) and Water Land, and Ecosystems (WLE) and specifically implemented
by the Partnerships for Scaling Climate-Smart Agriculture (P4S) project team. We thank the Bill &
Melinda Gates Foundation for its support. Document editing and review was carried out by
Stephanie Pentz.

EXECUTIVE SUMMARY
Faced with myriad options, Sub-Saharan Africa policy makers
struggle to prioritize actions. Commonly used modeling approaches
perform poorly in data scare conditions or focus intently on tools at
hand. Policies, by consequence, report ‘wish lists’, making them a
challenge to implement given resource constraints. Here, we
evaluate the potential of using an alternative approach, Bayesian
Networks (BNs), to prioritize agricultural policy actions, specifically
modeling seven ‘Investment Areas’ listed in Tanzania’s Agriculture
Sector Development Programme II.

Our probabilistic model generates information that can help
prioritize agricultural policy actions in the face of multiple risks. To
begin with, it calculates standard performance measures including
return on investment (ROI) and net present value (NPV) based on the
benefits accrued to smallholders. In our case study, all seven
modeled investment areas are predicted to have positive ROIs on
average. However, the shape of the ROI distributions across model
runs differs among investments and no investment has zero
probability of a negative outcome providing information on the
likelihood of outcomes and downside risk, respectively. The analysis
also delivers information on the investments’ resilience by
calculating performance metrics under no risk, only climate risk, and
climate and social risk scenarios. We found that five of seven
investments see an increased ROI under the climate risk scenario
compared to the scenario with no risks. Measures of the relative
performance under various scenarios helps policy makers prioritize
according to their appetite for risk. Such results that evaluate
investment performance amongst diverse investment types and
assumption of future conditions, indicate BNs are a suitable tool for
policy prioritization.

User perceptions were our primary measure of success provided our
design objective. Fifteen representative stakeholders verified the
results’ utility and expressed appreciation for inclusion of oft-ignored
concerns such as political risks, though feedback from some was
more tempered. Potential users suggested future model iterations
should include market shocks, the ability to disaggregate
beneficiaries, and non-economic outcomes. Our own reflections
mirrored these responses and we identified six additional lessons
such as defining a default, but adaptable, model structure and
parameter values to lower the bar for use. These reflections
together lay out a roadmap to ready this approach to scale broadly
in support of policy prioritization.

 PAGE 3

TABLE OF CONTENTS

NEW APPROACHES TO POLICY PRIORITIZATION ................................................. 5
THE TANZANIA CONTEXT ........................................................................................ 7
DEVELOPING A BAYESIAN NETWORK .................................................................. 11
PERFORMANCE OF THE ASDP II PRIORITY INVESTMENTS ................................. 17
STAKEHOLDER FEEDBACK .................................................................................... 19
RESEARCHER REFLECTIONS .................................................................................. 22
CONCLUSIONS ....................................................................................................... 24
REFERENCES ........................................................................................................... 25
ANNEXES ................................................................................................................. 28
 Annex A. A review of select policy prioritization approaches ........................ 29
 Annex B. Model structure .................................................................................. 40
 Annex C. Bass model and project adoption typologies .................................. 42
 Annex D. Resilience typologies .......................................................................... 43
 Annex E. Survey Instrument .............................................................................. 44
 Photo: N. Mtimgwa (CIFOR)

 PAGE 4
1 NEW APPROACHES TO POLICY PRIORITIZATION

 Agriculture is the backbone of the economy prioritizing agricultural policy development
 and the main livelihood activity in most and implementation difficult. Decision makers
 developing countries. In Sub-Saharan Africa, often include all possible priorities in policies,
 agriculture contributes an average of 20% of ultimately resulting in unwieldy strategies that
 the gross domestic product (GDP) and cannot be effectively implemented given the
 employs more than 50% of the population, limited financial and human resources
 often as smallholder farmers (World Bank available. Policy makers need to prioritize.
 2019a). Women comprise 25-60% of the Many modeling frameworks are available to
 agricultural labor force (Palacios-Lopez et al. help, but agricultural policymakers in Sub-
 2017) but women-headed households tend to Saharan Africa rarely utilize them because
 have small farm sizes and own fewer livestock data are scarce, assumptions are non-
 than male-headed households (Tavenner et al. transparent, and most models require specific
 2019). Agricultural production is also technical capacity (Table 1, Annex A).
 susceptible to climate change, with yields of
 the majority of agricultural crops in the tropics The Bill & Melinda Gates Foundation Grand
 projected to decrease by 8% to nearly 30% by Challenge New Approaches for Strategic
 2050 (Wheeler and von Braun 2013), even as Prioritization of Agricultural Development
 demand for food will increase by 2050 (Lobell Policies aims to address these difficulties by
 et al. 2008). Thus, agriculture is a key lever for developing new methods to assist policy
 achieving diverse development goals, such as makers and implementers in analyzing their
 food and nutritional security, decent options and choosing the most promising
 livelihoods, gender equity, and adaptation. approaches to achieving development
 objectives. In response to this challenge, we
 Many options exist for catalyzing inclusive propose testing the utility of BNs for
 agricultural transformation. Decision makers agricultural policy prioritization using a
 could, for example, choose to prioritize: participatory, evidence-based, and risk-explicit
 • Building infrastructure such as irrigation model. We hypothesize that (i) BNs will allow
 schemes, road networks, or electrification. users to compare various policy options or
 • Bolstering the availability of information to development interventions, (ii) the
 farmers through improved extension incorporation of risk and uncertainty in the
 systems and digital tools. modeling will result in more realistic and
 • Reducing the impact of shocks on useful results information to inform decision
 livelihoods through services such as social making shape prioritization, and (iii) the
 safety nets, agricultural insurance, participatory process will increase make
 microloans, and early warning systems. stakeholders feel personal investment ed and
 • Increasing yields and reducing emissions engagement in this approach. To undertake
 intensity in the face of climate change by this test, we focus on the case of agricultural
 developing and incentivizing adoption of policy for climate change resilience in the
 adaptive on-farm management practices. United Republic of Tanzania (hereafter
 The diversity of options and the complexity of ‘Tanzania’).
 intervention-to-outcome pathways makes

 PAGE 5
Table 1 | Summary comparison of select modeling frameworks. Modeling frameworks differ
across important attributes that affect their relevance and likelihood of use for policy prioritization.
A more in-depth discussion of the pros and cons of these approaches can be found in Annex A. The
REAP project - reported on here - develops and evaluates the use of Bayesian Networks specifically.

 Appropriate
 Scale of level of Model Non-economic Risk and
 Approach analysis intervention structure Data needs outcomes uncertainty

 Bayesian Complex A wide range, One-way or Qualitative data Easy to include Included as
 Networks systems with from projects non- and expert and model, probability
 many actors for households recursive, no opinion can be often as distributions
 or and individuals feedbacks exclusively used; unobserved or
 characteristics to national unless in more complex latent variables
 policy multiple models require
 timesteps quantitative data;
 Users can help
 define model
 structure

 Fuzzy Complex A wide range, Feedback Only qualitative Easy to include Yes, but
 Cognitive systems with from projects loops data can be used; and model uncommon
 Maps many actors for households allowed; users assign
 or and individuals dynamic and values and define
 characteristics to national recursive model structure
 policy

 Agent-based Simulated at A wide range, Dynamic and Data resource- Yes, but not Yes, but not
 models the agency from projects recursive; intensive; Users standard standard
 level to for households provides define the agents
 understand and individuals dynamic
 system as a to national results
 whole policy

 Household Individuals Projects for No Require extensive Can be Error terms
 agricultural and households feedbacks; empirical data included; good are
 models households and individuals unidirectional for gender- potentially
 relationships disaggregated large with
 analysis scant data

 Computable Markets Regional, Static results; Entail significant Not usually Sensitivity
 generalizable within national, or no solid data demand are included analyses
 equilibrium regional or international econometric technical
 national policy change foundation modeling-centric
 economies or market
 shocks

 Multi-criteria Complex A wide range, No Data and expert Easy to include Included as
 analysis systems with from projects feedbacks; knowledge can be probability
 many actors for households unidirectional used in distributions
 or and individuals relationships combination,
 characteristics to national though data are
 policy not required

 PAGE 6

2 THE TANZANIA CONTEXT

 Tanzania’s agriculture and climate change
 context is indicative of countries across the
 continent. The economy depends heavily on
 agriculture: in 2020, agriculture contributed
 28% of Tanzania’s GDP and employed 65% of
 its workforce (Chuwa 2020). Approximately 7.8
 million households are directly engaged in
 agriculture, the majority of which are
 smallholder farmers producing crops or
 livestock. Smallholder farms account for 90% of
 the cultivated lands in Tanzania and their use
 of inputs remains low; inorganic fertilizers are
 applied to only 8% of the nation’s cropped
 area, and improved seeds are grown on about
 21%. Fully irrigated areas are virtually non-
 existent among smallholders and comprise
 less than 0.7% of total national agricultural
 land (FAO 2016). As such, the Tanzanian
 national economy and the livelihoods of the Photo: C. Schubert (CCAFS)

 majority of its population are directly reliant on
 the natural resource base, which are threatened
 by climate change. 2020 locust plague (Meynard et al. 2020).
 Adapting to and planning for climate change
 Climate change impacts in Tanzania will largely impacts is thus of critical importance for
 be felt in changing rainfall patterns across the Tanzania’s agricultural sector.
 country. Although changes in mean annual
 rainfall are likely to be relatively modest The importance of agriculture to Tanzania is
 (Luhunga et al. 2018), variability in the timing evident in its policy. Tanzania’s Vision 2025
 and intensity of rainfall will increase (1995) identifies agriculture as a key
 (Chamberlin et al. 2009). Increased variability in development priority. The Ministry of
 rainfall impacts the livelihood of Tanzania’s Agriculture (MoA) created the Agricultural
 smallholder farmers, fishers and pastoralists Sectoral Development Strategy (ASDS - 2001)
 through uncertainty in planting dates and failed and the Agricultural Sector Development
 harvests, changing lake levels, and difficulty in Programme (ASDP - 2006) to guide growth in
 managing traditional grazing regimes (Conway line with Vision 2025 (Figure 1). Furthermore,
 et al. 2005). Climate change is also increasing Tanzania became a signatory to the
 the frequency and severity of extreme events in international Comprehensive African
 the region, including both droughts and heavy Agricultural Development Programme (CAADP)
 rainfall (Wainwright et al. 2020), as well as compact in 2010, which sets out targets for
 climate-related pest outbreaks such as the agriculture sector spending and development
 on the continent.

 PAGE 7
Figure 1 | Tanzanian policies and strategies relating to climate change (blue) and agriculture
(green) across scales. Arrows indicate where policies explicitly support implementation of a higher-
level policy or program.

Climate change is becoming increasingly Action Area 1: Improving agricultural land and
prominent in Tanzania’s governance. Climate water management
change issues in Tanzania are the responsibility Action Area 2: Accelerating the uptake of
of the Division of Environment (DoE) within the climate-smart agriculture (CSA)
Vice President’s Office. Tanzania does not yet Action Area 3: Reducing the impact of climate-
have an explicit national climate change policy, related shocks
but several overarching strategies have been Action Area 4: Strengthening knowledge
established. The 2012 National Climate Change systems
Strategy (NCCS) aims to support the national
Vision 2025 objectives via climate change Several sub-sectoral documents were
adaptation and mitigation action, as well as subsequently developed under the auspices of
support Tanzania’s commitments to the the ACRP to guide implementation of these
UNFCCC. The NCCS outlines broad adaptation action areas, particularly Action Area 2. In 2017,
options for each vulnerable sector in the the National Climate-Smart Agricultural (CSA)
country. Within the agricultural sector, the NCCS Programme and Climate-Smart Agriculture
promotes resilience to climate change through Guidelines were issued to support the
adaptive crop varieties and agricultural implementation of CSA in the country. The ACRP
practices. also greatly influenced the development of the
 2015 Agriculture Sector Development Strategy II
In response to the NCCS, the MoA put forth the and the Agricultural Sector Development
2014 Agricultural Climate Resilience Plan (ACRP) Programme Phase II (2018-2028); several of the
to provide a roadmap for meeting the objectives ACRP Action Areas became strategic investment
 areas within the ASDP II (Table 2).
of the NCCS, the ASDS, and Vision 2025. The
ACRP prioritizes four action areas:

 PAGE 8

Table 2 | Key agricultural climate resilience topics in Tanzanian policy development.
Dark green indicates a main strategic area, light green indicates one or more mentions of the
topic, and gray indicates unmentioned topics.

 Agricultural climate resilience topics

 Land & soil Irrigation & Climate- Climate
 Dom manage- water smart Improved information Climate risk
 Title Year ain ment harvesting agriculture varieties services reduction

 ASDS 2001 MoA

 NCCA 2012 DoE

 ACRP 2014 MoA

 ASDP II 2018 MoA

At the close of the ACRP in 2019, stakeholders The ASDP II identifies 23 Priority Investment
convened to determine the need for a second Areas for agricultural development in Tanzania.
phase of the ACRP to continue addressing Seven of these priority areas align with
climate change in the agricultural sector. The opportunities promoted for climate resilience in
ability of the ACRP to set priorities and channel Sub-Saharan African agriculture (Table 3). The
donor interest was a standout achievement of presence of these seven widely promoted
the policy, particularly evidenced by the growth opportunities implies that the analysis results
of CSA projects in the country (MoA 2021). The are likely generalizable to African geographies
ACRP successfully influenced the development and policies outside of Tanzania. Therefore, the
of the Phase II ASDP, which included nearly all of model developed here while specific for ASDP II
the climate-resilient topics identified in the and Tanzania is likely widely relevant to
ACRP. In light of this, stakeholders opted to additional geographies and agricultural policies.
conduct an analysis of the ASDP II policy to
determine whether it alone was sufficient to
address climate change adaptation and
resilience in the agricultural sector.

 PAGE 9

Table 3 | ASDP II Priority Investment Areas relevant to climate change.

 Priority Investment Technologies or interventions discussed Target value Five-year
 Area chains or budget
 regions (millions)

 1.1 Land and water Conservation agriculture, reduced tillage, fertilizers, None specified TSh 196,725
 management afforestation, agroforestry, fodder trees, mixed crop- USD 87
 livestock systems, early warning systems

 1.2 Irrigation Irrigation, water harvesting, conservation agriculture, Crops TSh 976,703
 development enhanced soil cover, run-off management, reduced USD 434
 tillage, organic mulching

 1.4 Water for livestock Charco dams, aquaculture ponds and cages, pasture Livestock, TSh 788,782
 and fisheries improvement, seaweed cultivation fisheries USD 351

 1.5 CSA Climate-smart Improved seeds and breeds, early warning systems, None specified TSh 52,331
 agriculture conservation agriculture, weather forecasting, Good USD 23
 Agricultural Practices (GAPs), capacity building

 2.1 Agricultural Conservation agriculture, Good Agricultural All TSh 4,734,493
 extension system PracticeGAPs, integrated pest management, improved USD 2,104
 seeds, fertilizers, improved feeds, vaccines

 4.9 Agricultural Mobile agricultural advisory services, call numbers, early None specified TSh 6,373
 information services warning systems, capacity building USD 2.8

 4.10 Microfinance Access to microcredit, microfinance, farmer None specified TSh 7,067
 cooperatives, warehouse receipt systems USD 3.1

 PAGE 10
3 DEVELOPING A BAYESIAN NETWORK

 A BN is a probabilistic modeling framework which predicts project benefits (e.g., return on
 commonly used in financial and risk analysis, investment) according to implementing risks
 computer science, and natural resource as our starting point (Yet et al. 2016). The
 management because of their flexibility to model’s structure is based on financial project
 represent the world, their ability to formally evaluation methods that describe causal
 integrate qualitative expert opinion and relationships among project activities and
 quantitative data, and their handling of monetized benefits (e.g. increased yield for
 uncertainty (McCann et al. 2006). Essentially, farmers, desired externalities). The model also
 Bayesian networks are directed acyclic graphs includes realities of project implementation in
 (DAGs) that represent the relationships among its estimate of project value, including risks of
 variables as conditional probabilities. The budget overruns or project mismanagement.
 graphical model defines the model’s structure We extended this model to deal specifically
 and our assumptions about how the variables with the climate hazards targeted by the ACRP
 (i.e., nodes) in the model relate to each other. (e.g., droughts, floods, and pests and diseases)
 The arrows between the nodes represent a as well as including valuation of climate
 direct influence of one node on another. Each change mitigation benefits (Yet et al. 2020).
 node is parameterized based on the The resulting model is therefore able to
 probabilities of events given the variable(s) address the goals of productivity, resilience,
 that influence it (i.e., its parents) and and climate change mitigation of ASDP II
 distributions of the outcomes. investment areas.

 For a BN to be used for policy prioritization, it The REAP model elaborates the policy-impact
 must represent the causal relationship pathway with five main components: impacts,
 between policy options and desired outcomes. adoption, costs and budget, risks, and
 The primary goal of the ASDP II is “increased outcomes (Figure 2 and more detailed Figure
 and sustainable productivity of agricultural B1). Each model component and its data
 commodities to improve Tanzanian requirements are described in detail below,
 livelihoods,” while the goal of the ACRP is to and data sources are listed in Table 4.
 mitigate climate risks in the agricultural sector.
 Both policies target the activities of Impact
 smallholder farmers through both on-farm Each Priority Investment Area in the ASDP II
 practices and service provisions to achieve specifies a portfolio of interventions meant to
 these outcomes. The basic policy-outcome increase agricultural productivity and climate
 pathway we modeled is through changes in change resilience in Tanzania (Table 2). The
 smallholder farmer incomes, resilience and monetized productivity impact is calculated as
 greenhouse gas emissions from adoption of the changes in farming household income due
 technologies and/or services promoted by to adopting these interventions multiplied by
 policy options. the number of adopting households over time.
 Potential changes in yields for targeted
 The ASDP II policy options are presented as households were estimated using the Evidence
 Priority Investment Areas. Therefore, we used for Resilience Agriculture (ERA) database,
 an existing probabilistic investment model, which collates data from more than 2,000

 PAGE 11
peer-reviewed research papers that assess the 2015). This distribution of outcomes was then
impact of climate-resilient agricultural used to assess how income changed for
practices on productivity, resilience, and adopters as well as the level of uncertainty
mitigation outcomes at the farm level in Africa. around that change, assuming that in
For each targeted farming system, such as smallholder farming households, the majority
livestock, semi-arid, maize, or a combination of of income is derived from on-farm activities.
systems, the mean and variance of the change
in yields were computed according to best
practices for meta-analysis (Rosenstock et al.

 Financial
 Social Adoption Risk
 Risks

 Adoption Target Costs & Budget
 Rate Beneficiaries

 Project
 Climate Beneficiaries Budget
 Risks Reached Project
 Costs
 Risk of
 Productivity
 Overspend
 Impact
 Total
 Impact
 Discount
 Carbon Rate
 Discounted
 Impact
 Impact
 Outcome
 Impact s
 NPV

 ROI

 Figure 2 | A simplified Bayesian network model of impacts on the Agricultural Sector
 Development Programme Phase II Priority Investments

In addition to changes in agricultural possible values per ton of carbon dioxide to
productivity due to the implementation of account for the social costs of carbon and
policy options, we also estimated climate uncertainty in the future carbon markets
impacts in the form of carbon dioxide (World Bank Group 2017).
equivalents and monetary benefits. We
determined changes in the greenhouse gas Adoption
balance at the farm level for the technologies The number of adopting households over the
and targeted systems identified for each lifetime of the ASDP II investment was
priority investment area in the ASDP II using modeled using the Bass model (Yet et al. 2020,
the Ex-Ante Carbon-balance Tool (FAO 2019). Bass 1969). The Bass model estimates the
Resulting changes in carbon emissions were diffusion of innovations in a society and
then monetized using a distribution of approximates the adopters at each time step,

 PAGE 12
which in this case is a year. The model includes same mean as the project budget, but a higher
three key parameters: the saturated number variance to account for fluctuating spending
of adopters, a coefficient of innovation (P), and across project years. If costs exceed the
a coefficient of imitation (Q). The saturated project budget, the monetized benefits are
number of adopters counts the target reduced by this amount.
beneficiaries. To calculate the potential
number of target beneficiaries, we divided the Risks
total budget of the investment in the ASDP II The model integrates three major risk types:
by an estimated cost-per-beneficiary in US$ climate, social, and financial risks. Climate risks
per household based on similar agricultural included droughts, floods or heavy rainfall,
development projects (World Bank 2019b). and outbreaks of pests and disease, which are
The coefficients of innovation and imitation the main climate shocks that impact
were assigned according to a typology of agricultural systems. For each climate risk, the
anticipated functional responses of adoption frequency, or likelihood of occurrence, was
(Annex C). For example, projects that can estimated using the historic frequency of
quickly and directly reach numerous target shocks that were significant enough to impact
beneficiaries will have a high coefficient of agricultural productivity on a national scale. In
innovation, whereas those that take longer to Tanzania, significant droughts occur about
start like infrastructure projects will have a once every five years, meaning that the
lower coefficient of innovation. Technologies likelihood of occurrence in any year is
or practices that can be transmitted approximately 20% (Arce & Caballero 2015).
horizontally between potential beneficiaries Pest outbreaks, including novel pests such as
receive a high coefficient of imitation. the Fall Army Worm, befall Tanzania with a
Technologies such as agricultural insurance, similar frequency, while heavy rain events that
digital extension, improved seeds, and other cause large-scale disruption tend to be less
‘single change’ options are thought to have a frequent, happening about once in 20 years.
high likelihood of indirect adoption, whereas
those that involve many changes, such as If a climate shock occurs, smallholder farmers
conservation agriculture or a system of rice will be affected. The risk impact was modeled
intensification, have lower coefficients of differentially for adopters and non-adopters of
imitation. Varying these parameters affects the the policy’s key interventions, with a uniform
adoption curve, the number of beneficiaries distribution of potential agricultural losses
each year, and hence the policy’s overall between 0%, or no loss, and 100%, or total
impact. loss. If the technologies or interventions
 strengthened resilience to the climate shock,
Costs and budget the impact was lessened; for instance, the
Two main financial factors affect an adoption of drought-tolerant crop varieties
investment’s impact: budget and costs. The should reduce the impact of a drought on
project’s budget is the amount of money to be yields. If not, the risk impact was the same
spent per year as stated in the ASDP II. For between adopters and non-adopters; for
simplicity, we assumed that annual spending example, participation in an irrigation scheme
was the same across the five-year duration of would not directly decrease vulnerability to a
each investment, although more complex pest outbreak. Risk impacts were assigned to
budgeting cycles could be accommodated. each policy option according to a typology
Annual costs were modeled as having the based on the magnitude of impact and the
 certainty around that impact (Annex D).

 PAGE 13
Social risks can also reduce the impact of investment (ROI). In each year of the policy
policy or investment options. We included implementation cycle, accrued monetized
three main types of social risk in our model: impact is reduced by any project overspend.
political instability, social conflict, and poor Net returns (R) is calculated as current year’s
project governance. Political instability, such as net impact (impact - costs in that year)
post-election violence, and social conflict, such discounted using a distribution of possible
as violent extremism or tensions between discount rates (d).
farmers and pastoralists, were modeled as
slowing the rate of adoption of policy or ( − )
 =
project interventions due to displacement or (1 + )
uncertainty about the future. Poor project
governance, for example because of At the end of the policy implementation cycle
corruption, was modeled as diminishing the (t= 5 years), NPV is calculated as cumulative
total number of beneficiaries that could be discounted net returns and the ROI is
reached within the investment’s budget. We calculated as the ratio of the cumulative
arrived at the frequency of these risks using discounted benefits (NPV) to the cumulative
data on political instability and social conflict in costs.
 5
Tanzania as well as the relative performance
 = ∑
of Tanzania on scores for Rule of Law and
 =1
Control of Corruption in the Worldwide
Governance Indicators (Kaufmann et al. 2010).
 =
 ∑5 =1
Finally, we modeled financial risk that might
constrict the project’s overall budget, such as The percent chance of producing a positive
altered donor objectives, donor responses to NPV or ROI for each scenario is also
political circumstances, or changing national calculated.
political priorities. For example, in 2021, the
United Kingdom dramatically curtailed official Model implementation
development assistance (Sample 2021), The model was developed and implemented
disrupting funding for new and ongoing using AgenaRisk software (AgenaRisk 2020).
projects, and in 2016, because of the disputed Models were parameterized for each of the
Zanzibar election results, the United States identified ASDP II climate-relevant Priority
government reduced development assistance Investment areas using a combination of
to Tanzania (BBC 2016). The risk of budget cuts external data sources and expert opinion
was modeled as a normal distribution with a (Table 4). The models were run for a five-year
mean of X. If a budget cut happens, the investment cycle as described in the ASDP II
project’s budget drops by an amount also (Figure B2).
modeled with a normal distribution to account
for uncertainty in potential budget cuts. Each policy option was evaluated in four
Project costs were not automatically reduced, different risk scenarios. The first scenario
increasing the risk of overspending. lacked any risks so we could compare the risk-
 explicit policy evaluation with conventional
 analyses that do not consider risks. We also
Outcomes evaluated each ASDP II option in scenarios
The REAP Model evaluates policy options in considering climate risks only, social and
terms of net present value (NPV) and return on financial risks only, and finally, with all risks.

 PAGE 14
Stakeholder Engagement usefulness, adequacy, and usability of the
In order to assess the utility of both the model and its results, as well as about any
modelling approach and the REAP outputs for conceptual or informational gaps. Of the
prioritizing agricultural policy options, we respondents, 50% were men and 50% women.
engaged stakeholders directly involved in the Half of respondents were involved in
process of formulating the Phase II Agricultural agriculture and climate change research, 20%
Climate Resilience Plan in Tanzania. These were government officials, and 30% acted as
stakeholders participated in the December donors or implementors in the development
2019 ACRP II workshop in Dar es Salaam, and sector. All feedback was transcribed and coded
then were engaged via survey instruments for analysis of key themes related to the
upon model completion (Annex E). We usefulness, adequacy, and usability of REAP.
requested detailed feedback from 15
stakeholders, representing the government,
development, research, and the private sector.
Stakeholders were asked about the

 Photo: S. Kilungu (CCAFS)

 PAGE 15
Table 4 | Parameters and data sources for the REAP Model

 Model Parameter Data type Data Source

 Costs and budget

 Project total budget Fixed integer ASDP II

 Project yearly budget Truncated normal distribution ASDP II

 Cost per beneficiary Truncated normal distribution World Bank CSAIPs (World Bank 2019b)

 Evaluation period Fixed integer ASDP II

 Yearly cost Truncated normal distribution ASDP II

 Discount rate Truncated normal distribution World Bank CSAIPs (World Bank 2019b)

 Adoption

 Total targeted beneficiaries Truncated normal distribution Calculated

 Coefficient of innovation Truncated normal distribution Project typologies (Annex B)

 Coefficient of imitation Truncated normal distribution Project typologies (Annex B)

 Impact
 Economic Lives of Smallholder Farmers (Rapsomanikis
 Baseline income Truncated normal distribution
 2015).

 Relative impact Normal distribution ERA

 Greenhouse gas balance Normal distribution ExACT and literature

 Carbon price Truncated normal distribution Social Cost of Carbon (World Bank Group 2017).

 Risks

 Risk of drought Truncated normal distribution Acre & Caballero 2015

 Impact of drought Uniform distribution Risk typologies (Annex C)

 Risk of floods or heavy rainfall Truncated normal distribution Acre & Caballero 2015

 Impact of floods or heavy rain Uniform distribution Risk typologies (Annex C)

 Risk of pests or diseases Truncated normal distribution Acre & Caballero 2015

 Impact of pests or diseases Uniform distribution Risk typologies (Annex C)

 Risk of budget cuts Truncated normal distribution Expert opinion

 Risk of poor governance Truncated normal distribution Worldwide Governance Indicators

 Risk of conflict Truncated normal distribution Worldwide Governance Indicators

 Risk of political instability Truncated normal distribution Worldwide Governance Indicators

 PAGE 16
4 PERFORMANCE OF THE ASDP II PRIORITY INVESTMENTS

 The model predicts all ASDP II priority agricultural information services or increasing
 investment areas will have positive mean ROIs access to credit and microfinancing have wide
 across all risk scenarios. Given their total distributions in their ROIs, whereas the ROIs of
 budgets, estimated number of beneficiaries, costly projects with more robust benefits for
 and estimated impact per beneficiary, all farmers such as irrigation development or
 investments are projected to increase enhancing the water resources for livestock
 agricultural productivity for smallholder farmers have much narrower distributions. However, no
 in Tanzania on average. However, the investment has zero probability of a negative
 investments differ significantly in the outcome (ROI < 0), and the investment that is
 distribution of the potential ROIs (Figure 3). least likely to yield a negative result is
 Investments with a low cost per beneficiary and sustainable land and water management
 a relatively small impact per beneficiary such as (Table 5).

 Figure 3. | Distribution of return on investment outcomes from ASDP II investments under
 scenarios with and without climate risks

 PAGE 17
Table 5 | ASDP II Investment performance with and without climate risk

 Investment Budget Target Cost per Change in ROI, ROI, with Chance of
 (M USDs) benefici- beneficiary beneficiary no climate a positive
 aries (USD) income (%) risks risks NPV
 (%) (%) (%)

 1.1 Land & water 87 320,000 275 40 9.9 9.5 95.0
 management

 1.2 Irrigation 434 868,000 500 45 4.3 4.8 96.6
 development

 1.4 Water for 351 609,000 575 55 4.0 3.7 89.0
 livestock & fisheries

 1.5 CSA 23 115,000 200 30 10.5 11.1 91.5

 2.1 Agricultural 2,104 5,000,000 421 20 4.0 5.0 85.5
 extension systems

 4.9 Agricultural 2.8 47,000 60 15 18.5 30.1 82.5
 information services

 4.10 Microfinance 3.1 27,000 115 20 16.8 20.5 88.8
 services

We assessed the performance of investments All of the modeled options are likely to have
for agricultural climate resilience by comparing positive returns. The chances of a positive NPV
the ROI with and without considering climate exceed 80% in all cases. These results contrast
risks. Of the seven investments modeled, five with investments modeled in a similar approach
see an increased ROI under the climate risk for Mali and Cote d’Ivoire, where multiple
scenario compared to the scenario with no investments have chances of NPV below 50%
risks. Investment in agricultural information (World Bank 2019c, World Bank 2019d). The
services shows the largest jump in its ROI with results found here can be explained by the
climate risks. In the absence of climate risks, the favorable assumptions used to run the
use of weather or planting date information is simulations in Tanzania. For example, the cost
unlikely to boost the performance of per beneficiary for an agricultural information
smallholder farmers significantly. However, if service project is only 60 USD and has the
agricultural information systems can accurately potential to change incomes by 15% on average.
inform farmers of seasonal rainfall amounts, This would be a highly efficient and effective
likely planting dates, or impending pest program by any standard. Also, the Mali and
outbreaks, the benefits of using such systems Cote d’Ivoire investment plans were much more
can be dramatic. The ROIs of other investments, specific about how many beneficiaries were to
including the development of irrigation be targeted, in what regions and for which value
infrastructure, CSA, improved agricultural chains. The lack of specificity in Tanzania’s ASDP
extension systems, and broader access to credit II required many more assumptions to be made
and microfinance services, also rise under the by the modeling team, potentially resulting in
climate risk scenario. more favorable assumptions. The leverage
 assumptions have on the results highlights the
 importance of credible and quality input data.

 PAGE 18
5 STAKEHOLDER FEEDBACK

 Photo: C. Schubert (CCAFS)

 Stakeholder perceptions of the modeling generally comprehensive and allowed for the
 approach and results were the primary comparison of diverse options related to
 measuring stick, given our design objective was agriculture and climate change adaptation. The
 to create a useful and relevant model that key advantage of the REAP model according to
 informs and prioritizes policy. Overall, the 15 stakeholders is the inclusion of risks, particularly
 stakeholders who provided feedback on the social and political risks to policy and project
 modeling process and results found the outputs implementation. Indeed, one development
 of the REAP model valuable for prioritizing ASDP practitioner responded as follows:
 II policy options. All stakeholders stated that
 they felt the results were useful for policy “Political and policy instability [are main
 prioritization, although 25% of respondents components] because these two ‘big fish’ do
 qualified their statements by saying, for significantly affect any investment, especially
 instance, “yes and no” or “possibly yes”. demoralizing donors and/or implementing project
 Stakeholders stated that the model was partners and often the beneficiaries, the farmers,
 too.”

 PAGE 19
This stakeholder was referring to the impact of in climate parameters are also important to
political instability both within Tanzania and model.
within donor countries on the flow of funding
for agricultural development. The stakeholder When asked how the model could be improved
pointed out that Tanzania is no longer for prioritizing climate change and agricultural
considered a priority country for the United policies, several distinct directions emerged
States Government’s Feed the Future Initiative. (Table 5). One is to model markets by including
In addition, several stakeholders stressed the elements such as market availability, labor, value
importance of macroeconomic risks, such as chains, farm gate pricing, economic shocks, and
price shocks or a lack of access to export macroeconomic policy. A second emergent
markets, and suggested that these could be direction involves increasing the model’s social
included in future versions of the model. complexity by disaggregating beneficiaries by
 gender or other social dimensions, adding
Stakeholders were split as to whether the REAP context specificity in outcomes, and including
model is adequate to assess the climate more complicated adoption models that also
resilience benefits of the ASDP II policy options. allowed for disadoption of interventions. The final
Approximately 25% of respondents felt the suggestion that emerged from stakeholder
model was adequate, 25% felt it is not, and the feedback is to include non-economic outcomes,
remaining 50% felt the model falls somewhere particularly those with strong relevance to
in between. Some stakeholders felt that the climate change resilience. A food systems
model sufficiently addresses climate resilience researcher shared the following advice:
because the policy options modeled strengthen
climate resilience and show changes in NPV and “ Financial impacts alone may not necessarily be
ROI with and without climate risks. Others felt helpful in understanding smallholder subsistence
that the model lacks a “clear definition of farming systems. There are other impacts that are
resilience” and a “link between policy and non-monetary, linked to livelihoods that promote
enhanced resilience”. While our approach to resilience.”
resilience focused on how policy options change Suggested outcomes included impacts on
economic outcomes in the face of shocks, some ecosystem health and services, natural resource
stakeholders pointed out that gradual changes bases, and the adaptive capacity of
 beneficiaries.

 Table 6 | Perception of model parameters by stakeholders. In other words, what should be
 retained, expanded or removed from the model.

 Included Not included

 Retain or Risk assessment, uncertainty, Non-economic outcomes, trade-offs,
 add economic outcomes, change in NPV and ROI, disadoption, gender, economic shocks, national
 Stakeholder perception

 mitigation, political instability, benefits to budget cycles, market availability, capacity
 farmers, yield building, gradual changes, value chains, labor,
 ecosystem services and natural resources.

 Remove Mitigation, carbon costs, greenhouse gas
 emissions

 PAGE 20
The number of parameters, complexity of For the model to be useful for policy
relationships between policy and impact, use prioritization, it may be important to increase
of quantitative distributions for model the usability of either the model interface
parameters, and presentation of outputs itself, or the way that stakeholders interact
across multiple scenarios including uncertainty with the model outputs. Finally, several
led some stakeholders to feel that model was stakeholders had concerns about the data
difficult to understand. For example, a sources used to parameterize the model.
program officer at a donor organization Although most felt the data choices were
shared the following reflection: adequate, there was a call to harmonize data
 inputs with data collected by national data
“I certainly think the model is useful and could be collection systems in Tanzania to increase the
useful in the work of my office. However, it is not usefulness of the model, particularly for future
intuitive to me as someone who is not a policy prioritization exercises.
researcher or policy maker.”

 PAGE 21

 Photo:Photo:
 C. Schubert (CCAFS)
 C. Schubert (CCAFS)
6 RESEARCHER REFLECTIONS
 REAP provided an opportunity to adapt and field adoption are more difficult to reasonably
 test a BN-based approach to policy constrain for options with high costs and diffuse
 prioritization. The application to an existing benefits, such as large-scale infrastructure
 policy in collaboration with stakeholders heavily projects or resource management schemes,
 vested in the policy processes generated new amongst other challenges to ensure plausible
 insights into its relevance and how to improve. comparability.
 Six reflections emerged.

 MIND THE RISK. Including risks in the REAP Lesson 2: Bayesian Networks may not be
 model alters modeling outcomes and hence appropriate to model the entire gamut of policy
 could affect prioritization. The estimated NPV options affecting inclusive agriculture
 and ROI of all investments changed for each risk transformation.
 scenario, although the relative ranking of the
 investments by mean ROI did not significantly
 differ between risk scenarios. We believe this EXPERT ELICITATION. Expert elicitation of the
 result is largely due to the lack of specificity in model structure and the parameter values is
 the description of the ASDP II investments, central to using BNs, especially in data-scarce
 which overlapped significantly in terms of environments. Workshops lend credibility to the
 technologies mentioned and agroecosystems process and buy-in to the modeling effort in
 targeted, so the largest differences among the addition to providing expert judgments. In order
 investments were their overall budgets and to provide reasonable approximations of
 costs per beneficiary. Regardless of cause, the parameter distributions, experts must be
 leverage that including risks has on the results “calibrated” to mitigate the known bias that
 and the prioritization highlights an existential arise from this practice such as overconfidence,
 crisis for policy makers and investors. Risks in bandwagoning, available heuristic, and more.
 general, not to mention climate risks, are rarely Under COVID-19 restrictions, discussions
 if ever considered in agricultural policy typically held in person were moved online. This
 prioritization. presented challenges under remote
 participation scenarios because of internet
 connections, lack of participation, and
 Lesson 1: REAP results suggest that careful distraction. Unfortunately tools such as online
 consideration of the risks needs to become training and surveys were relatively ineffective
 commonplace going forward, irrespective of the in calibrating stakeholders.
 prioritization framework used.

 Lesson 3: Unguided expert elicitation is unlikely to
 APPLES TO APPLES. Our model allows a result in usable estimates of model parameters.
 decision maker to compare diverse common
 agricultural and climate change policy options
 by assuming economic benefits accrue to GARBAGE IN, GARBAGE OUT. The model
 smallholder farmers. This approach works well provided reasonable estimates of impact, such
 for policy options that directly target farm-level as ROIs between 4% and 30% across a diverse
 changes. Key assumptions about the number of array of policy options. Variation among the
 beneficiaries, scale of impact and rate of investments was driven by assumptions and

 PAGE 22
data availability pertaining to impacts, adoption, components of the model for their liking such as
and risks. For example, investments that reach a the risks that are modeled, the distribution of
large number of beneficiaries such as climate impacts, or the inclusion of carbon benefits.
information tend to have the highest ROIs. Non-structural changes can be accommodated
There are often multiple data sources to select more readily.
from; in some cases the globally accepted data
are not the nationally expected data.
Furthermore, experts may also have dissenting Lesson 5: The bar for entry needs to be lowered to
opinions. Bayesian Networks illustrate data and increase use, which suggests the opportunity to
processes transparently helping to mitigate develop a Web-based tool where the model could
concerns over which data were used. However, be adapted based on drag and dropped selections
discrepancies do arise, sometimes after and default primary data could be loaded based
modeling and seeing the results. on selected geographies (i.e., from the Adaptation
 Atlas) but modifiable to users inputs.

Lesson 4: Assumptions and data need to be
developed in collaboration with policy makers to MULTIPLE USE CASES. In REAP, we used BN to
ensure the credibility of the results. assess existing policy options for a specific
 outcome - increased climate change resilience
 of the agricultural sector. Through our
USABILITY IS KEY. Though typically conducted engagement with decision-makers in Tanzania,
using participatory methods, our approach several use cases of policy prioritization models
requires significant time investments by and BNs in particular emerged. In addition to
technical and domain experts to develop, policy assessment, funding prioritization and
parameterize, run, and refine models. Models policy formulation are two other key needs. The
require a software platform that may not be outcomes modeled or weighting across multiple
available to all users. More complex models outcomes, as well as the scale of analysis can
demand large amounts of memory and change in each specific use case. However, if the
computing resources, limiting the ability to run core impact pathway remains the same (in this
scenarios in real-time with stakeholders. This case, impact is accrued through changes in
means that the BN approach, in its current smallholder farmer behavior), the model can be
format, may be challenging to practically adapted to different use cases.
implement at scale with many iterations.
However, the REAP experience when added to
previous work further lends evidence that the Lesson 6: Multiple use cases demand a flexible
core structure of the policy-impact pathways is modeling framework, but can be accomodated if
fairly consistent across contexts. Stakeholders the core impact pathway remains the same .
want to adapt or change relatively small

 PAGE 23
7 CONCLUSIONS
 At the outset of the Grand Challenge, we context. However, some stakeholders felt that
 hypothesized that using BNs would improve examining change in ROI with climate shocks
 policy prioritization by (i) allowing stakeholders was inadequate for assessing resilience
 to compare diverse policy options despite data benefits, and others wanted to see inclusion of
 scarcity, (ii) increase the utility of prioritization market and economic shocks suggesting a need
 results by incorporating stochastic social and to increase the number (currently capped at six)
 climate risks into the model and (iii) increase and change the portfolio of shocks modeled in
 acceptance of model results through the future iterations
 utilization of participatory modeling processes.
 REAP was largely able to achieve these goals. Acceptance and use of outputs for policy
 The REAP model allowed stakeholders to prioritization remains a key challenge for all
 directly compare aggregated agricultural modeling approaches. For REAP, many of the
 productivity, resilience, and mitigation impacts participatory model design, parameter
 of ASDP II options ranging from promoting elicitation, and output validation processes
 climate-smart agriculture, to developing were severely limited due to COVID19 safety
 irrigation infrastructure, to improving precautions and internal political reasons in
 agricultural information services and access to Tanzania. In the absence of face-to-face
 microfinance for smallholder farmers. workshops, overcoming the inherent biases in
 Stakeholders generally felt that the model was human estimation of parameters is difficult.
 adequate for this task, but some wanted to see Many stakeholders felt that the model and
 non-economic impacts, results stratified by results were highly technical and thus difficult to
 social groupings, or inclusion of more social use in a policy prioritization process.
 policy options.
 In conclusion, BNs provided a robust and
 The inclusion of risk into policy prioritization flexible modeling approach for prioritizing
 was seen as a key advantage of the REAP agricultural policies. Further development of the
 approach, allowing stakeholders to get a more model to include non-economic impacts of
 realistic sense of potential policy impacts. agricultural policies would expand its
 Including social and financial risks always application to prioritization contexts,
 lowered the ROI of ASDP II investments, but particularly when multiple development goals
 climate risks could sometimes increase the ROI are desired. Creating an accessible web-based
 if the investment increased resilience to that interface for stakeholders to design,
 particular shock. Stakeholders especially parameterize, and analyze their results could
 appreciated the inclusion of political risks as also increase the usability and prime this
 many felt this was important in the Tanzanian approach to go to scale.

 PAGE 24
 Photo: CCAFS
REFERENCES
 Acre C and J Caballero. 2015. Tanzania: Agricultural Science 319, 607-610.
 Sector Risk Assessment. World Bank Lunhunga PM, AL Kijazi, L Chang’a, A Kondowe, H
 Group, Washington, DC. Ng’ongolo and H Mtongori. 2018. Climate
 https://openknowledge.worldbank.org/handle/10 change projections for Tanzania based on high-
 986/22277 resolution regional climate models from the
 AgenaRisk. 2020. AgenaRisk: Bayesian network and Coordinated Regional Climate Downscaling
 simulation software for risk analysis and Experiment (CORDEX)-Africa. Frontiers in
 support. Available: http://www.agenarisk.com/ Environmental Science.
 Bass F. 1969. A new product growth model for https://doi.org/10.3389/fenvs.2018.00122
 consumer durables. Management Science 15(5). McCann RK, BG Marcot and R Ellis. 2006. Bayesian
 https://doi.org/10.1287/mnsc.15.5.215 belief networks: Applications in ecology
 BBC. (2016 March 29). US pulls Tanzanian aid worth and natural resource management. Canadian
 $470m over Zanzibar vote. BBC News. Journal of Forest Research
 Chuwa A.1st December 2020. Key findings on the 36(12). https://doi.org/10.1139/x06-238
 National Sample Census of Agriculture, Meynard CN, M Lecoq, MP Chapuis and C Piou. 2020.
 Livestock, and Fisheries for Agricultural year On the relative role of climate change
 2019/20. Press Release. United Republic of and management in the current desert locust
 Tanzania National Bureau of Statistics. Mwanza, outbreak in East Africa. Global Change Biology 26:
 Tanzania. 3753-3755.
 Conway D, E Allison, R Felstead, and M Goulden. Ministry of Agriculture. 2021. Proceedings of the
 2005. Rainfall variability in East Africa: Consultative Meeting for Developing the
 Implications for natural resource management Second Phase of Five-Year Agriculture Climate
 and livelihoods. Philosophical Transactions of the Resilient Plan (ACRP II, 2020-2025). Ministry of
 Royal Society A 363: 49-54. Agriculture, United Republic of Tanzania, Dar es
 Division of Environment. 2012. National Climate Salaam, Tanzania.
 Change Strategy. Vice President’s Office, Ministry of Agriculture, Food Security and
 United Republic of Tanzania, Dar es Salaam, Cooperatives. 2013. National Agriculture Policy.
 Tanzania. United Republic of Tanzania, Dar es Salaam,
 FAO. 2016. AQUASTAT Country Profile - United Tanzania.
 Republic of Tanzania. Food and Agriculture Ministry of Agriculture, Food Security and
 Organization of the United Nations. Rome, Italy. Cooperatives. 2013. Tanzania Agriculture Climate
 http://www.fao.org/3/i9836en/I9836EN.pdf Resilience Plan 2014-2019. United Republic of
 FAO. 2019. EX-Ante Carbon-balance Tool | EX-ACT. Tanzania, Dar es Salaam, Tanzania.
 Food and Agriculture Organization of the Ministry of Agriculture, Food Security and
 United Nations. Rome, Italy. Cooperatives and Vice President’s Office. 2015.
 http://www.fao.org/in-action/epic/ex-act- Tanzania Climate-Smart Agriculture Programme
 tool/suite-of-tools/ex-act/en/ 2015-2025. United Republic of Tanzania. Dar es
 Kaufmann D, A Kraay, and M Mastruzzi. 2010. The Salaam, Tanzania.
 Worldwide Governance Indicators: Methodology Ministry of Agriculture, Livestock and Fisheries. 2017.
 and Analytical Issues. World Bank Policy Research National Climate-Smart Agriculture
 Working PAper No. 5430. World Bank Group, Guideline. United Republic of Tanzania. Dar es
 Washington, DC. Available at SSRN: Salaam, Tanzania.
 https://ssrn.com/abstract=1682130 Palacios-Lopez A, L Christiaensen and T Kilic. 2017.
 Lobell DB, et al. 2008. Prioritizing Climate Change How much of the labor in African
 Adaptation Needs for Food Security in 2030.

 PAGE 25

Photo: C. Pye-Smith (ICRAF)
You can also read