PROCEEDINGS OF SPIE Image data-driven thermal dose prediction for microwave ablation therapy - Biomedical Modeling Laboratory
←
→
Page content transcription
If your browser does not render page correctly, please read the page content below
PROCEEDINGS OF SPIE
 SPIEDigitalLibrary.org/conference-proceedings-of-spie

 Image data-driven thermal dose
 prediction for microwave ablation
 therapy

 Ding, Alice, Heiselman, Jon, Miga, Michael

 Alice K. Ding, Jon S. Heiselman, Michael I. Miga, "Image data-driven thermal
 dose prediction for microwave ablation therapy," Proc. SPIE 11315, Medical
 Imaging 2020: Image-Guided Procedures, Robotic Interventions, and
 Modeling, 113151G (16 March 2020); doi: 10.1117/12.2550550

 Event: SPIE Medical Imaging, 2020, Houston, Texas, United States

Downloaded From: https://www.spiedigitallibrary.org/conference-proceedings-of-spie on 29 Jan 2021 Terms of Use: https://www.spiedigitallibrary.org/terms-of-use
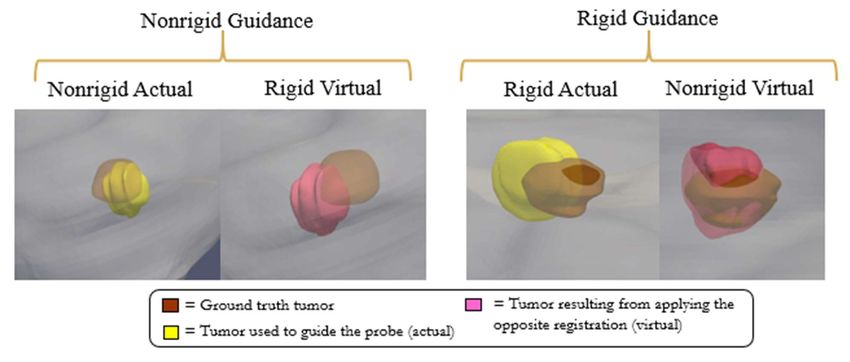
Image Data-Driven Thermal Dose Prediction for Microwave Ablation
 Therapy
 Alice K. Ding1,2,3, Jon S. Heiselman1,3, Michael I. Miga1,3,4,5,6
 1
 Vanderbilt Institute for Surgery and Engineering, Nashville, TN USA; 2 SyBBURE Searle Undergraduate Research
 Program; 3 Vanderbilt University, Department of Biomedical Engineering, Nashville, TN USA; 4 Vanderbilt University
 Medical Center, Department of Radiology and Radiological Sciences, Nashville, TN USA; 5 Vanderbilt University
 Medical Center, Department of Neurological Surgery, Nashville, TN USA; 6 Vanderbilt University Medical Center,
 Department of Otolaryngology, Nashville, TN USA

 ABSTRACT
 Because many patients diagnosed with hepatocellular carcinoma are not eligible for liver transplantation or resection, there
 has been a great deal of interest in developing locoregional therapies such as thermal ablation. One such thermal ablation
 therapy is microwave ablation. While benefits have been gained in the management of disease, local recurrence in
 locoregional therapies is still very common and represents a significant problem. One suggested factor is the presence of
 soft tissue deformation which is thought to compromise image-to-physical targeting of diseased tissue. This work focuses
 on presenting a hepatic phantom with an embedded mock tumor target and studying the effects of deformation on ablation
 when using image-to-physical rigid and non-rigid alignment approaches. While being deformable, the hepatic phantom
 was designed to enable optical visibility of the ablation zone with target lesion visibility in CT images post-treatment using
 albumin, agar, formaldehyde, and water constituents. Additionally, a physical mock tumor target phantom was embedded
 in the hepatic liver phantom and contained CT contrast agent for the designation of lesion prior to mock intervention.
 Using this phantom, CT scans and sparse-surface data were collected to perform rigid and nonrigid registrations. The
 registrations allowed for the navigation of the ablation probe to the center of the mock lesions using a custom-built
 guidance system; this was then followed by microwave ablation treatments. Approximately 96.8% of the mock lesion was
 ablated using nonrigid registration to guide delivery while none of the mock lesion was ablated using the rigid alignment
 for guidance, i.e. a completely missed target. This preliminary data demonstrates an improvement in the accuracy of target
 ablation using a guidance system that factors in soft tissue deformation.

 Keywords: Microwave ablation, phantom development, deformation, image-guided surgery, liver, registration

 1. INTRODUCTION

 Liver transplant and resection are currently the preferred methods of treating hepatocellular carcinoma; however, many
 patients are not candidates for such treatment methods. As a result, there has been considerable focus on loco-regional
 therapies for treatment such as thermal therapies. In particular, microwave ablation (MWA) has many advantages such as
 having the ability to deposit power to a large spatial extent resulting in a more uniform ablation of tumor lesions as well
 as the ability to ablate up to and around large vessels [1]. While radiofrequency ablation (RFA) is another more common
 thermal ablation technique, there has been some suggestions that RFA has increased recurrence rate compared to MWA
 [2].
 Currently, image-guided ablation procedures have assisted in probe placement using interventional imaging techniques
 (ultrasound, biplanar fluoroscopy, CT), optical tracking, and image-to-physical registration methods. However, the
 alignment of pre-procedural imaging to the intraprocedural environment can be confounded by soft tissue deformations
 [3]. This could result in incomplete treatment and local recurrences from inaccurate ablations [4]. Soft tissue deformation
 correction approaches using image-to-physical nonrigid registration methods have been presented previously but have
 largely been evaluated retrospectively. For example, in a retrospective study [5], nonrigid registration methods were shown
 to improve ablation targeting for more accurate realization of thermal dose planning.
 The purpose of this work will be to use a hepatic phantom with clinically relevant features to determine the effects of
 factoring soft tissue deformation in prospectively guiding the MWA treatment and to quantitatively evaluate the potential

 Medical Imaging 2020: Image-Guided Procedures, Robotic Interventions, and Modeling, edited by
 Baowei Fei, Cristian A. Linte, Proc. of SPIE Vol. 11315, 113151G · © 2020 SPIE
 CCC code: 1605-7422/20/$21 · doi: 10.1117/12.2550550

 Proc. of SPIE Vol. 11315 113151G-1
Downloaded From: https://www.spiedigitallibrary.org/conference-proceedings-of-spie on 29 Jan 2021
Terms of Use: https://www.spiedigitallibrary.org/terms-of-use
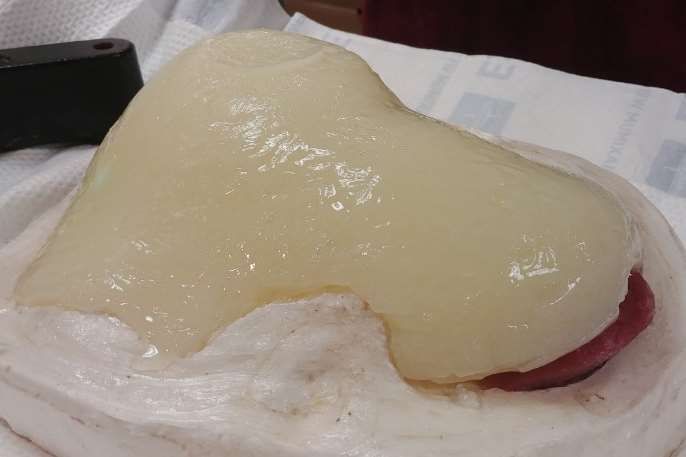
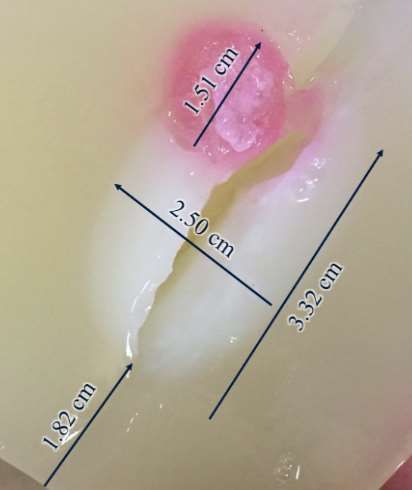
treatment efficacy of the predicted MWA zone at a specific target location through identifying the overlap between the
 navigated ablation zone and mock therapeutic targets.

 2. METHODS

 2.1 Development of Hepatic Phantom

 The necessary requirements for the hepatic phantom were deformability similar to its in vivo counterpart, optical visibility
 of an ablation zone within gross pathology, and the ability to depict a target lesion in CT images. The hepatic phantom
 was developed using water, agar powder (Thermo Fischer Scientific, Waltham, MA), albumin powder (Sigma-Aldrich, St.
 Louis, MO), 37 % formaldehyde solution (Thermo Fischer Scientific, Waltham, MA), and barium sulfate powder (Thermo
 Fischer Scientific, Waltham, MA). An egg white solution was created through a combination of 10 wt. % albumin powder
 and water. An agar-formaldehyde solution was also created from 1 wt. % agar powder and water by heating to a boil in
 the microwave, and then adding 0.002 wt. % formaldehyde solution. Equal amounts of both solutions were combined once
 the agar-formaldehyde solution was cooled to less than 56°C in order to prevent the albumin protein from denaturing. This
 denaturing property later will be used for optical visibility of the ablation zone. This dilution yielded an agar-albumin
 solution of approximately 0.5 wt. % agar, 5 wt. % albumin, and 0.001 wt. % formaldehyde. The agar-albumin solution
 was then poured into an acrylic box mold, as well as a plaster hepatic mold containing five multimodal fiducial markers
 (IZI Medical, Owlings Mills, MD) around its base and two targets suspended within the liver using a thread. Both gels
 were allowed to set for at least two hours.

 In the hepatic phantom mold, the two suspended phantom mock tumor targets were created using the same protocol above
 with additions of 0.1 wt. % of barium sulfate powder as CT contrast and a small volume of food dye for optical visibility.
 The phantom targets were poured into a spherical mold to create a standard shape. Each were then suspended distant from
 each other but in the same lobe of the liver. Figure 1a depicts the developed hepatic phantom, Figure 1b demonstrates an
 example of a mock lesion and an ablation zone annotated with dimensions for a comparison in size, and Figure 1c shows
 a CT slice featuring a target lesion contrasted by barium sulfate (circled) and a multimodal fiducial (boxed).

 a b c
 Figure 1. (a) The hepatic phantom made up of 0.5 wt. % agar powder, water, and albumin in its plaster mold. (b) The dimensions of
 the ablation zone after the phantom was treated with MWA. The pink (a result of using food dye for better visibility) area in the image
 is the target tumor location. (c) A CT slice of the phantom with the target (circled) and a multimodal fiducial (boxed) visible.

 2.2 Registration Process

 Initial CT imaging data of the hepatic phantom was taken for planning and registration purposes (Figure 2a). Once
 acquired, a planning utility was employed to segment the liver and mock tumors. Upon completion, the liver phantom was
 removed from its plaster mold and a systematic deformation similar to that experienced in surgical cases was imparted on
 the phantom to simulate the presence of intraprocedural shape change (Figure 2b). To simulate image guided ablation in
 the open surgical environment, an optically tracked stylus was used to collect sparse anterior surface data. Often for open
 procedures, only the anterior surface can be digitized and the liver typically experiences significant shape change from
 mobilization and perihepatic packing. Image-to-physical registration began with a salient feature weighted iterative closest

 Proc. of SPIE Vol. 11315 113151G-2
Downloaded From: https://www.spiedigitallibrary.org/conference-proceedings-of-spie on 29 Jan 2021
Terms of Use: https://www.spiedigitallibrary.org/terms-of-use
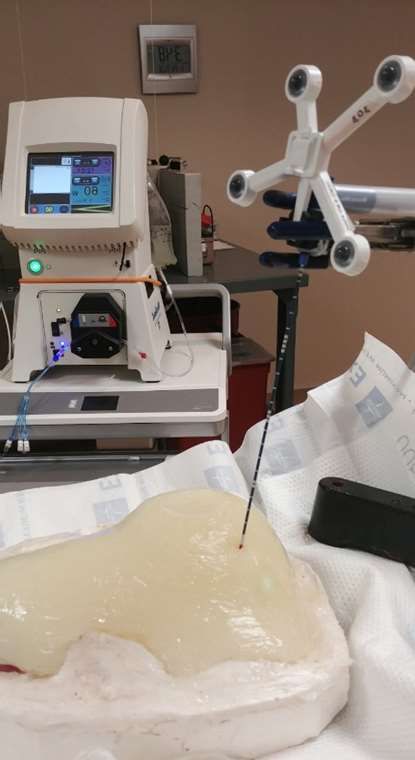
point rigid registration [6] followed by a linearized iterative boundary reconstruction nonrigid registration method that
 accounts for soft tissue deformation [7]. Point data was also collected for each centroid of the multimodal fiducials using
 the optically tracked stylus.

 With registration complete, the guidance system was used to direct a tracked MW ablation probe to the center of a lesion
 as designated on the guidance display using (1) rigid and (2) nonrigid registration methods for the two mock tumor targets
 embedded inside the phantom. Point data were also collected for the final probe placement where the window of the probe
 was positioned (Figure 2c). The locations were then treated with a 915 MHz MWA probe (ST antenna, Perseon, Salt Lake
 City, Utah) for 15 minutes; a CT scan of the ablated, deformed liver phantom was then collected for validation.

 a

 b c
 Figure 2. (a) CT slice of the phantom in its plaster mold prior to deformation. (b) The deformation applied to the hepatic phantom in a
 plaster base which was held in place by a piece of silicone (pink). (c) The tracked ablation probe inserted into the target in the phantom
 based on nonrigid guidance.

 2.3 Registration Analysis

 For consistency, all components (points, phantom, mock tumors, and the ablation zones) were all registered to the same
 computational space. A rigid-body point based registration between fiducial positions in the post-deformation CT scan and
 the physical positions collected with optical tracking allowed alignment of the tracked position of the ablation antenna
 with the measured positions of the tumors from CT imaging. This experimental setup allows a quantitative comparison of
 the predicted location of the ablation zone navigated to the mock tumor target with the true position of the tumor after
 deformation has been applied.

 Although the ablation zone cannot be visualized in CT imaging, the boundary of the ablation zone was created through the
 following process for the purpose of comparing the overlap between the ablation zone and the target to which it was
 navigated. The phantom material that was allowed to set in the box mold was treated with 915 MHz MWA for 15 minutes
 and its dimensions (Figure 3a and 3b) were used to generate an ellipsoid model. An assumption is made here that both
 ablation zones resulting from rigid and nonrigid guidance had the same dimension as observed in the box mold and were

 Proc. of SPIE Vol. 11315 113151G-3
Downloaded From: https://www.spiedigitallibrary.org/conference-proceedings-of-spie on 29 Jan 2021
Terms of Use: https://www.spiedigitallibrary.org/terms-of-use
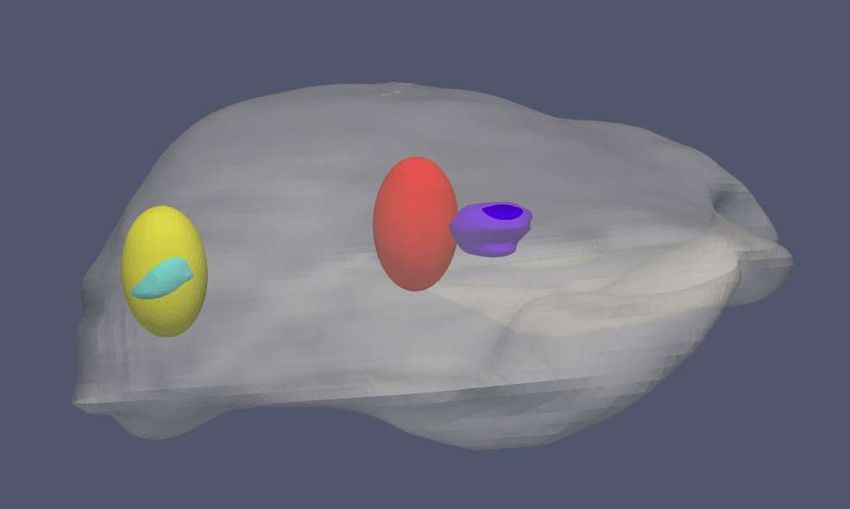
perfectly shaped ellipsoids. These ellipsoids were registered so that their centers aligned with tracked positions of the
 ablation probe window and their orientations were in the same direction of vectors created by segmentation of points in
 the CT scan where a void was created along the track of the ablation probe (Figure 3c). The resulting model of co-
 registered ablation and tumor positions is shown in Figure 3d.

 Target
 x
 x

 a b c

 = Liver

 = Tumor 1 with NR registration as guidance

 = Tumor 2 with R registration as guidance

 = Ablation for tumor 1

 = Ablation for tumor 2

 d
 Figure 3. (a) The height of the ablation zone inside the box mold; it is approximately 33.4 mm. (b) The diameter of the ablation zone
 in the box phantom; it is approximately 24.1 mm. (c) Because the ablation zone is not visible on CT imaging, it’s location was determined
 by segmenting the point where the probe entered the phantom and its tip. (d) The components of the experiment registered in the same
 space. The grey is the liver; the yellow is the ablation zone created from nonrigid registration guidance in targeting the turquoise tumor.
 The red is the ablation zone as a result from rigid registration guidance in targeting the dark blue tumor. The result of fiducial points
 used for point-based registration are the five green points below the liver.

 To assess the effectiveness of the ablation zone in removing target lesion for both rigid and nonrigid registration cases, the
 positive predictive value (PPV) as defined by:

 ∩
 = ∙ 100%

 where ∩ is the volume of the tumor successfully ablated and is the total volume of the tumor. The PPV for the
 nonrigid registration case was 96.8% and for rigid registration, 0.0%.

 3. RESULTS
 Figure 4 shows a qualitative comparison between the displays used to position the ablation probe into the center of the
 tumor. Figure 4a depicts the guidance display used when positioning the probe using rigid-body registration and ablating
 the first tumor, while Figure 4c shows the same display for the same tumor at the same probe position except if the nonrigid
 guidance display. More specifically, Figure 4c suggests that the point navigated to in Figure 4a will be in fact a missed
 ablation as the registration used in Figure 4c suggests the tumor is in a different location. We should note that the tumor
 ablated in Figure 4a, and 4c was guided by the rigid guidance display. Figure 4d depicts the nonrigid guidance used when
 positioning the ablation probe inside the second tumor, while Figure 4b shows the same display for the same tumor at the

 Proc. of SPIE Vol. 11315 113151G-4
Downloaded From: https://www.spiedigitallibrary.org/conference-proceedings-of-spie on 29 Jan 2021
Terms of Use: https://www.spiedigitallibrary.org/terms-of-use
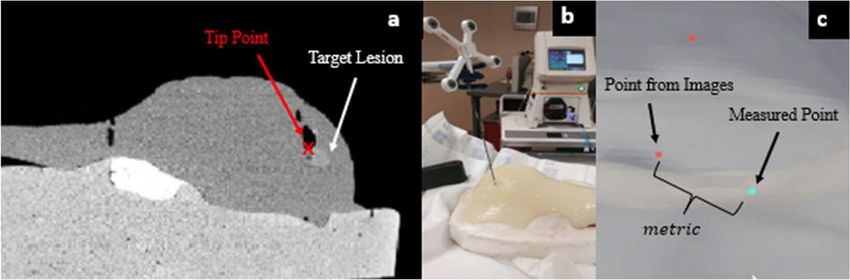
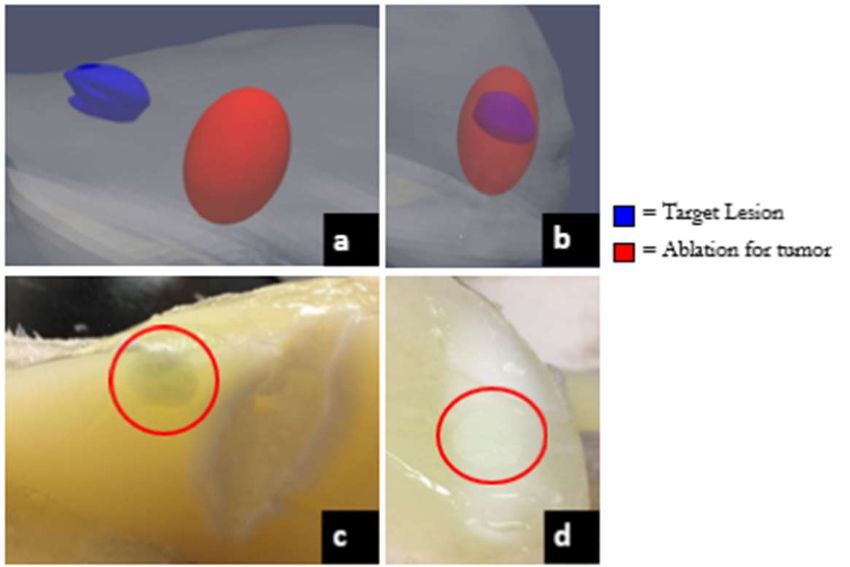
same probe position but if the rigid-body registration display were to be used instead (in contrast to Figure 4a/4c, the
 nonrigid registration was used to guide and deliver the ablation to this mock tumor target). In this case, the probe position
 in Figure 4b is a reconstructed location assuming rigid registration.

 Figure 4. The guidance display when predicting the location of tumor with respect to the ablation probe position. The actual displays
 used for ablation are boxed in red. (a) The guidance display when positioning the probe (in green) into the tumor (in brown). This
 display used rigid registration. (b) The guidance display when positioning the probe (green) into a different tumor (brown) using rigid
 registration. (c) The location of the ablation probe for the same tumor in 4a except the guidance display is depicting the probe location
 with respect to the tumor using nonrigid registration. (d) The ablation probe is in the same position for the same tumor as in 4b except
 the guidance display depicts the prediction using rigid registration. The alignment displays shown in 4a and 4d were used to
 prospectively guide the ablation probe for the respective tumor targets, and the displays in 4b and 4c were generated retrospectively
 after the microwave ablation had commenced.

 For verification, Figure 5 shows a qualitative comparison of the spatial relationships between the tumor and the ablation
 zone in the hepatic agar-albumin phantom and the generated computational model. Figure 5a and 5b depict the ablation-
 tumor overlap in the computational environment under rigid, and nonrigid guidance, respectively. Gross pathology
 dissections in Figure 5c and Figure 5d depict the ablation-tumor overlap in the physical phantom under rigid, and nonrigid
 guidance, respectively.

 Proc. of SPIE Vol. 11315 113151G-5
Downloaded From: https://www.spiedigitallibrary.org/conference-proceedings-of-spie on 29 Jan 2021
Terms of Use: https://www.spiedigitallibrary.org/terms-of-use
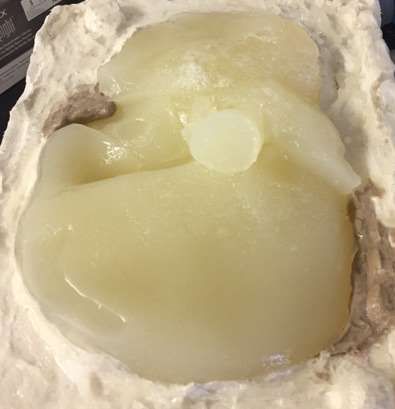
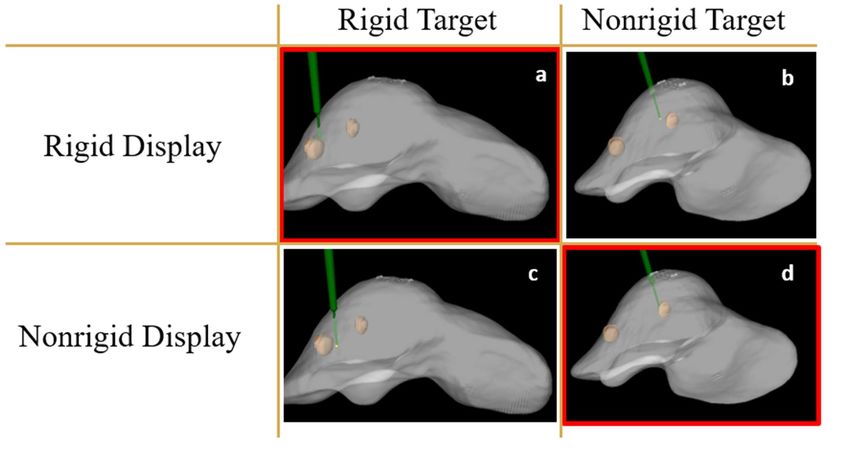
Figure 5. (a) The computational liver model (white) with the ablation zone (red) and tumor (blue) for rigid registration oriented in the
 same configuration as gross pathology in 5c. (b) The computational liver model (white) with the ablation zone (red) and tumor (blue)
 for nonrigid registration oriented in the same configuration as gross pathology in 5d. The overlap between the ablation zone and tumor
 is in purple. (c) The agar-albumin phantom sliced after treatment to depict the ablation zone guided with rigid registration (white) and
 the target lesion (dyed green and circled in red). (d) The same agar-albumin phantom sliced open to depict the ablation zone guided
 with nonrigid registration (white) and the target lesion (dyed green and circled in red).

 DISCUSSION
 4.1 Post-Treatment Analysis
 The qualitative results found in Figure 4 are consistent with the quantitative findings. The nonrigid registration display of
 the probe (Figure 4c-reconstructed, 4d) targets the tumor better as compared to its rigidly registered counterparts (Figure
 4a, 4b-reconstructed). Similarly, the evidence for this better targeting can be seen in Figure 5b, deformation corrected,
 when compared to that of Figure 5a. This suggests that the nonrigid registration gave a more accurate prediction of the
 probe location with respect to the tumor than rigid.
 Quantitatively, the nonrigid registration showed profound improvement in ablating the target lesion both in prediction
 shown in Figure 4 and in outcome Figure 5b. Although, according to the PPV, it is implied that some of the tumor during
 the nonrigid registration case was not fully ablated as can be seen in the protruding side of the tumor in Figure 3c. It is
 difficult to verify whether tumor was actually missed in gross pathology of the post-ablation phantom due to the
 configuration slice shown in Figure 5b. This is a potential limitation of this experiment as the dimensions of the ablation
 zone used to computationally model and calculate PPV were taken from an ellipsoidal model of the ablation zone taken
 from the box phantom. It is important to note, however, that current manufacturer standards for characterizing ablation
 zone volumes are similar in design to the box experiment presented here except that the ellipsoidal models are measured
 from ablations performed in ex vivo tissue.
 4.2 Registration Error Analysis
 In order to analyze the registration error during this work, a virtual simulation was used to compare the rigid and nonrigid
 registration techniques (Figure 6). To quantify registration error, the distances between each registered tumor centroid
 from the initial planning image and the centroid of the ground truth tumor derived from post-operative imaging of the
 phantom after treatment were compared (Table 1). For the tumor that was targeted using nonrigid guidance, the position
 of the tumor predicted by nonrigid registration was compared with the ground truth tumor position. In this case, the centroid
 distance was approximately 5.1 mm. A simulated experiment was performed to see how the position of the same tumor
 would have compared if rigid registration was used for guidance instead, and found that the centroid distance between the
 virtual position of the rigidly registered tumor and the ground truth would have been 9.2 mm. Likewise, the same was done
 to the tumor targeted using rigid guidance. Between the ground truth tumor and the rigidly registered prediction of the
 tumor position, it was found the inter-centroidal distance was 7.0 mm. When the tumor location was instead predicted

 Proc. of SPIE Vol. 11315 113151G-6
Downloaded From: https://www.spiedigitallibrary.org/conference-proceedings-of-spie on 29 Jan 2021
Terms of Use: https://www.spiedigitallibrary.org/terms-of-use
using nonrigid registration, the centroid distance was only 3.0 mm. This reaffirms the results of this work that the
 registration error involved with guidance was lower for the nonrigid than the rigid registration method.

 Figure 6. A comparison between the locations of the tumor positions with the ground truth tumor (brown). On the left, the ground truth
 (brown) and predicted (yellow) positions of tumors using nonrigid registration as guidance are depicted, while the pink tumor shows
 the predicted position of the tumor if rigid registration were to be used. On the right, the predicted position of the tumor using rigid
 registration as guidance is depicted with yellow, while the predicted position of the same tumor if nonrigid registration were applied is
 shown in pink.

 Table 1. The centroid distance between each tumor compared with the ground truth.

 TUMOR REGISTRATION CENTROID
 DISTANCE
 NONRIGID GUIDANCE Nonrigid Actual 5.1 mm
 Rigid Virtual 9.2 mm
 RIGID GUIDANCE Rigid Actual 7.0 mm
 Nonrigid Virtual 3.0 mm

 4.3 Imaging Error Analysis

 As mentioned previously, the ablation zones are not visible on CT scans and as a result, geometric models were generated
 from gross pathology performed on a box phantom. This assumes that the ablation zone was a perfect ellipsoid, had the
 same dimensions between the hepatic phantom and the box phantom, and did not change between each tumor ablation in
 the hepatic phantom. Additionally, the volumes of the segmented tumors between the initial imaging and the post-treatment
 imaging were found to change by approximately 25%. This change is hypothesized to be caused by the diffusion of contrast
 agent between preoperative and postoperative imaging which results in blurring of the tumor boundaries that can
 segmentation of the region of interest less consistent.

 4.4 Localization Error Analysis
 To determine the error between where the ablation probe was believed to have been placed versus where it was actually
 placed, the actual position of the probe was found by segmenting the tip point of the ablation probe from CT images
 (Figure 7a). Using an optically tracked probe, the position of the probe was also measured as point data during ablation;
 this is where the probe was believed to have been placed with respect to intraoperative tool tracking (Figure 7b). After
 co-registering both points into the same space using the transformation derived from the multimodal fiducial set, the
 distances between the tracked and observed probe tip locations were calculated (Figure 7c). It was found that the probe
 using nonrigid registration as guidance had a localization error distance of 11.2 mm while the probed placed using rigid
 registration had a localization error of 17.7 mm. This suggested significant localization error in the probe

 Proc. of SPIE Vol. 11315 113151G-7
Downloaded From: https://www.spiedigitallibrary.org/conference-proceedings-of-spie on 29 Jan 2021
Terms of Use: https://www.spiedigitallibrary.org/terms-of-use
placement. However, the confirmation work using gross pathology to analyze the tumor and ablation zone spatial positions
 did not seem to indicate this level of error. Based on the post-experiment analysis, it is hypothesized that this error may
 have been caused by changes to the measured probe tip localization at the time of acquisition due to flexure of the
 needle. In future work, a more controlled process of probe delivery and stabilization during guidance and ablation is
 necessary in order to confirm these preliminary findings.

 Figure 7. (a) The true position of the ablation probe was determined by segmenting the probe tip from the needle track seen in the CT
 images. (b) The probe position was also collected using an optical tracker placed on the probe. (c) The distance between the two points
 were calculated to find the localization error of the ablation probe.

 4. CONCLUSION
 Soft tissue deformation is a continual challenging factor for the development of image-guided therapeutic delivery in the
 liver. The experiment reported provides preliminary results toward prospective guidance of microwave ablation using
 nonrigid, sparse-data-driven, image-to-physical registration as compared to guidance using conventional rigid registration.
 The results indicate that there is considerable potential for improving the accuracy of targeted ablation delivery with
 methods to compensate for soft tissue deformation. This improvement is represented by vastly superior PPV which implies
 more effective treatment of the target lesion. Additionally, nonrigid registration gives a more accurate prospective
 prediction of the ablation probe location with respect to the tumor when using the guidance displays. The next steps of this
 study would be to replicate the experiment for multiple cases and tumor locations. Additionally, the cause for the high
 localization error needs to be investigated and corrected. Accuracy of the analysis can also be improved by exploring ways
 to computationally model the ablation zone more correctly in terms of its dimensions.

 5. ACKNOWLEDGEMENTS
 This work was supported by the National Institutes of Health awards R01-EB027498 and T32-EB021937 from the National
 Institute of Biomedical Imaging and Bioengineering, the Systems Biology and Bioengineering Undergraduate Research
 Experience (SyBBURE) program at Vanderbilt University, Vanderbilt Institute for Surgery and Engineering, and the
 Center for Human Imaging at the Vanderbilt University Institute of Imaging Science.

 6. REFERENCES

 [1] C. Simon, D. E. Dupuy, and W. W. Mayo-Smith, “Microwave ablation: principles and applications,” Radiographics
 25, S69–S83 (2005).

 [2] C. Correa-Gallego et al., “A retrospective comparison of microwave ablation vs. radiofrequency ablation for colorectal
 cancer hepatic metastases,” Ann. Surg. Oncol. 21(13), 4278–4283 (2014).

 [3] D. J. Hawkes et al., “Tissue deformation and shape models in image-guided interventions: a discussion paper,” Med.
 Image Anal. 9(2), 163– 175 (2005).

 [4] T. Ikemoto, M. Shimada, and S. Yamada, “Pathophysiology of recurrent hepatocellular carcinoma after radiofrequency
 ablation,” Hepatol. Res. 47, 23–30 (2016).

 [5] J. A. Collins et al., “Multiphysics modeling toward enhanced guidance in hepatic microwave ablation: a preliminary
 framework,” J. Med. Imaging. 6(2), 025007 (2019).

 Proc. of SPIE Vol. 11315 113151G-8
Downloaded From: https://www.spiedigitallibrary.org/conference-proceedings-of-spie on 29 Jan 2021
Terms of Use: https://www.spiedigitallibrary.org/terms-of-use
[6] L. W. Clements, W. C. Chapman, B. M. Dawant, R. L. Galloway, and M. I. Miga, “Robust surface registration using
 salient anatomical features for image-guided liver surgery: algorithm and validation,” Med. Phys. 35(6), 2528–2540
 (2008).

 [7] J. S. Heiselman, W. R. Jarnagin, and M. I. Miga, “Intraoperative Correction of Liver Deformation Using Sparse Surface
 and Vascular Features via Linearized Iterative Boundary Reconstruction,” IEEE Trans. Med. Imaging, in press, (2020).

 Proc. of SPIE Vol. 11315 113151G-9
Downloaded From: https://www.spiedigitallibrary.org/conference-proceedings-of-spie on 29 Jan 2021
Terms of Use: https://www.spiedigitallibrary.org/terms-of-use
You can also read