PROCEEDINGS OF SPIE In-orbit characterization of the ISRF
←
→
Page content transcription
If your browser does not render page correctly, please read the page content below
PROCEEDINGS OF SPIE
       SPIEDigitalLibrary.org/conference-proceedings-of-spie

                   In-orbit characterization of the ISRF

                   Garnier, Thierry, Bénard, Hervé, Béhar-Lafenêtre,
                   Stéphanie, Snel, Ralph, Pelica Páscoa, Marcela, et al.

                                  Thierry Garnier, Hervé Bénard, Stéphanie Béhar-Lafenêtre, Ralph Snel,
                                  Marcela Pelica Páscoa, Niels Dijkhuizen, Bart Speet, Geert Slegtenhorst,
                                  Luca Maresi, Arnaud Pasquet, Mathijs Arts, "In-orbit characterization of the
                                  ISRF," Proc. SPIE 11852, International Conference on Space Optics — ICSO
                                  2020, 118523L (11 June 2021); doi: 10.1117/12.2599611

                                  Event: International Conference on Space Optics — ICSO 2021, 2021, Online
                                  Only

Downloaded From: https://www.spiedigitallibrary.org/conference-proceedings-of-spie on 27 Oct 2021 Terms of Use: https://www.spiedigitallibrary.org/terms-of-use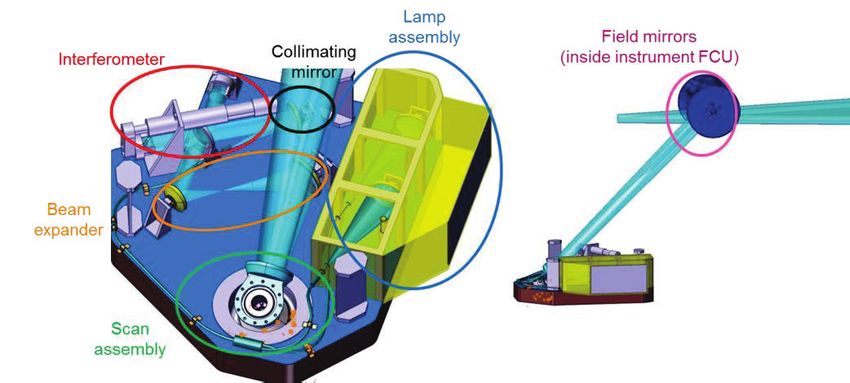
International Conference on Space Optics—ICSO 2020
                Virtual Conference
                30 March–2 April 2021

                                                                             Edited by Bruno Cugny, Zoran Sodnik, and Nikos Karafolas

              In-orbit characterization of the ISRF

                                      International Conference on Space Optics — ICSO 2020, edited by Bruno Cugny, Zoran Sodnik,
                                                Nikos Karafolas, Proc. of SPIE Vol. 11852, 118523L · © 2021 ESA and CNES
                                                          CCC code: 0277-786X/21/$21 · doi: 10.1117/12.2599611

                                                                        Proc. of SPIE Vol. 11852 118523L-1
Downloaded From: https://www.spiedigitallibrary.org/conference-proceedings-of-spie on 27 Oct 2021
Terms of Use: https://www.spiedigitallibrary.org/terms-of-use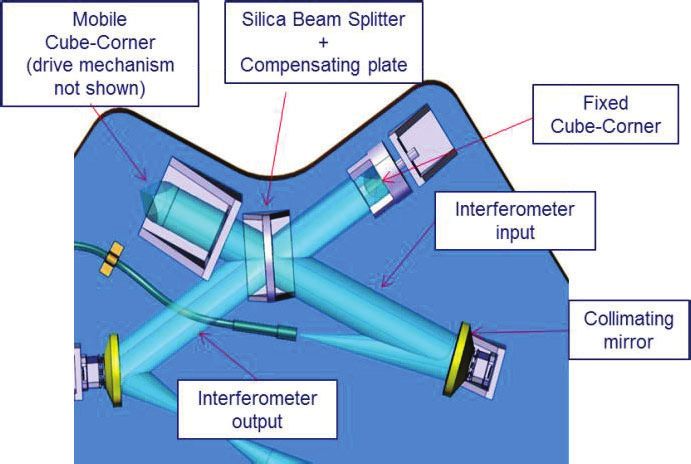
ICSO 2020                                                                                              Virtual Conference
                   International Conference on Space Optics                                                            30 March-2 April 2021

                                                       In-orbit characterisation of the ISRF
                             Thierry Garnier, Hervé Bénard, Stéphanie Béhar-Lafenêtre, Thales Alenia Space France
                            Ralph Snel, Marcela Pelica Páscoa, Niels Dijkhuizen, Bart Speet, Geert Slegtenhorst, TNO
                                                       Luca Maresi, Arnaud Pasquet, ESA
                                                         Mathijs Arts, ATG Europe BV

                                                                                   ABSTRACT

                     Recent Earth Observation instruments require a highly accurate knowledge of their Instrument Spectral Response
                     Function (ISRF). This translates into lengthy and costly characterisation programs during the Assembly, Integration, and
                     Test phase of the instrument. In addition, potential changes of ISRF after launch suggests to use an on-board equipment
                     dedicated to this accurate characterisation in flight. This topic has been studied by Thales Alenia Space and TNO in the
                     frame of a TRP study funded by ESA during years 2019 and 2020.
                     This paper first recalls the potential application cases and the related target performances of the study. Then we identify
                     conceptual solutions, such as operating tuneable laser diodes, Fabry-Perot interferometer, microresonators. Next, we
                     describe the principle of the selected solution: a Fourier Transform Spectrometer (FTS), used as a calibration light
                     source. Indeed, a single FTS can cover a very large spectral range with an extremely high spectral accuracy. But FTS are
                     known as complex and sensitive devices: we have designed a simplified solution, well adapted to space applications.
                     In a second step, we describe the flight hardware designed by Thales Alenia Space, targeting optimised manufacturing
                     and implementation. The main performances, being spectral resolution and signal to noise ratio (SNR), are discussed.
                     Breadboard activities also took place in TNO in order to validate the main hypotheses. Innovative data processing has
                     been tested, that only makes use of interferogram data, while maintaining a high accuracy. Description of the breadboard
                     as well as the first test results are presented.
                     Keywords: ISRF, FTS, Earth Observation, CO2 Instrument

                                                                             1. INTRODUCTION
                     Spectrometers for atmospheric chemistry and climate applications, such as TROPOMI, Sentinel 5 or the future
                     Copernicus missions for CO2 monitoring, require an extremely accurate calibration of the Instrument Spectral Response
                     Function (ISRF).
                     The ISRF, relating the measured spectra with the monochromatic Top-Of-Atmosphere (TOA) radiance, needs to be
                     known across the entire spectral range and Field-of-View (FoV) of the instruments. Several measurements are necessary
                     for the calibration of the ISRF as a function of the wavelength and the field of view. Furthermore, an accurate calibration
                     of the ISRF has to be performed in a thermal vacuum chamber at the operating temperature. Typically, such
                     measurements are performed in the frame of extensive on-ground calibration campaigns lasting several months and
                     involving the complete instrument. Therefore, the calibration of the ISRF of high-performance spectrometer is one of the
                     cost and schedule drivers.
                     In addition, the ISRF may be slightly modified due to the settling of the optics caused by launch vibrations and shocks
                     and due to the degradation of the instrument throughout its lifetime. Thermo-mechanical deformations can modify the
                     distances between optical elements and lead to a shift of the focal distances, which translate into changes of the ISRF
                     shape. Therefore, an in-flight calibration of the ISRF shape accounting for launch effects, short-term modifications and
                     long-term degradation would be beneficial for maintaining high instrument performance during the mission lifetime.
                     Previous space-borne imaging spectrometers for atmospheric applications (e.g. SCIAMACHY, GOME, OMI) have
                     mainly relied on thorough on-ground calibration with only very limited ISRF monitoring in orbit, combined with
                     mechanical stability of the instrument. This in turn lead to bulky and heavy mechanical designs for the optical bench and
                     mounts, with corresponding impact on mass and volume, which are also regarded as cost driving. A reliable on-board
                     technique for monitoring of the spectral response, ensuring ISRF knowledge compliant with the mission requirement,

                                                                        Proc. of SPIE Vol. 11852 118523L-2
Downloaded From: https://www.spiedigitallibrary.org/conference-proceedings-of-spie on 27 Oct 2021
Terms of Use: https://www.spiedigitallibrary.org/terms-of-use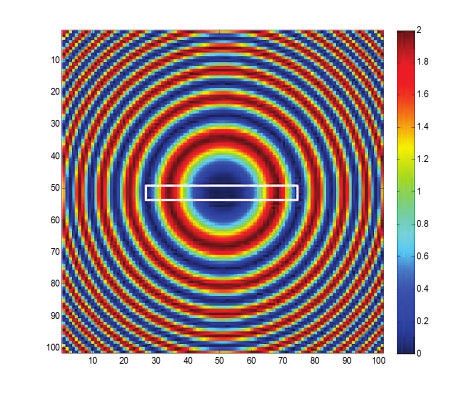
ICSO 2020                                                                                                   Virtual Conference
                   International Conference on Space Optics                                                                 30 March-2 April 2021

                     could potentially relax the mechanical stability needs and therefore reduce the overall complexity and cost of the
                     instrument.
                     A method to perform accurate in-orbit calibration of the ISRF is therefore expected to reduce cost and delivery time of
                     future space-borne imaging spectrometers, as well as improving their performance stability by periodically re-calibrating
                     the ISRF in-orbit. A first step in this direction is the inclusion of tuneable laser sources in fight calibration units of recent
                     (TROPOMI) [1] and future (Sentinel-5) imaging spectrometers. However, these are restricted to a very narrow
                     wavelength band defined by the tuneable range (typically < 2 nm) and are not expected to yield the accuracies required
                     over the entire spectral range and FoV. The main objective of these limited devices is the monitoring of potential
                     degradations, rather than a full-scale calibration. The objective of this activity is to explore possibilities for on-board
                     ISRF calibration over the full spectral range and FoV, beyond the current capabilities for degradation monitoring.

                     After review of the requirements set forth for several instruments, namely OMI/EOS, TROPOMI, Sentinel-5/UVNS,
                     FLEX, CHIME, Copernicus CO2 Monitoring, the requirements for the ISRF calibration system have been enriched and
                     completed. Here are the most relevant ones.

                          Table 1: ISRF calibration requirements
                          ISRF-1          The ISRF shall be known with an accuracy of 1% of its maximum over the spectral range Λ
                                          where the ISRF is greater than 1% of its maximum.
                                          Weight: mandatory.
                          ISRF-2          The ISRF shall be known with at least 20 sampling points per FWHM over the spectral range Λ.
                          ISRF-3          The shape of the ISRF shall be sufficiently well known to calculate the FWHM with an accuracy
                                          of 1%.
                          ISRF-4          The shape of the ISRF shall be sufficiently well known to calculate the barycentre with an
                                          accuracy of 0.05 SSI (Spectral Sampling Interval).
                          ISRF-5          The following reference instrument shall be used:
                                          • spectral range 270 to 2400 nm
                                          • spectral resolution 0.5 nm
                                          • spectral sampling interval 0.2 nm
                                          • spatial dimensions with 500 resolution elements in one dimension, 1 resolution element in the
                                          other
                                          • the instrument has a radiance and an irradiance mode
                          ISRF-6          The ISRF shall be known for all pixels that can see direct light (possibly by interpolation).
                          ISRF-7          The ISRF shall be known with sufficient accuracy to perform acceptance tests on the instrument, a
                                          representative subset of pixels is acceptable.
                          ISRF-8          It shall be possible to measure the orbital variation of the ISRF.

                                               2. POTENTIAL SOLUTIONS TRADE-OFF AND SELECTION

                     2.1 Overview of potential solutions and pre-selection
                     Quite a large number of solutions have been identified in the initial proposal. However, most of them have been
                     discarded at the beginning of the study, based on simple practical considerations reminded below.

                     The use of natural light sources available in space (Earth, Sun, Moon, planets or stars) have the following drawbacks:
                     -        They cannot be used on-ground to validate the device or to perform a first characterisation of the instrument
                     using the in-flight device
                     -        They may require special manoeuvres to be observed (e.g. for the Moon)
                     -        They are usually available during short slots only, during which the incidence angle is continuously changing
                     -        They exhibit a limited number of spectral features (e.g. Fraunhofer lines, atmospheric absorption lines), of fixed
                     wavelength and spectral width. As such, they usually cannot be used to calibrate all spectral pixels of the instrument.
                     Therefore, those natural sources have been discarded for an extensive ISRF calibration.

                                                                        Proc. of SPIE Vol. 11852 118523L-3
Downloaded From: https://www.spiedigitallibrary.org/conference-proceedings-of-spie on 27 Oct 2021
Terms of Use: https://www.spiedigitallibrary.org/terms-of-use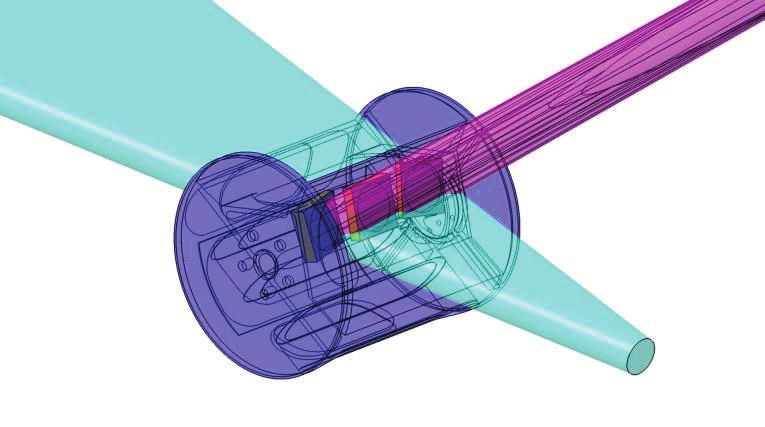
ICSO 2020                                                                                                 Virtual Conference
                   International Conference on Space Optics                                                               30 March-2 April 2021

                     Wide-band or largely tuneable laser and laser-based sources, such as OPO and super-continuum, have also been
                     discarded, as their flight operation often proved delicate and the flight experiences are actually few. Spectral lamps have
                     also been discarded. Although some have been successfully used in flight, they offer a limited number of spectral lines,
                     of fixed wavelength and spectral width, and as such are not suited to a measurement over a large spectral range.

                     Once the image of a monochromatic line is projected onto the detector, it must be sampled with an adequate step.
                     Several methods can be envisaged for that:
                     -         Relative shift of the detector with respect to the image plane across the spectral direction
                     -         Use of a slanted slit: several contiguous spatial pixels are used to sample the Instrument Line Shape (ILS)
                     -         Over-sample the ILS thanks to pixels smaller than the ISRF FWHM
                     -         Scan of the calibration source wavelength.
                     The relative shift requires some scan mechanism inside the spectrometer, between the entrance slit and the detector: this
                     is considered as a risk for the performances and requires to be taken into account very early in the instrument design.
                     Similarly, the slanted slit shows some advantages regarding the ISRF measurements but cannot be used for normal
                     observation mode and therefore requires some mechanism to switch between the nominal and the slanted slit. Here
                     again, this is considered too much intrusive in the instrument design. Over-sampling of the ISRF by the detector itself
                     has not been retained here, since the number of available spectral pixel is often limited by the detector technology. This
                     could be a solution for low or medium resolution instruments, but these ones usually do not require an accurate
                     knowledge of the ISRF.

                     Therefore, the only solution that have been considered for the trade-off is the scan of the calibration source wavelength.
                     This is ensured by the calibration device itself and does not rely on any particularity of the instrument. This is also in line
                     with the conclusion about the light source presented above.

                     2.2 Final trade-off and selection
                     Finally, 4 solutions have been considered for the trade-off:

                     2.2.1 Tuneable Laser diodes (LD)
                     The use of a tuneable LD for ISRF calibration is straightforward. Taking benefit from the single mode operation of
                     Distributed FeedBack (DFB) LD, and of the sensitivity of the emitted wavelength to the diode temperature and/or supply
                     current, narrow emission lines can be produced, narrower than the resolution of the instrument to be tested. The sweep of
                     the emitted wavelength over a range larger than the ISRF FWHM directly allows the retrieval of the ISRF. This is
                     already implemented in some instruments such as TROPOMI and is planned for Sentinel 5/UVNS and CO2I
                     instruments.

                                   Figure 1: Example performances of a Laser Diode. Left: Typical room temperature cw spectrum.
                                                 Right: Typical tuning of a Laser Diode by current and temperature.

                                                                        Proc. of SPIE Vol. 11852 118523L-4
Downloaded From: https://www.spiedigitallibrary.org/conference-proceedings-of-spie on 27 Oct 2021
Terms of Use: https://www.spiedigitallibrary.org/terms-of-use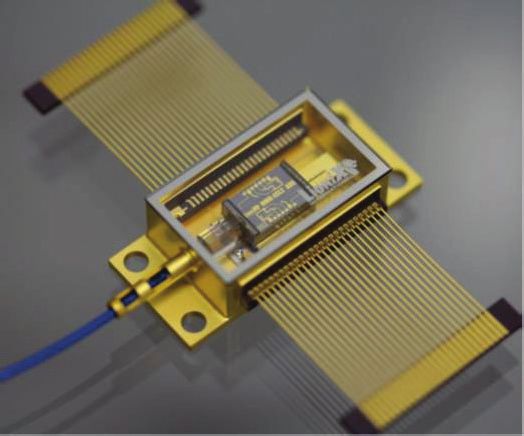
ICSO 2020                                                                                                         Virtual Conference
                   International Conference on Space Optics                                                                       30 March-2 April 2021

                     2.2.2 Micro-resonators
                     The micro-resonator-based frequency combs are devices that are still in development. While they are addressed by a
                     number of laboratory researches and related papers, they are not commercially available yet [2].

                     The main parts of such resonators are illustrated below. A laser diode generates a CW laser line, usually close to
                     1550nm. This line is further amplified, using an Erbium-Doped Fibre Amplifier, then propagates through one or several
                     micro-cavities in which non-linear Kerr effect occurs and generates several lines by four-wave mixing. Thanks to the
                     resonant properties of the cavity, the output of the micro-cavities is a frequency comb that covers quite a large spectral
                     range. Frequency generation over a full octave have been demonstrated in laboratory [3][4].

                          Figure 2: Primary building blocks of a micro-resonator

                     While materials and technology are available for micro-resonator devices in the SWIR range, this is no longer true for
                     VIS wavelengths[5][6], not to mention UV, for which usual materials are not suited (strongly normal Group Velocity
                     Dispersion GVD), and resonator Q-factors degraded by the micro roughness of the cavity.

                     The delivered power demonstrated in laboratory may reach almost 1mW per comb line for an input power of the order of
                     10W. This quite high power, combined with the small footprint of hybrid photonics technology, make micro-resonators
                     very attractive for space applications such as in-flight ISRF calibration. However, they have not been further addressed
                     in this study, because still a bit far from maturity.

                          Figure 3: Example of photonic hybrid package including micro-cavities: here a laser tuneable by steps

                                                                        Proc. of SPIE Vol. 11852 118523L-5
Downloaded From: https://www.spiedigitallibrary.org/conference-proceedings-of-spie on 27 Oct 2021
Terms of Use: https://www.spiedigitallibrary.org/terms-of-use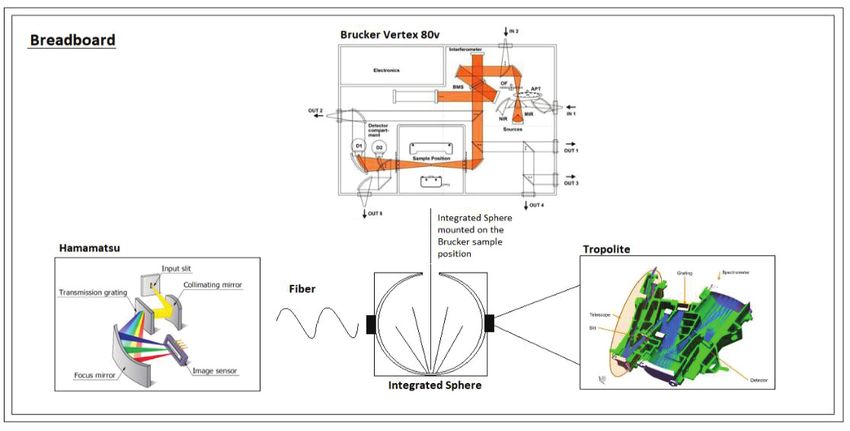
ICSO 2020                                                                                             Virtual Conference
                   International Conference on Space Optics                                                           30 March-2 April 2021

                     2.2.3 Fabry-Perot Etalons (FP)
                     Fabry-Perot etalons are well known devices, however they are rarely used in space-borne instrument. Tuneable Fabry-
                     Perot etalon are commercially available, usually based on PZT for adjustment of the plates spacing, and on capacitive
                     measurements for the closed-loop control of this spacing.

                     Because the spectral resolution of the FP and its Free Spectral Range FSR depends upon the spacing of the etalon plates
                     and on their reflectivity, 1 single device cannot cover the whole spectral range required. Moreover, practical
                     considerations such as polishing quality limit their performances: they are not suited to high resolution in the UV/VIS
                     range and would exhibit a resolution close to the instrument to be characterised in SWIR range. Finally, the output flux
                     is low.

                     2.2.4 Fourier-Transform Spectrometer (FTS)
                     The FTS can be considered as a way to modulate its input light beam with a frequency that is strictly related to the
                     wavelength. As such, it may provide for a convenient way to measure the ISRF, benefiting from the advantage of
                     measuring all channels at once, and also from the number of measurements that ensures a high SNR in the spectral
                     domain. This technique has already been reported in the literature for the AIRS instrument [7], although in a different
                     spectral range (from 3.7 to 15.4μm), and in the frame of ground testing.
                     FTS are however compatible with space environment: this has been demonstrated in flight by IASI instrument, and the
                     IRS instrument is currently under test, to be flown on third generation of Meteosat satellites.
                     The next figure illustrates the way a spectrometer ISRF can be retrieved from measurement of the FTS interferogram.

                          Figure 4: Principle of ISRF retrieval using an FTS as a light source

                     The drawback of the FTS is the need to accurately know the OPD, usually through a dedicated measurement path, its
                     size, and the volume of data produced.

                                                                        Proc. of SPIE Vol. 11852 118523L-6
Downloaded From: https://www.spiedigitallibrary.org/conference-proceedings-of-spie on 27 Oct 2021
Terms of Use: https://www.spiedigitallibrary.org/terms-of-use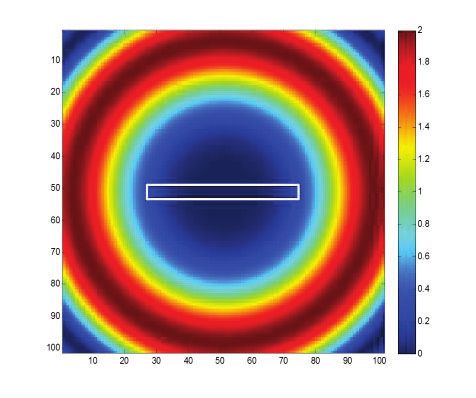
ICSO 2020                                                                                                    Virtual Conference
                   International Conference on Space Optics                                                                  30 March-2 April 2021

                     2.2.5 Trade-off conclusion
                     The advantages and limitations of the 4 solutions are briefly summarised in the table 2 below.

                          Table 2: Comparison of the 4 pre-selected solutions
                                                                  PROS                                  CONS
                     Tuneable Laser Diode (LD)                    Flight proven                         Limited tuning range (0.2nm/K)
                                                                  High output power                     Wavelength primarily dictated by
                                                                  Fibre-coupled                         available materials:
                                                                  Small size device                     only discrete wavelengths
                                                                                                        available, no device available in
                                                                                                        UV range and short VIS
                                                                                                        wavelengths,

                     Micro-resonator                              Fair output power                     Only available about 1.5μm
                                                                  Simultaneous measurements             Not mature yet
                                                                  (frequency comb)
                                                                  Fibre-coupled
                                                                  Small size device
                     Fabry-Perot Etalon (FP)                      Simultaneous measurements             Delicate H/W
                                                                  (frequency comb)                      Several devices required
                                                                                                        Insufficient spectral resolution
                                                                                                        Low output power
                     Fourier-Transform Spectrometer               Already demonstrated                  Medium to low signal
                                                                  Simultaneous and wide-band            OPD knowledge required
                                                                  measurements                          Data volume
                                                                  High SNR on retrieved ISRF            H/W volume

                     At this stage of the study, the FTS is selected as the best solution: it can cover the whole spectral range, it can deliver
                     sufficient signal, it is mature enough. The challenge is now to devise a simple and robust concept that is suitable for
                     accommodation aboard a space instrument.

                                                          3. DESIGN OF THE CALIBRATION SYSTEM

                     3.1 Application case (CO2I/CO2M)
                     While the trade-off reported above has led to the selection of a conceptual solution, the best way to go further in the
                     detailed study is to define a realistic application case, to which the ISRF calibration device will be dedicated.

                     Finally, the CO2I instrument has been selected as the application case. Not only is this instrument fully relevant because
                     of its very demanding ISRF knowledge in flight, but also it is well known in Thales Alenia Space who is now in charge
                     of its definition study.

                     The CO2M mission aims at monitoring anthropogenic CO2 emissions, relying on simultaneous accurate CO2 and NO2
                     observations with high spatial and temporal resolution at global scale, thanks to a constellation of identical satellites in
                     sun-synchronous orbit (altitude 735 km, LTDN 11:30).

                     To fulfil the mission’s objectives, each satellite will include the following capabilities:
                          Perform measurements in NIR, VIS, SWIR-1, SWIR-2 channels and determine total column concentrations for
                               atmospheric CO2 and CH4 as well as atmospheric NO2 content for accurate tracing of anthropogenic CO2
                               plumes with the CO2I instrument (Thales Alenia Space in France)
                          Perform measurements of aerosols to better account for scattering effects using the Multi-Angle Polarimeter
                               (MAP) instrument (Thales Alenia Space in UK)
                          Accurately filter data for cloud-contaminated cases thanks to the Cloud Imager (CLIM) (OIP in Belgium).

                                                                        Proc. of SPIE Vol. 11852 118523L-7
Downloaded From: https://www.spiedigitallibrary.org/conference-proceedings-of-spie on 27 Oct 2021
Terms of Use: https://www.spiedigitallibrary.org/terms-of-use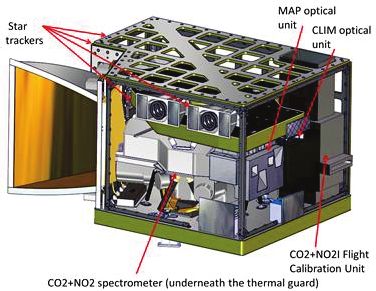
ICSO 2020                                                                                                     Virtual Conference
                   International Conference on Space Optics                                                                   30 March-2 April 2021

                     Observations run continuously for Sun zenith angles up to 80 degrees. A Sun calibration is performed over the North
                     pole, and other kinds of calibration during eclipse.

                          Figure 5: The CO2M payload carries 3 distinct instruments

                     The CO2I cross-track Spatial Sampling Angle SSA is 2.85mrad, and the integration time is 0.29s.

                     As mentioned, the CO2I instrument operates in 4 channels specified below, which are therefore to be addressed by the
                     ISRF calibration device in replacement of the requirement ISRF-7 defined above.

                          Table 3: CO2I instrument performances
                                                                                 VIS                  NIR         SWIR-1        SWIR-2
                     Spectral range (nm)                                       405 - 490            747 - 773   1590 - 1675    1990 - 2095
                     Spectral resolution (nm)                                     0.6                 0.12          0.3           0.35
                     Spectral sampling (nm)                                       0.2                 0.04          0.1           0.12
                     ACT Spatial Angular Sampling (mrad)                         2.85                 2.85         2.85           2.85

                     3.2 Design drivers
                     One important part of FTS is often the sub-system devoted to the accurate measurement of the OPD, which usually
                     requires a dedicated measurement path in the interferometer and its related electronics. This is why an innovative
                     technique has been considered, to get rid of this OPD measurement specific part and to derive the OPD from the
                     interferogram measurement themselves, taking advantage of the different spectral channels available. This has been the
                     major objective of the breadboarding activities described below.

                     A second driver relates to the retroreflectors used on each arm of the interferometer. The simplest device is a flat mirror,
                     but then the guiding accuracy of the drive mechanism is severely constrained. The use of cube-corners (CC) allows for a
                     relaxation of these constraints, and we have selected solid-glass CC with a relatively small diameter of 25mm, or 1 inch.
                     They can be quite easily procured, and the small dimension and mass again contributes to relaxing the requirements on
                     the mechanism and of the overall system. The counterpart is a beam expander to be inserted between the FTS output and
                     the instrument, in order to recover a diameter sufficient to illuminate the entire entrance pupil of the instrument, and an
                     increase of the beam divergence within the interferometer, which adversely affects its spectral resolution.

                                                                        Proc. of SPIE Vol. 11852 118523L-8
Downloaded From: https://www.spiedigitallibrary.org/conference-proceedings-of-spie on 27 Oct 2021
Terms of Use: https://www.spiedigitallibrary.org/terms-of-use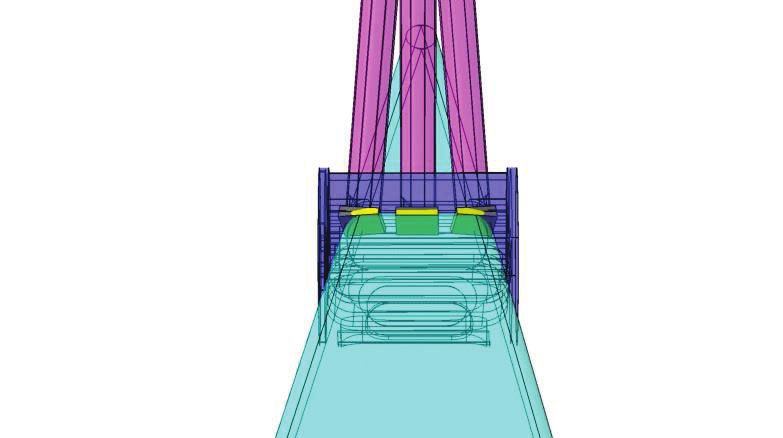
ICSO 2020 Virtual Conference
International Conference on Space Optics 30 March-2 April 2021
Another important topic is the light level at the FTS output. In the basic concept that has first been naively analysed, a
diffuser plate was placed between the FTS and the instrument entrance pupil, embedded in the rotating drum of the
instrument Flight Calibration Unit (FCU), thus allowing to illuminate the entire instrument FoV at once. However, the
signal level revealed too low in that configuration. To solve this issue, it has been decided instead to sequentially
characterise only a few spatial samples of the instrument, through a direct, collimated beam, reflected by a flat mirror
located in lieu of the diffusing plate. This way, the light level at FTS output is more than sufficient, and even excessive
for some channels. It has the secondary advantage that a low power lamp is sufficient, and therefore the thermal control
is simplified.
Finally, the operational scenario must also be considered. Let’s take the channel SWIR 1 as an example. Numerical
simulations have demonstrated that a maximum OPD of 10 mm was sufficient. Applying the usual sampling criterion,
the OPD step should be smaller than half the measured wavelength, that is roughly 0.8μm. The number of samples to be
acquired then reaches 12500 for a single-sided interferogram. Let’s assume that measurement is performed in 1
integration period, while the OPD step is performed within another integration step. Then the overall measurement
duration amounts to 12500*2*0.29=7250s, that is approximately 2 hours. Calibration would therefore require more than
1 orbit for completion, thus precluding normal observation, or it would be limited to eclipse periods and therefore
requires to be split between several orbits. This is not in favour of accuracy and does not allow to meet requirement
ISRF-8. Therefore, taking advantage of the narrow spectral channels of the instrument, and of the a priori knowledge of
their spectral positions, interferograms must be undersampled such that a full band characterisation takes less than 40
minutes, that is approximately less than 3200 acquired samples per channel.
3.3 Calibration system design
3.3.1 Overview
The main part of the calibration device is shown on the next figure. It is composed of an optical bench that supports:
- The interferometer, that is the heart of the system
- The light source assembly
- The beam expander and the scan mirror, that shape the output beam and direct it towards the instrument.
Figure 6: The optical bench supporting the light source, the interferometer, and the beam coupling at its output. The right-
hand view also shows the FCU drum containing the field mirrors that reflect the FTS beam toward the instrument
This ensemble still needs to be completed by a set of field mirrors located in the instrument FCU, and by electronic
boxes required to drive the 2 mechanisms and the lamps, assumed to be hosted in the instrument itself.
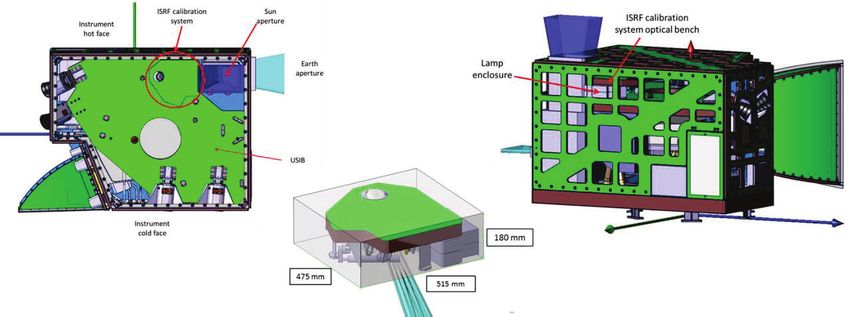
The overall dimensions of the equipped bench are modest. Its mass is estimated as less than 8kg, and it fits well within
the instrument as shown by the figure 7.
Proc. of SPIE Vol. 11852 118523L-9
Downloaded From: https://www.spiedigitallibrary.org/conference-proceedings-of-spie on 27 Oct 2021
Terms of Use: https://www.spiedigitallibrary.org/terms-of-useICSO 2020 Virtual Conference
International Conference on Space Optics 30 March-2 April 2021
Figure 7 - Centre: dimensions of the calibration device are reasonable. Left: Footprint of the optical bench compared to that
of the payload. Right: the calibration device is close to an aperture of the side panel, to benefit from a radiative area.
3.3.2 Interferometer
The interferometer is classically built around a Silica beam splitter BS and its Silica compensating plate CP, and features
2 arms with 30° incidence angles, which ensures smaller optical parts and less polarisation. The largest optical dimension
of the BS is 30mm, and its thickness 5mm. One face of the BS is coated with a metallic coating (e.g. chromium) that
ensures a reflection and a transmission value of at least 20% for the useful spectral bands. The other face of the BS, as
well as the 2 faces of the CP, are left uncoated, with Fresnel losses close to 4% at each interface. An anti-reflection
coating ARC, optimised for the 4 CO2I spectral bands, could have also been used, however the gain is considered low.
The use of a CP is somewhat mandatory to balance the glass thickness crossed by the 2 arms, and therefore reduce the
chromatic OPD between the 2 arms. Ideally, the thickness of the 2 plates should be similar to within a few tens of
microns.
The solid-glass CC are also made of fused Silica. Their overall diameter is 25mm for a clear aperture of 22mm. Their
front face can be left uncoated, with a reflection of about 4%, or be AR-coated to reduce this a bit. The rear faces are left
uncoated, so that total internal reflection occurs. As for the BS, the thickness of the 2 CC should be similar in order to
reduce the chromatic OPD between the 2 arms. Since the wavefront error difference between the 2 arms of the
interferometer is likely to reduce the contrast of the light modulation at its output, the CC should be selected with a low
WFE in order to minimise their difference. Beam deviation is often used as a proxy for the CC’s WFE: a beam deviation
of 1.3 arcsec is convenient regarding the short wavelengths of VIS band.
Figure 8: Top view of the interferometer. BS and CP are close together and share the same mount
The mobile CC is mounted on a linear actuator capable of a 20mm stroke and of step smaller than 0.5μm. The selected
mechanism is an existing linear actuator, that meets these requirements and is already qualified for spatial environments
similar to the ones of CO2M.
Proc. of SPIE Vol. 11852 118523L-10
Downloaded From: https://www.spiedigitallibrary.org/conference-proceedings-of-spie on 27 Oct 2021
Terms of Use: https://www.spiedigitallibrary.org/terms-of-useICSO 2020 Virtual Conference
International Conference on Space Optics 30 March-2 April 2021
3.3.3 Light source
The lamp selected for the calibration device is a low-power, Quartz-Tungsten-Halogen lamp (Halostar Starlite). It is
rated for a 10W electrical power, and a colour temperature of 2800K. Similar lamps have been already qualified for
flight aboard EnMap instrument [8]. The light flux from the lamp is collected by an off-axis, aspherical mirror, and
focused onto the input of a fibre bundle. The latter allows for a flexible accommodation, and also for a cold redundancy
by using a Y-shaped bundle. The output of the bundle is placed at the object focus of an off-axis parabola that collimates
the beam before it enters the interferometer.
With this configuration, where the instrument basically looks at the lamp through the calibration device and its
transmission, it happens the light level at the interferometer output is fair for the VIS channel, but far too high for IR
channels. The collecting mirrors are therefore coated with a specific ‘cold filter’ that attenuates the IR wavelengths and
balances the spectrum.
Figure 9: Left: the reflection factor of the cold filter as designed. Right: Radiances obtained at instrument input with this
cold filter are close to the target.
3.3.4 Beam coupling
The beam output by the interferometer is first expanded by a beam expander composed of 2 off-axis, confocal parabolas.
Then it is reflected by a rotating mirror (scan mirror) towards the so-called field mirror, located within the instrument
FCU, that again reflects it towards the instrument entrance pupil with the right angle. Since the volume is limited inside
the FCU, only 3 such mirrors can be implemented in the case of CO2I, meaning that only 3spatial samples can be
characterised in flight. This however is considered sufficient to detect a variation, and possibly to derive the ISRF of
other spatial samples through some interpolating scheme.
Figure 10: Field mirrors re-direct the beam from the calibrator to the instrument. Only 3 such mirrors can be accommodated
within the CO2M FCU.
The rotary actuator that has been selected to drive the scan mirror is an existing, space qualified model which offers
convenient performances such as small angular steps of approximately 20 arcsec.
Proc. of SPIE Vol. 11852 118523L-11
Downloaded From: https://www.spiedigitallibrary.org/conference-proceedings-of-spie on 27 Oct 2021
Terms of Use: https://www.spiedigitallibrary.org/terms-of-useICSO 2020 Virtual Conference
International Conference on Space Optics 30 March-2 April 2021
3.3.5 Thermal control
Despite its low power, the heat produced by the lamp needs to be dissipated by a radiator towards the cold space and
should not affect the stability of the optical bench and of the interferometer. To that purpose, the lamps and the collecting
mirrors are decoupled from the optical bench using insulating washers, and are enclosed in a cavity, decoupled from the
instrument and the ISRF calibration device by MLI. This cavity is coupled to a 0.025m² radiator located on the CO2M –
Y panel, covered by SSM on its external side and black coated on its internal side. An active thermal control is
implemented on the radiator to ensure a stable environment to the lamp during all the mission. The radiator temperature
is then stabilised to -10°C, thanks to an active thermal control power of about 4W, while the temperature of the lamp
remains stabilised at about 300°C.
3.3.6 Optical bench
The optical bench is made from a 50mm thick honeycomb CFRP panel with 1.6mm skin. A finite element model
analysis has demonstrated a first resonant frequency above 190Hz. The model has also been used to check the thermo-
elastic behaviour of the calibration bench, and especially of the interferometer.
3.4 Calibration system expected performances
3.4.1 ISRF barycentre (ISRF-5)
The error on the retrieved ISRF barycentre is essentially dominated by the error on the wavenumber scaling, hence by
the linear error on the OPD step. This in turn depends on the following contributors:
- Knowledge of the mobile corner cube displacement step
- Residual chromatism between the 2 arms of the interferometer
- Accurate alignment of optical axis with the mobile CC stroke axis
- Angular spatial extent of the measured instrument sample, which induces self-apodisation and spectral shift
The usual process is to rely upon a upon a laser beam passing through the interferometer, and the knowledge of its
wavelength. This in turn introduces some complexity in the design, such as accommodation of the laser source, its
receiver, the metrology optical path, the electronics, etc.
For sake of simplicity, one of the design drivers was to not use such metrology. Instead, the baseline is to design a robust
and stable system, that can be calibrated on-ground, then remains stable throughout the launch and the operational life.
According to the requirement ISRF-5, the required relative accuracy on the retrieved wavelength amounts to 0.05 x SSI /
O, that is as low as 2E-6. The relative accuracy required for the knowledge of the OPD should therefore be of the order of
1E-6, and the stability should be even better, of the order of 1E-7 over the duration of 1 calibration, that is roughly 40
minutes. This is considered achievable through a careful thermal control of the OPD drive mechanism and of the
interferometer as a whole.
Another solution is to accurately derive the OPD from the interferogram data, taking benefit from the numerous adjacent
channels. Investigating this way is one of the goals assigned to the breadboard activities reported below.
3.4.2 ISRF FWHM (ISRF-3)
The determination of ISRF FWHM is not affected by errors on wavelength scaling. However, it is affected by some of
the errors that also affects the shape of the ISRF. The most critical contribution appears to be the residual chromatism
between the 2 arms of the interferometer, and its variation over the wavelength range of the ISRF. This is why this
chromatism must be reduced to the maximum extent by a careful match of the BS and CP thicknesses, and of the 2 CC
thicknesses. For shorter wavelengths of VIS band, a match to within 20μm is required.
OPD harmonic errors may also have a significant impact, depending on their period. The strategy is here to characterise
these errors on ground, then to account for them during the data processing and the ISRF retrieval. As they are linked to
the CC drive mechanism and especially to its reduction stage, they are not supposed to evolve in flight.
Proc. of SPIE Vol. 11852 118523L-12
Downloaded From: https://www.spiedigitallibrary.org/conference-proceedings-of-spie on 27 Oct 2021
Terms of Use: https://www.spiedigitallibrary.org/terms-of-useICSO 2020 Virtual Conference
International Conference on Space Optics 30 March-2 April 2021
Non-linearity of the instrument detection chain is also a potential contributor, much similar in its effect to the harmonic
OPD error. There is no mean for the calibration system to reduce this: the best we can do is to characterise it, then to use
this characterisation to further correct all the acquisition data.
3.4.3 ISRF Shape (ISRF-1)
The shape of the retrieved ISRF may be affected by several contributions, some of them also affecting the performances
discussed above. Meeting the requirement of 1% accuracy requires tight to very tight tolerances.
One important contribution comes from the self-apodisation, which happens when the size of the detector becomes non
negligible with respect to the interferometer field angle, or when the detector is no longer centred in this field. The figure
below illustrates the loss of contrast for a detector of large dimension compared to the interference pattern.
Figure 11. (left) Fringe pattern generated by a small OPD: the irradiance on the detector is quite uniform. (right): Fringe
pattern generated by a large OPD: the various rings observed scramble each other.
Without any particular processing, each point in the pattern will return a frequency which is slightly shifted with respect
to the one retrieved at the centre. The neat effect for a large and off-centred detector is then an overall spectral shift and a
broadening of the retrieved spectrum (loss of resolution). Most of this effect can be modelled and corrected by an
adequate processing of the data, however this assumes the alignment between the interferometer and the instrument to be
calibrated is well-known, and stable when in flight. The figure below plots the error resulting from a misalignment
between the interferometer and the NIR channel of the CO2M instrument: the alignment must always be known to better
than 0.5mrad, i.e. 1/5th of a CO2M spatial sample.
Figure 12. The retrieved ISRF is very sensitive to the alignment between interferometer and instrument
The contributions to ISRF-shape error are summarised in the table below.
Proc. of SPIE Vol. 11852 118523L-13
Downloaded From: https://www.spiedigitallibrary.org/conference-proceedings-of-spie on 27 Oct 2021
Terms of Use: https://www.spiedigitallibrary.org/terms-of-useICSO 2020 Virtual Conference
International Conference on Space Optics 30 March-2 April 2021
Table 4. Error budget on ISRF shape
Contribution Tolerance Impact on ISRF shape
Chromatism and induced BS and CP thickness equal to less than 20μm
0.22%
ZPD error CC thickness equal to less than 40μm
OPD linear error Linear error corrected to less than 1E-7 < 0.4%
OPD harmonic errors Characterised on-ground < 0.1%
MCC alignment 1 arcmin negligible
FTS/Instrument alignment 0.5 arcmin
0.5%
and self-apodisation
Light source instability 1.5% caused by temperature variations.
0.35%
Supply regulation assumed negligible.
SNR negligible
Total error (Linear / RSS) 1.57% / 0.77%
As a conclusion, meeting the requirement of 1% accuracy requires tight tolerances, but looks as an achievable target.
4. PROCESSING BREADBOARD
4.1 Breadboard objectives and description
Two difficulties are evidenced in the ISRF measurement concept presented above:
1. OPD errors play a crucial role in the performance of the system, and essentially its accuracy. One solution is to
calibrate the OPD errors on-ground and to rely on its stability when in flight: this is the way the ISRF calibration system
presented above has been designed. There is however another possibility, that is to process the interferogram data in such
a way to retrieve the accurate OPD information from them.
2. The number of samples to be acquired in an interferogram is usually very large. But in order to keep the measurement
duration in a reasonable range, not larger than one half of an orbit, the number of samples must be limited to
approximately 3200. This requires to sub-sample the interferograms while keeping a sufficient accuracy on the retrieved
ISRF.
The goal of the breadboarding activities is to demonstrate the solutions to the two issues listed above: retrieval of
accurate OPD data from the interferogram; retrieval of an accurate ISRF from a sub-sampled interferogram.
The in-orbit design of the breadboard was generated with the Copernicus CO2M mission as a target application for this
study. For this breadboard activity the following spectral bands on this mission were selected: Visible channel [405-490]
nm and Near Infrared channel [747-773] nm. For this reason, the test instruments chosen for the breadboard were:
Tropolite spectrometer within [320-500] nm and Hamamatsu spectrometer respectively [200-800] nm, covering different
spectral ranges and different spectral resolution.
The simplified lay-out to fulfil all the In-Flight ISRF breadboarding goals is presented in Figure 13 as being the design
of the breadboard and its OGSE for this study.
Proc. of SPIE Vol. 11852 118523L-14
Downloaded From: https://www.spiedigitallibrary.org/conference-proceedings-of-spie on 27 Oct 2021
Terms of Use: https://www.spiedigitallibrary.org/terms-of-useICSO 2020 Virtual Conference
International Conference on Space Optics 30 March-2 April 2021
Figure 13. Setup overview of the In-flight ISRF breadboarding
A Bruker Vertex 80v vacuum FTS (Fourier Transform Spectrometer) will be used as an interferometric spectrally
filtered light source (a QTH lamp will be used covering VIS and NIR ranges from 400-2500 nm) to illuminate the
integrating sphere. The forward output homogenised light goes into the Tropolite push-broom spectrometer (320 - 500
nm) telescope, illuminating a limited number of spatial pixels and goes as well into the fibre-coupled Hamamatsu mini-
spectrometer (200 - 800 nm spectral range).
The FTS instrument uses a HeNe laser (which cannot be switched off) as metrology for controlling its OPD and for
active mirror alignment. For reaching the OPD knowledge goal, a different setup was used with a simple Michelson
interferometer without active metrology resulting in large (> 10 μm) OPD deviations from the expected linear behaviour.
In addition to the white light source, a HeNe laser was used simultaneously as light source, allowing verification of the
OPD determination.
4.2 Derivation of OPD from measured interferogram data
The interferogram was measured by collecting spectra obtained by the spectrometer under test at each of the OPD
positions imposed by the interferometer. At zero path difference of the interferometer the spectrometer is expected to see
the unmodified spectrum of the incoming light (e.g. an incandescent lamp continuous spectrum), affected by the spectral
transmissivity features of the interferometer and spectrometer, and the spectral quantum efficiency of the detector in the
spectrometer. At non-zero OPD, a spectral modulation on the spectrum is expected, with faster modulation as the OPD
increases. For a non-ideal interferometer, wavelength dependence of the ZPD position is expected (due to e.g. dispersion
of glass used for the beam splitter and corner cubes, in combination with non-perfect alignment). This will result in a
spectrally modulated spectrum even at “zero” OPD position.
The frequency and phase of the spectral modulations on the observed spectrum are directly coupled to the OPD.
Provided the input spectrum is known, as well as the ISRF of all pixels of the spectrometer, a very accurate
determination of the a posteriori effective OPD can be derived from the spectrum, see for an example Figure 14.
Proc. of SPIE Vol. 11852 118523L-15
Downloaded From: https://www.spiedigitallibrary.org/conference-proceedings-of-spie on 27 Oct 2021
Terms of Use: https://www.spiedigitallibrary.org/terms-of-useICSO 2020 Virtual Conference
International Conference on Space Optics 30 March-2 April 2021
Figure 14. OPD fit (blue line) to the measured spectrum (black asterisks) at OPD=2004.6 nm
Figure 15 shows an example of an interferogram obtained with a simple (unbalanced) beam splitter, a translation stage
with irregular motion, and a commercially off-the-shelf Hamamatsu mini spectrometer. A fibre-fed incandescent lamp
was used for illumination. The interferogram is for this image corrected for the average spectrum, resulting in
oscillations around 0 (medium grey in the image).
Figure 15. Interferogram data of a simple interferometer with a Hamamatsu spectrometer. The horizontal axis shows the
OPD dimension, the vertical axis shows the spectrometer pixel dimension, with short wavelength pixels towards the bottom
The measured interferogram was modelled using the FROID method (Fourier Reconstruction of Optical Interferometer
Data [9].
The model uses as input the following parameters:
x A model wavelength grid
x For each of the detector pixels modelled:
o a spectrum at the model wavelength grid (normalised to unity)
o an intensity offset for the interferogram
o an intensity scaling term for the interferogram
o a Zero Path Difference shift
o A linear slope with OPD
o A quadratic term with OPD
x Dispersion of the interferometer at the model wavelength grid (responsible for spectral dependence of the Zero
Path Difference)
Proc. of SPIE Vol. 11852 118523L-16
Downloaded From: https://www.spiedigitallibrary.org/conference-proceedings-of-spie on 27 Oct 2021
Terms of Use: https://www.spiedigitallibrary.org/terms-of-useICSO 2020 Virtual Conference
International Conference on Space Optics 30 March-2 April 2021
x For each of the measured spectra, an OPD position of the interferometer at the time that spectrum was recorded
x A non-linearity term for the spectrometer detector
This way, the model can describe the interferogram as measured, including all relevant aspects affecting the data. In
order to speed up (initial) processing, subsets in pixel- and / or OPD sample dimensions can be selected.
In brief, a best fit solution of the model to the measurements is determined by iteratively improving previous model
values for the spectra observed by each pixel and the OPD position at each spectrometer read-out. This yields ZPD
values which may be different for each spectrometer pixel, which are subsequently described by an appropriately smooth
and continuous function for the (wavelength dependent) dispersion of the interferometer, minimising the residual ZPD
values needed for each spectrometer pixel.
The OPD values derived this way were compared with the expected interferogram caused by the HeNe laser. Assuming a
wavelength for this laser of 632.816 nm a systematic scaling factor of the OPD was found of about 1+2.3e-6. Since no
constraint was built in the fitting routine, a non-unity scaling factor for the OPD and wavelength axis is expected.
Removing the effects of the OPD scaling, Figure 16 shows the differences between the OPD as expected from the HeNe
laser interferogram and that extracted from the white light part of the interferogram. The large peak around ZPD is the
result of mixing of white light and HeNe laser interferograms and can be disregarded. The discontinuity around -370 μm
and +370 μm was observed from the fit residuals and is the result of incomplete convergence of the fit routine.
Convergence is very slow at OPD values where very little fringe contrast is present in the interferogram. The OPD
differences are clearly not randomly distributed and show somewhat periodic structures at various scales. E.g. in the
OPD range between 110 μm and 370 μm (at an OPD scale of 260 μm and smaller), the standard deviation of the
differences is 2.6 nm RMS, but after removal of a 20th order polynomial (resulting in OPD scales of 13 μm and smaller),
the RMS difference drops to 1 nm.
Figure 16. Difference between retrieved OPD and HeNe laser line fit, after scaling the OPD
Proc. of SPIE Vol. 11852 118523L-17
Downloaded From: https://www.spiedigitallibrary.org/conference-proceedings-of-spie on 27 Oct 2021
Terms of Use: https://www.spiedigitallibrary.org/terms-of-useICSO 2020 Virtual Conference
International Conference on Space Optics 30 March-2 April 2021
Figure 17. Averaged fit residuals of the measurement - model, as function of measurement intensity. The model did not take
into account non-linearity, which shows up here as a systematic fit residual
Figure 17 shows the average fit residuals as function of measured intensity. Overall, the fit residuals are small and close
to zero, but above 14000 BU a systematic deviation occurs that increases towards higher signal levels. This can be
ascribed to spectrometer detector non-linearity (0.35% at 20000 BU) and is one of the spin-offs of this analysis, in
addition to the ISRFs of all the spectrometer pixels.
4.3 Interferogram subsampling
In-flight measurement time of the ISRF is limited by the frame rate of a well-exposed spectrum times the number of
measurements required to derive the ISRF. In practice, it is desirable to measure the ISRF in a fraction of an orbit
(lasting typically about 1.5 hours for a Low Earth Orbit), thus the requirement to perform the relevant ISRF
measurements within 3200 samples. However, a full scan at the required resolution and wavelength range requires
considerably more samples. By taking larger OPD steps while maintaining the full OPD scan range, the resolution of the
retrieved ISRF is maintained but due to the larger steps it is aliased to longer wavelengths. Without prior information, it
is not possible to distinguish the original wavelength from the aliased wavelength. However, a coarse wavelength
calibration of the spectrometer pixels (e.g. design values) is sufficient to provide the correct information to extract the
ISRF at the correct wavelength.
A full OPD scan at 10000 samples was performed, from which the ISRF was extracted for a sample pixel at wavelength
773 nm (Figure 18, black curve). The same data set was decimated by selecting one in every 4 OPD samples, causing
aliasing. The FROID method was provided with prior information on the approximate wavelength of the pixel, after
which the ISRF was extracted for the sub-sampled data set (Figure 18, green curve). The absolute difference between the
two ISRFs is shown as the dashed black curve, as well as the 1% goal value for the ISRF knowledge.
Since the number of points used in the full scan is 4 times higher than that of the sub-sampled scan, the signal to noise
ratio in the ISRF is expected to be higher in the full scan, which explains part of the difference between the two curves.
The RMS difference between the full and aliased ISRF is 0.3% in this example. For pixels at other wavelengths the
difference ranges between 0.10 and 0.9 %.
Proc. of SPIE Vol. 11852 118523L-18
Downloaded From: https://www.spiedigitallibrary.org/conference-proceedings-of-spie on 27 Oct 2021
Terms of Use: https://www.spiedigitallibrary.org/terms-of-useICSO 2020 Virtual Conference
International Conference on Space Optics 30 March-2 April 2021
Figure 18. Full scan (black) and aliased (green) ISRF of pixel 1845 at 773 nm, as well as the absolute difference between the
two ISRFs (dashed curve) and the 1% goal (dashed horizontal line)
5. CONCLUSIONS
The new generation of atmosphere-sensing instruments requires a very accurate knowledge of the ISRF when in flight.
Solutions have been investigated for an on-board ISRF-calibration system, and the best solution identified appears to be
a Fourier Transform Spectrometer.
Advantages of this solution are a large spectral coverage from deep blue to SWIR wavelength, an excellent spectral
resolution, a good immunity to noise.
The FTS however usually suffers from a low sensitivity, a high complexity and a huge volume of data produced.
We have devised a simple and robust system that should rule out these difficulties:
- A direct illumination provides for a high signal and a high SNR
- The a priori knowledge of the spectral response of the instrument allows to significantly undersample the
interferograms hence to reduce the volume of data
- A sophisticated analysis software, in which the interferogram is simulated using a priori knowledge and actual
OPD is determined through a best fit approach, allows to get rid of the OPD metrology system that is usually
the main source of complexity in FTS hardware. The OPD accuracy evidenced in breadboard measurements
demonstrated an improvement of OPD knowledge from >10 μm to the nm level.
A preliminary design has been established, and first runs of the data processing have been done on experimentally
acquired data. All this sounds promising, and we look forward to go on with an elegant breadboard of the hardware,
which would also be used to get experimental data on which to exercise our analysis software.
AKNOWLEDGEMENT
This work has been realised in the frame of the ESA contract 4000126068/18/NL/AR: Concepts for the in-orbit
characterisation of the Instrument Spectral Response Function.
Proc. of SPIE Vol. 11852 118523L-19
Downloaded From: https://www.spiedigitallibrary.org/conference-proceedings-of-spie on 27 Oct 2021
Terms of Use: https://www.spiedigitallibrary.org/terms-of-useICSO 2020 Virtual Conference
International Conference on Space Optics 30 March-2 April 2021
REFERENCES
[1] New method to determine the instrument spectral response function, applied to TROPOMI-SWIR, R. van Hees
et al., Atmospheric Measurements Techniques Discussions, December 2017
[2] Compact optical frequency comb source based on a DFB butt-coupled to a silicon nitride microring, S. Boust et
al., 2019 International Topical Meeting on Microwave Photonics (MWP), Ottawa, ON, Canada, 2019, pp. 1-4.
DOI: 10.1109/MWP.2019.8892102
[3] Octave Spanning Frequency Comb on a Chip, P. Del’Haye et al., Conference on Lasers and Electro-Optics,
OSA, 2010
[4] Octave Spanning Frequency Comb generation in a silicon nitride chip, Y. Okawachi et al., Optics Letters Vol
36 No. 17, 2011, 3398-3400
[5] Frequency comb generation in the green using siliocon nitride microresonators, L. Wang et al., Laser Photonics
Rev. 10, No.4, 631-638 (2016), DOI 10.1002/lpor.201600006
[6] Visible Kerr comb generation in a High-Q silica microdisk resonator with a large wedge angle, J. Ma et al.,
Photonics Research Vol 7 No. 5, 2019, 573-578
[7] Spectral test and calibration of the atmospheric infrared sounder, M.H. Weiler et al., Proc. SPIE 4483 (2002),
44-52, doi: 10.1117/12.453471
[8] An on-board calibration assembly (OBCA) on the ENMAP satellite, L. Wilkens et al., ICSO 2016, Proc. SPIE
Vol 10562, doi: 10.1117/12.2296123
[9] Initial results from the USNO dispersed fourier transform spectrograph. Hajian, A. R., et al. 2007, The
Astrophysical Journal. [astro-ph/0611495] Initial Results from the USNO Dispersed Fourier Transform
Spectrograph (arxiv.org)].
Proc. of SPIE Vol. 11852 118523L-20
Downloaded From: https://www.spiedigitallibrary.org/conference-proceedings-of-spie on 27 Oct 2021
Terms of Use: https://www.spiedigitallibrary.org/terms-of-useYou can also read