Quality Parameters, Caffeine and Theobromine Contents and Antioxidant Activity of Artisan and Commercial Chocolate from Brazil
←
→
Page content transcription
If your browser does not render page correctly, please read the page content below

Open Access Library Journal
                                                                                                          2021, Volume 8, e7377
                                                                                                         ISSN Online: 2333-9721
                                                                                                           ISSN Print: 2333-9705

Quality Parameters, Caffeine and Theobromine
Contents and Antioxidant Activity of Artisan
and Commercial Chocolate from Brazil

Maria Cristina Marcucci1*, Andiara Gonçalves Ferreira da Silva2, Carolina Passarelli Gonçalves2,
Alexandra Christine Helena Frankland Sawaya3, Roberta Caroline Bruschi Alonso4,
Marciano Marques de Oliveira5, Douglas Fernandes Barbin5
1
  Institute of Science and Technology, UNESP, São Jose dos Campos, São Paulo, Brazil
2
  Postgraduate Program in Pharmacy and Biotechnology Anhanguera University of São Paulo, Pirituba, Avenida Raimundo Perei-
ra de Magalhães, Pirituba, São Paulo, SP, Brazil
3
  Department of Plant Biology and Faculty of Pharmaceutical Science, State University of Campinas, UNICAMP, Campinas, SP,
Brazil
4
  Metropolitan University of Santos, UNIMES, Santos, SP and Nucleus of Technological Research (NPT), University of Mogi das
Cruzes, UMC, SP, Brazil
5
  Faculty of Food Engineering, State University of Campinas, UNICAMP, Campinas, SP, Brazil

How to cite this paper: Marcucci, M.C., da    Abstract
Silva, A.G.F., Gonçalves, C.P., Sawaya,
A.C.H.F., Alonso, R.C.B., de Oliveira, M.M.   Several types of chocolate were analysed: bitter, half-bitter, milk chocolate,
and Barbin, D.F. (2021) Quality Parameters,   70% cocoa, white chocolate and cocoa seeds. Analysis of fat, insoluble solids,
Caffeine and Theobromine Contents and
                                              total phenols, theobromine and caffeine contents and antioxidant capacity
Antioxidant Activity of Artisan and Com-
mercial Chocolate from Brazil. Open Access    were carried out to evaluate the quality of artisan and commercial chocolate
Library Journal, 8: e7377.                    products in Brazil. Fat contents and insoluble residues were similar to those
https://doi.org/10.4236/oalib.1107377         reported in the literature. We develop a simple method by HPLC-DAD
Received: April 1, 2021
                                              (High-Performance Liquid Chromatography with Diode-Array Detection) to
Accepted: May 28, 2021                        quantify methylxanthines whose identification has been confirmed by UPLC-
Published: May 31, 2021                       MS (Ultra performance liquid chromatography—mass spectrometer). The
                                              levels of phenols, caffeine and theobromine varied between types. White
Copyright © 2021 by author(s) and Open
Access Library Inc.                           chocolate had no phenolics nor caffeine or theobromine. The ones with the
This work is licensed under the Creative      highest phenolic contents were those with the highest cocoa mass content.
Commons Attribution International             The same happened with the antioxidant activity, which is correlated to the
License (CC BY 4.0).
http://creativecommons.org/licenses/by/4.0/
                                              amount of phenolics, caffeine and theobromine, shown by the statistical
                Open Access                   analysis. It is the presence of cocoa that determines the antioxidant activity of
                                              chocolates. This work contributed to the confirmation of the properties of the
                                              chocolates, highlighting the importance of the artisan product. Chocolates are
                                              important for human health and are considered functional foods.

DOI: 10.4236/oalib.1107377 May 31, 2021                          1                                   Open Access Library Journal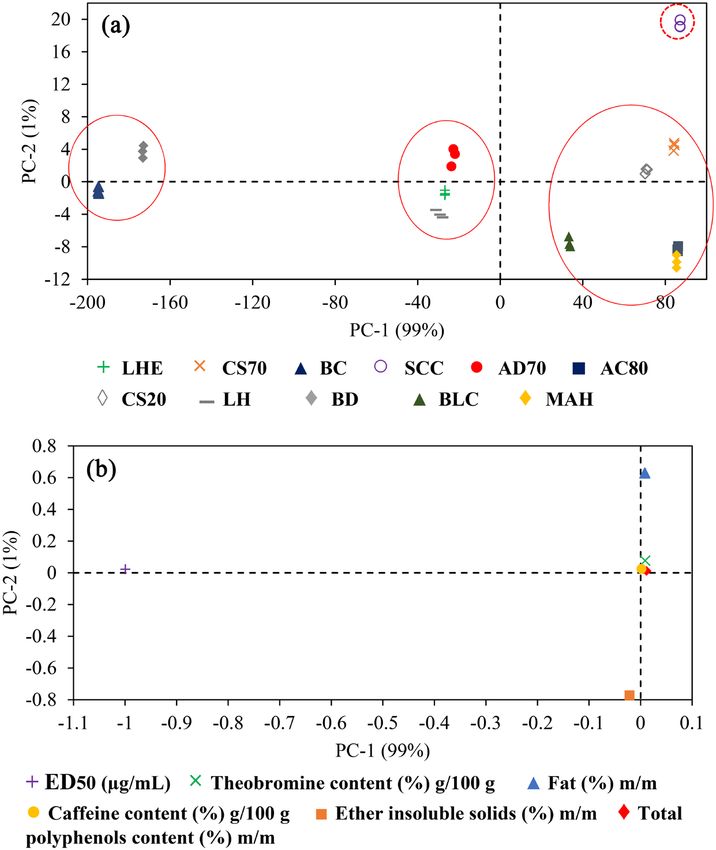
M. C. Marcucci et al.

                               Subject Areas
                               Food Science & Technology

                               Keywords
                               Artisan and Commercial Chocolates, HPLC/UPLC, Theobromine, Caffeine,
                               Antioxidant Activity

                             1. Introduction
                             Chocolate is a solid dispersion of cocoa seeds (Theobroma cacao), sugar par-
                             ticles, additives, cocoa butter, lecithin and flavourings, giving an average of 568
                             kcal/100g (Leite, 2012 [1]; Godočiková et al., 2019 [2]). The Mayan and Aztec
                             people, in South America, where the first to document its use. Chocolate and
                             cocoa seeds have several medicinal applications, such as: stimulating the nervous
                             system, the stomach and kidneys activity, treating fever, tuberculosis, treating
                             low virility and anaemia, against mental fatigue, including cardiovascular bene-
                             fits, among others (Efraim et al., 2011 [3]; Vicentim & Marcellino, 2012 [4]; Ke-
                             rimi & Williamson, 2015 [5]; Magrone et al., 2017 [6]; Anwar et al., 2018 [7];
                             Kardum & Glibetic, 2018 [8]; Stanley et al., 2018 [9]; Coutinho et al., 2019 [10];
                             Godočiková et al., 2020 [11]). Chocolate is known to contain polyphenols and
                             flavonoids (Counet et al., 2006 [12]; Alvarez-Barreto et al., 2018 [13]; Muham-
                             mad et al, 2018 [14]) and these compounds are in higher concentrations in bitter
                             chocolate, presenting greater health benefits and antioxidant activity (Lee et al.,
                             2003 [15]; Hu et al., 2016 [16]; Mudenuti et al., 2018 [17]; Tafurt et al., 2021
                             [18]).
                                Chocolate is a good source of polyphenols (Torres-Moreno et al., 2012 [19];
                             Hu et al., 2016 [16]) such as epicatechin and catechin, along with the proantho-
                             cyanin oligomers (Gu et al., 2004 [20]; Gu et al., 2006 [21]; Vinson et al., 2006
                             [22]; De Oliveira & Genovese, 2013 [23]; Cambrai et al., 2017 [24]; Martini et al.,
                             2018 [25]; Fayeulle et al., 2019 [26]) and alkaloids, such as theobromine and
                             phenethylamine (Gopalakrishnan et al., 2021) [27]. These molecules can func-
                             tion as primary antioxidants, directly reducing the formation of free radicals (Hu
                             et al., 2016 [16]; Mudenuti et al., 2018 [17]). Chocolate also contains vitamins A,
                             B, C, D, and potassium, sodium, iron, calcium, magnesium, phosphorous, man-
                             ganese, copper, zinc and selenium (Leite, 2012 [1]; Torres-Moreno, Torrescasa-
                             na et al., 2015 [28]; Oliveira et al., 2021 [29]). In milk chocolate, the cocoa mass
                             is partly replaced by milk powder, giving it a sweeter taste. Milk chocolate or
                             half-bitter chocolate contain between 40% and 53% cocoa butter. A bar of choco-
                             late (30 g) contains an average of 165 calories and between 2 to 3 g of protein. Bit-
                             ter chocolate, has a high concentration of cocoa mass and low sugar content. It is
                             made with cocoa paste and cocoa butter. It is less refined, having a characteristic
                             dark colour and bitter taste, are due to the reduced sugar content. Half-bitter

DOI: 10.4236/oalib.1107377                         2                                   Open Access Library Journal
M. C. Marcucci et al.

                             chocolate is slightly refined with a dark colour. It does not contain milk, but
                             contains sugar, and has a less bitter taste, presenting and about 550 kcal/100g.
                             Some people use chocolate as a form of self-medication to compensate for nu-
                             trient deficiency, probably magnesium. Chocolate and cocoa have an exception-
                             ally high concentration of this mineral (100 mg/100g and 250 mg/100g, respec-
                             tively) and in some Mg cases supplementation reduces chocolate compulsions
                             and decreases the symptoms of premenstrual tension (Del Rei & Medeiros, 2011
                             [30]; Grassia et al., 2019 [31]).
                                CEPLAC (Executive Committee for Cacao Crops), in Ilhéus, Bahia, Brazil, has
                             the mission of promoting the competitiveness and sustainability of the agricul-
                             tural, agroforestry and agroindustry segments for the development of cocoa
                             producing regions, producing artisan chocolates with high cocoa content. It is an
                             organ of the Brazilian Ministry of Agriculture, created on February 20, 1957,
                             when the cocoa economy was going through a serious crisis, initially focusing on
                             supporting cacao farmers. It succeeded in increasing the Brazilian cocoa produc-
                             tion by 310%; from 220 kg/ha in 1962 to 740 kg/ha in 2016, among others. The
                             current priority is the recovery of the regional economy, with emphasis on
                             fighting a disease that has been decimating the cacao plantations known as
                             "witch-broom" and aiming to develop sustainable agroeconomic activities and
                             preserving the remaining forest fragments of two strategic ecosystems in Brazil,
                             the Atlantic Forest and the Amazon Forest (Ceplac, 2021) [32].
                                Brazilian laws determine that chocolate must have at least 25% cocoa. One in
                             three chocolate-based products in Brazil does not contain this amount of cocoa
                             and therefore cannot be considered chocolate (Lima et al., 2011) [33]. It is esti-
                             mated that roughly 35% of the common chocolates on the shelves, produced by
                             large food companies, are really chocolate candy. Many products claim to have a
                             high percentage of cocoa, which is not always the case, since there is no supervi-
                             sion to guarantee the information on the label. Furthermore, it is not compul-
                             sory by law to declare the amount of cocoa in the product. Instead, these candies
                             contain high amounts of sugar and fat (Leite, 2012 [1]; Seem et al., 2019 [34]).
                             Countries in Europe and the United States have informative legislation on the
                             composition of chocolates (European Union, 2000 [35]; Rodriguez-Negrette et
                             al., 2019 [36]).
                                The present work aimed at analyzing the properties of chocolates, especially
                             that produced by CEPLAC, determining, among other parameters, the fat con-
                             tent, caffeine, theobromine and antioxidant activity, as well as the correlations
                             between the evaluated parameters.

                             2. Materials and Methods
                             2.1. Chemicals and Reagents
                             All reagents employed were at least analytical grade: ethyl ether, ethanol, 16N
                             HCl, sodium carbonate and sodium tartrate (Synth, Brazil), barium oxide (Ve-
                             tec), universal indicator, Folin-Ciocalteau reagent, Merck (Darmstadt, Germa-

DOI: 10.4236/oalib.1107377                        3                                  Open Access Library Journal
M. C. Marcucci et al.
ny), 0.45 μm filters (Sartorius, USA). Gallic acid, caffeine and DPPH (radical
diphenylpicrylhydrazyl) were from Sigma-Aldrich (St. Louis, USA). Methanol
and formic acid were HPLC (High-Performance Liquid Chromatography) grade
from (Merck, Darmstadt, Germany), deionized water (18.2 MΩ/cm) was pre-
pared using a Banrsted apparatus (VWR, USA).
2.2. Chocolate Samples
The following nine samples of commercial chocolates were analyzed: bitter 70%
cocoa (AD70), white C (BC), white D (BD), Belgian milk (BLC), milk 20% cocoa
(CS20), milk 70% of cocoa (CS70), milk H (LH), milk HE (LHE), bitter medium
(MAH); as well as artisan chocolate (80% bitter CEPLAC (AC80)) and cocoa
powder CEPLAC (SCC).
2.3. Fat Extraction
An aliquot of 15 g of each sample was packed in a pre-weighed cartridge. 200 mL
of ethyl ether was used in a soxhlet apparatus for two hours. After extraction, the
solvent was evaporated leaving only the fat, which was quantified. The fat-free
dry matter, called insoluble solids, was also quantified. The procedure was per-
formed in triplicate.
2.4. Preparation of Solutions
The dried fat-free samples were ground and exactly about 0.1 g of the sample
powder was weighed and dissolved in ethanol to give the 0.1% solutions used in
tests for antioxidant activity and total phenolics. For the chromatographic analy-
sis, the solutions were prepared as follows: 1.25 g of barium oxide (BaO) were
weighed for each chocolate sample plus 2.5 g of the chocolate powders, then 1.25
mL of water was added, and boiled on the heating plate. After 10 minutes the
mixture was removed and the pH adjusted to 7 with concentrated HCL. It was
then transferred to a 250 mL volumetric flask completed with water and filtered
through paper.
2.5. Determination of the Total Phenolic Content
An aliquot of 0.1 g of the fat-free sample powder was dissolved in a beaker with a
little water, transferred to a 50 mL volumetric flask and the volume was made up
with water (stock solution: 2 mg/mL). The procedure was performed from this
point in triplicate. An aliquot of 200 µL was transferred to a 10 mL volumetric
flask (1:50) containing approximately 5 mL of distilled water. 800 mL of the Fo-
lin-Ciocalteau reagent was added and stirred for a few seconds and in an interval
of 1 to 8 minutes 1.2 mL of the 20% sodium carbonate-tartrate solution was
added. The volume of water was completed until near the meniscus. The solu-
tion was kept in a 20˚C bath. After 2 hours, the final volume was completed at
20˚C. It was shaken for a few seconds and read at 760 nm (in a Cary 50, Varian
Inc spectrophotometer, USA). The value of total phenolics was determined by
DOI: 10.4236/oalib.1107377 4 Open Access Library JournalM. C. Marcucci et al.
comparison to a calibration curve with gallic acid. The same procedure was used
for the quantification of phenolics in chocolates extracted with BaO. The proce-
dure was performed in triplicate.
2.6. HPLC-DAD Conditions
The samples were stored in vials for HPLC analysis using LaChrom chromato-
graph, model D-7100, L-7100 pump, L-7200 automatic sampler and L-7455 di-
ode array detector (Merck, Darmstadt, Germany). To determine theobromine
and caffeine in the chocolate samples, a reverse phase C18 column (Gemini
00F-4435-E0, 110A RP 18, 12.5 × 0.4 cm, 5 μm particle diameter Merck,
Darmstadt, Germany) with pre-column (Safety Guard Cartridges Kit KJO-4282,
Merck, Darmstadt, Germany) and a isocratic system (1 mL/min flow) composed
of water acidified with 0.5% formic acid (85%) and methanol (15%), was used.
The volume injected was 50 μL. The maximum time of analysis was 10 minutes
and detection performed at a wavelength of 272 nm. The program used for data
analysis was the Merck-Hitachi model D-7100 (Chromatography Data Station -
DAD Manager, Merck). The samples (1% chocolate ethanolic solution) were
dissolved in methanol, filtered on a 0.45 μm filter and injected into HPLC-DAD
(Matsume et al., 2000 [37]; De Maria & Moreira, 2007 [38]).
Caffeine and theobromine (methylxanthines) were quantified using the HPLC
method described by comparison to an external calibration curve of caffeine
standard, using the least squares method (triangle equation) and averaged, stan-
dard deviation, coefficient of variation (%) and uncertainty. In the linearity, the
residuals were also calculated (Ribeiro et al., 2008) [39].
2.7. UHPLC-MS Conditions
UHPLC-MS (Ultra-high performance liquid chromatography mass spectrome-
try) chromatography was performed on a Waters Acquity UPLC instrument us-
ing a Waters C-18 column (50 mm × 2 mm, 1.7 μm particle) with oven at 30˚C.
Solvent A = milli-Q water with 0.1% formic acid and solvent B = methanol, 3 μL
injection, 0.2 mL/min flow, gradient starting with 90% A, ramping to 0% A in 5
minutes, held until 5.50 minutes, then back to 90% A at 5.51 minutes, and equili-
brated until 6.00 minutes, with a total run time of 6.00 minutes. Samples were
compared to the caffeine, theobromine and theophylline standards by UHPLC-MS
(Waters Acquity TQD mass spectrometer (USA). The mass spectrometry condi-
tions were: electrospray ionization, positive ion mode, capillary 3.0 kV, cone 30
V, source temperature 150˚C, desolvation gas temperature 300˚C, collision
energy 25V (in MS/MS mode). The presence of caffeine and theobromine were
identified due to peaks in the sample with the same retention time as the stan-
dards, and confirmed by MS/MS.
The use of the method described above for the UHPLC was carried out to
capture data that require more sensitive devices, than the conventional analysis
performed by HPLC. Both methods developed in this study for UHPLC-MS and
DOI: 10.4236/oalib.1107377 5 Open Access Library JournalM. C. Marcucci et al.
HPLC-DADUV were separately validated.
2.8. Antioxidant Activity
The method was based on a free radical scavenging reaction using the diphenyl-
picrilhydrazyl radical (DPPH). Wells were numbered from 0 to 10 in a 24-well
plate. Corresponding ethanol volumes were added into each of the various tubes
and various volumes of the 0.01% chocolate ethanolic solution. A volume of
DPPH (0.15 mM) was then added, with a one-minute interval between tubes,
and these were shaken sporadically. The absorbance was read at 517 nm on a
Cary 50, Varian Inc spectrophotometer (USA) 30 minutes after addition of
DPPH in the first tube, and so on. The absorbance vs. chocolate concentration
plot was built and the ED 50 (dose eliminating 50% free radicals) calculated by
the least squares method. The procedure was performed in triplicate (Veiga et
al., 2017) [40].
2.9. Statistical Analysis
The fat content, insoluble solids, phenol content, theobromine content, caffeine
content and antioxidant activity (ED50) data were submitted to the Shapiro-Wilk
normality test. Once the normality of the distribution was verified, the data were
submitted to analysis of variance (ANOVA) and Tukey test with significance
level of 5%, considering the type of chocolate. PAST software Version 3.22 was
used (Hammer, Harper & Ryan, 2001) [41].
A matrix containing the data from the various tests, with the lines representing
the samples and the columns the variables, was analyzed by Principal Compo-
nent Analysis. In the present work the software Uscrambler X10.4, 2016 (CAMO
AS, Trondheim, Norway) was used.
3. Results and Discussion
The following parameters of chocolate quality were evaluated in the present
work: fat content, total phenolics, theobromine and caffeine (methylxanthines)
content and antioxidant activity. Table 1 shows the values obtained for choco-
late samples and cocoa bean powder.
It can be seen (Table 1) that SCC presented a significantly higher fat concen-
tration (% w/w) than all the chocolate samples. The AC80 presented significantly
lower fat concentration than SCC and the others, with the exception of MAH
and BLC. Among the chocolate samples, AD70, CS70 and CS20 presented the
highest concentrations of fat (% w/w). Cocoa bean powder showed the highest
fat content, 33.40%. Leite (2012) [1] evaluated the fat content in toasted cocoa
beans, finding values between 32.60% and 36.52%, similar to our result. For the
cocoa mass, the same author found values from 52.95% to 58.17% and for choc-
olates, values between 37.87% and 45.50% were found. De Melo et al. (2020) [42]
reported that the percentage of fat varies between 35.1% to 41.8%. The fat con-
tent found for chocolates in our study was between 15.51% to 25.51%, values
DOI: 10.4236/oalib.1107377 6 Open Access Library JournalM. C. Marcucci et al.
Table 1. Amount of fat (% w/w), dried residue (DR) (% w/w) and total phenolic content (% w/w) in chocolate samples and cocoa
beans.
Chocolate Fat* Dried residue (DR) after extraction with ether* Total polyphenol content*
sample % (w/w) CV% Unc. % (w/w) CV% Unc. % (w/w) CV% Unc.
AC80 15.54 ± 0.11 e
0.73 0.07 80.50 ± 0.41 b
0.51 0.24 4.21 ± 0.01ª 0.21 0.01
AD70 25.51 ± 0.25b 0.99 0.15 76.27 ± 0.54d 0.71 0.31 3.22 ± 0.03c 0.84 0.02
BC 18.35 ± 0.17d 0.90 0.10 81.50 ± 0.50ab 0.61 0.29 0.06 ± 0.01e 15.71 0.01
BD 21.52 ± 0.46c 2.14 0.27 77.25 ± 0.61cd 0.79 0.35 0.31 ± 0.00e 0.78 0.00
BLC 16.40 ± 0.44e 2.70 0.26 81.50 ± 0.50ab 0.61 0.29 1.87 ± 0.05d 2.64 0.03
CS20 23.29 ± 0.30 bc
1.30 0.17 74.63 ± 0.40 d
0.54 0.23 2.03 ± 0.06 d
2.81 0.03
CS70 24.50 ± 0.35 b
1.43 0.20 71.49 ± 0.38 e
0.54 0.22 3.60 ± 0.06 b
1.75 0.04
LH 19.71 ± 0.03 cd
0.16 0.02 81.58 ± 0.55 ab
0.67 0.31 2.70 ± 0.04 d
1.41 0.02
LHE 19.62 ± 0.31 d
1.58 0.18 78.06 ± 0.39 c
0.49 0.22 2.00 ± 0.07 d
3.71 0.04
MAH 15.51 ± 0.12 e
0.76 0.07 82.60 ± 1.11ª 1.34 0.64 3.17 ± 0.17 c
5.29 0.10
SCC 33.40 ± 0.29a 0.85 0.16 59.53 ± 0.50f 0.84 0.29 3.70 ± 0.01b 0.32 0.01
*Average of three measurements.CV% is the percentile variation coefficient and Unc. the uncertainty of the measurements, calculated by the standard devi-
ation/square root of the number of measurements. The same letters in each column indicate that there is no statistical difference at a significance level of 5%,
according to the Tukey Test results.
slightly lower than those reported by Leite (2012) [1] and De Melo et al. (2020)
[42]. As expected, the bitter and half-bitter chocolates presented the lowest fat
contents. In the same extraction process with ethyl ether, the solid residue con-
tent was measured after extraction. The values are also presented in Table 1.
These values ranged from 59.53% to 82.60%. SCC presented insoluble solids
concentration (% w/w) which was significantly lower than all chocolates. AC80
showed a significantly higher concentration of insoluble solids than SCC and
AD70, CS70, LHE, CS20 and BD chocolate samples. The HAM sample showed a
higher concentration of insoluble solids than the AC80 sample. The CS70 sam-
ple, on the other hand, had the lowest concentration of insoluble solids.
The total phenolic content was initially measured in the dry extract, after ex-
traction with ethyl ether however, only five samples were evaluated: AD70 (total
phenolic content of 2.48% ± 0.11%), BD (0.00% ± 0.00%), BLC (0.31% ± 0.17%),
LH (0.36% ± 0.01%) and MAH (0.77% ± 0.36%). After this initial evaluation, the
use of BaO for defatting the samples was implemented (Alves & Bragagnolo,
2002) [43] and all the samples were extracted. Total phenolic, caffeine and theo-
bromine contents were quantified in these BaO extracted samples. Table 2 shows
the total phenolic content for the samples extracted with BaO. AC80 total phe-
nolic content significantly higher than SCC and all other samples. SCC pre-
sented significantly higher total phenolic content than all samples, with the ex-
ception of CS70 and AC80. The bitter (AD70 and CS70) and the half-bitter
(MAH) samples presented significantly higher total phenolic content than the
milk chocolate samples (LH, LHE BLC and CS20) and white chocolate samples
(BD and BC). The white chocolate samples BC and BD presented significantly
DOI: 10.4236/oalib.1107377 7 Open Access Library JournalM. C. Marcucci et al.
lower total phenolic content than all the other chocolate samples tested. The
samples that presented the highest total phenolic content were cocoa seed
powder (3.70%) and those with higher cocoa content, which was expected (from
3.17% to 4.21%). The milk chocolates presented intermediate values and the
whites almost no phenolic content. White chocolates do not have cocoa mass in
their composition, only cocoa butter, which explains a virtually zero content of
polyphenols. Ramli et al. (2001) [44] determined the total phenolic content in
different samples of cocoa from Malaysia and Ghana, finding for beans, from
3.49% and 6.02%. Vertuani et al. (2014) [45] found values between 2.0% to 3.5%
for cocoa. In the present study, the amount found is approximately the same.
The values presented in Table 1 are in accordance with the data of these re-
searchers, except as previously mentioned, for white chocolate samples, which
do not have the cocoa mass.
Leite (2012) [1] analyzed the phenolic content in two varieties of cocoa mass
from the region of Ilhéus-BA and chocolates prepared with this same mass. For
the cocoa mass, the author phenolic content in the range of 2.39% to 2.58% and
for chocolates between 1.55% to 1.91%. Several authors have reported between
2.00% and 8.37% of phenolic content in natural cocoa powder (Waterhouse et
al., 1996 [46]; Serra-Bonvehí & Ventura Coll, 1997 [47]; Kealey et al., 2000 [48];
Natsume et al., 2000 [49]; Lee et al., 2003 [15], Vinson et al., 2006 [22]; Efraim et
al., 2011 [3]; Vertuani et al., 2014 [45]). For chocolates, from 0.26 to 4.85% (Hu
et al., 2016) [16] and 1.00% to 4.50% (Mudenutti et al., 2018) [17] have been re-
ported; while for bitter chocolate, between 0.246% and 2.39% (Waterhouse et al.,
1996 [46]; Natsume et al., 2000 [49]; Vinson et al., 2006 [22]; Counet et al., 2006
[12]), and for milk chocolate from 0.192 to 0.990% (Waterhouse et al., 1996 [46];
Gu et al., 2006 [21]; Vinson et al., 2006 [22]). For cocoa liquor, values of 0.367%
to 8.52% (Adamson et al., 1999 [50]; Kealey et al., 2000 [48]; Luna et al., 2002
[51]) and 2.84 ± 0.24 (De Oliveira & Genovese, 2013) [23] were reported. Nat-
sume et al. (2000) [49] found 6.04% of phenolic content in Brazilian cacau liq-
uor, but its geographic origin was not reported.
The range of total polyphenol content for milk chocolate and bitter chocolate
found by Efraim et al. (2011) [3] are lower than the values found in the present
work for the same types of chocolates. However, the reported value for cocoa is
within the range reported by the same authors for this product. Efraim et al.
(2011) [3] citing Ramirez-Sanchez et al. (2010) [52] reported that phenolic con-
tent in cocoa may vary according to its geographical origin, plant variety, cli-
mate, soil type and planting area. The different steps of the transformation of
cocoa into chocolate may also influence the phenolic content in the final prod-
uct. With respect to the quantification of theobromine and caffeine, Figure 1
shows the chromatogram of one of the samples analyzed.
After using barium oxide (BaO) as a fat extracting agent, caffeine and theo-
bromine were quantified using a calibration curve based on caffeine (Figure 1).
Theobromine has the same UV-Vis spectrum of caffeine (in the HPLC spectra
DOI: 10.4236/oalib.1107377 8 Open Access Library JournalM. C. Marcucci et al.
Figure 1. Chromatogram of the 80% cocoa chocolate sample from CEPLAC. The arrows indicate the peaks for mehtyl-
xanthines (theobromine and caffeine) and their retention times in minutes (Rt).
library), but with different retention time, therefore, the proposal was to quanti-
fy theobromine by the caffeine area. Figure 2(a) shows the UHPLC-MS that
confirm of the presence of both theobromine and caffeine in the samples of
chocolates, in comparison with standards. In Figure 2(b) are the mass spectra
(MS/MS) of the chocolate sample compared to the caffeine (Figure 2(c)) and
theobromine (Figure 2(d)) standards. Theobromine has a lower retention time
than caffeine in reverse phase HPLC because the former has a methyl group less
than the latter, facilitating its elution from the chromatographic column (Figure
1).
A calibration curve of the caffeine standard was constructed for quantification
of caffeine and theobromine by HPLC-DAD. From the confirmation of the
theobromine and caffeine peaks and also of the caffeine calibration curve, the
contents of these compounds were calculated in the chocolate samples. Table 2
shows the levels of theobromine and caffeine (g/100g) obtained in samples after
the BaO extraction.
The concentration of both theobromine and caffeine were higher in the sam-
ples when the barium oxide extraction method was used, indicating that the ba-
rium oxide method is much more efficient in extracting these methylxanthines
than when ethyl ether is used. Regarding the theobromine content, SCC pre-
sented a significantly higher percentage than all the chocolate samples. AC80
had significantly lower theobromine content than MAH, similar to CS70 and
superior to AD70, and to all milk chocolate samples (LH, LHE, BLC and CS20).
Theobromine was not detected in white chocolate samples (BD and BC). Re-
garding caffeine content, SCC presented significantly higher caffeine content
than all the other chocolate samples. The AC80 showed significantly higher theo-
bromine and caffeine content than all the other chocolate samples. Milk choco-
lates (LH, LHE, BLC and CS20) had significantly lower caffeine content
DOI: 10.4236/oalib.1107377 9 Open Access Library JournalM. C. Marcucci et al.
Figure 2. Positive ion mode UHPLC-MS chromatograms of the CEPLAC chocolate sample, showing retention times of theobro-
mine [M + H]+ ion (m/z 181) at 1.58 minutes and caffeine [M + H]+ ion (m/z 195) at 2.33 minutes (circles). (a) MS/MS spectra of
theobromine (m/z 181) and caffeine (m/z 195) in the chocolate sample (b) and of caffeine standard (c) and theobromine standard
(d). Full circles indicate the precursor ion of caffeine and dashed lines the precursor ion of theobromine.
than all bitter chocolate samples (AC80, AD70, CS70 and MAH). Caffeine was
not detected in white chocolate samples (BD and BC). Cacao seeds (SCC) pre-
sented higher caffeine and theobromine contents, higher than all evaluated
chocolates.
The results of theobromine and caffeine content presented a strong positive
correlation (R = 0.9297). Ramli, Yatim, Said & Hok (2001) [44] evaluated the
theobromine and caffeine content in different cocoa products: for cocoa liquor
from Malaysia and Ghana, they found 1.720% to 2.530% (w/w) of theobromine
and from 0.310% to 0.380% caffeine. For the cocoa beans from the same sites,
between 1.620% and 2.660% of theobromine and from 0.250% to 0.500% of
caffeine were found. The same authors evaluated these levels in cocoa powder in
Malaysia, reporting between 1.960% to 2.940% of theobromine and 0.330% to
DOI: 10.4236/oalib.1107377 10 Open Access Library JournalM. C. Marcucci et al.
Table 2. Theobromine and caffeine contents (%) in chocolate samples and cocoa beans
extracted with BaO.
Theobromine content * % (g/100g) Caffeine content* % (g/100g)
Average CV (%) Unc. Average CV (%) Unc.
AD70 1.73d ± 0.04 2.19 0.02 0.25e ± 0.01 2.34 0.00
AC80 1.92c ± 0.02 0.80 0.01 0.33ª ± 00 3.46 0.01
BC 0.00 ± 0.00
f
0.00 0.00 0.00 ± 0.00
i
0.00 0.00
BD 0.00 ± 0.00
f
0.00 0.00 0.00 ± 0.00
h
0.00 0.00
BLC 0.36e ± 0.01 2.78 0.01 0.02d ± 0.00 1.33 0.00
CS20 0.39 ± 0.01
e
2.99 0.01 0.10 ± 0.01
c
2.97 0.00
CS70 1.90 ± 0.02
b
0.80 0.01 0.20 ± 0.01
b
2.84 0.00
LH 0.47e ± 0.02 3.27 0.01 0.06g ± 0.01 2.19 0.00
LHE 0.40e ± 0.01 1.46 0.00 0.07f ± 0.01 2.66 0.00
MAH 2.82 ± 0.02
b
0.71 0.01 0.32 ± 0.01
ab
3.13 0.01
SCC 4.41ª ± 0.10 2.24 0.06 1.10ª ± 0.01 0.91 0.01
*Average of three measurements. CV% is the percentile variation coefficient and Unc. the uncertainty of
the measurements, calculated by the standard deviation/square root of the number of measurements. The
same letters in each column indicate that there is no statistical difference at a significance level of 5%, ac-
cording to the Tukey Test results.
0.55% of caffeine; for Malaysian chocolate with cocoa butter (brand I) from
0.080% to 0.100% theobromine and from 0.006% to 0.009% caffeine. Chocolates
from the same place with cocoa butter (brand II) presented theobromine and
caffeine contents from 0.036% to 0.065% and 0.003% to 0.006%, respectively.
The results presented in the present study are in line with those reported by
Ramli, Yatim, Said & Hok (2001) [44] regarding the theobromine content in co-
coa beans. However, the caffeine concentration for the same product was much
lower in Malaysian chocolate than in the present study. De Oliveira & Genovese
(2013) [23] reported a caffeine content of 0.27% ± 0.01% for cocoa liquor. For
the chocolates prepared with cocoa butter, the values mentioned by Ramli et al.
(2001) [44] were much lower than those found in the present study. If, as re-
ported by Efraim et al. (2011) [3], the levels of polyphenols in cocoa may vary
according to their origin, the same may occur for the methylxanthines: theo-
bromine and caffeine.
The antioxidant activity of chocolate samples was evaluated in the DPPH free
radical discoloration method. Table 3 shows the results for all evaluated choco-
lates; ED50 values ranged from 4.54 to 285.83 μg/mL. Vertuani et al. (2014) [45]
reported values of ED50 between 140 to 470 μg/mL for cocoa. It was observed
that the SCC and AC80 presented the highest antioxidant activity among the
chocolate samples tested, being significantly superior to the other chocolates,
with the exception of the MAH, which presented similar values. CS70 also had
high antioxidant activity, higher than the other chocolate samples, but lower
than SCC and AC80. Bitter chocolate samples (MAH, CS70 and AD70) showed
DOI: 10.4236/oalib.1107377 11 Open Access Library JournalM. C. Marcucci et al.
Table 3. Antioxidant activity of chocolate samples (ED50 µg/mL).
Chocolate sample ED 50 (µg/mL)* CV% Inc.
AD70 114.04 ± 0.87
e
0.76 0.50
AC80 5.03ª ± 0.15 3.03 0.09
BC 285.83i ± 0.15 0.05 0.09
BD 264.32 ± 0.20
h
0.08 0.12
BLC 57.45 ± 0.38
d
0.67 0.22
CS20 20.50c ± 0.50 2.44 0.29
CS70 7.13b ± 0.15 2.07 0.09
LH 120.54 ± 1.66
g
1.38 0.96
LHE 117.94 ± 0.08
f
0.07 0.04
MAH 5.55ab ± 0.05 0.90 0.03
SCC 4.54a ± 0.04 0.88 0.02
*Average of three measurements. CV% is the percentile variation coefficient and Inc. the uncertainty of the
measurements, calculated by the standard deviation/square root of the number of measurements. The same
letters in each column indicate that there is no statistical difference at a significance level of 5%, according
to the Tukey Test results.
significantly higher antioxidant activity than milk chocolates (LH, LHE, BLC
and CS20). The white chocolate samples (BC and BD) had very low antioxidant
activity, significantly lower than the other samples.
The data in Table 3 confirms that the antioxidant activity is related to the
phenolic content, as reported at the beginning of the present study. The bean
powder and the chocolate samples with higher cocoa content are those that pre-
sented higher total phenolic content, consequently better antioxidant activity.
Through the statistical analysis performed, the following correlations (R) were
observed: very high between caffeine x theobromine (0.9274), moderated be-
tween ED50 x theobromine (0.6441) and a weak ED50 x caffeine (0.4854).
After collecting all the physical-chemical data and the antioxidant activity,
they were submitted to a multivariate statistical analysis (Principal Component
Analysis or PCA). According to this, factor 1 explained 99% of the variance and
factor 2 plus 1% of the variance, in a total of 100%, which explains the distribu-
tion in two PCs (1 and 2). These results can be seen in Figure 3.
The samples were separated into three different groups. In Group 1, the white
chocolate samples (BD and BC), which do not present antioxidant activity, total
phenolic content is very low and lack theobromine and caffeine (they are in the
negative quadrant of Figure 3(b)). Group 2 is the intermediate, with samples
AD70, LH and LHE, with intermediate amounts of theobromine and caffeine
and phenolic content and moderate antioxidant activity. In Group 3 are AC80,
CS20, CS70, BLC and MAH, with better antioxidant activity, higher total phe-
nolic and methylxanthine content. Group 3 stands out from all others for having
the highest content of methylxanthines (caffeine and theobromine), conse-
quently presenting the best antioxidant activity. The bean powder was separated
DOI: 10.4236/oalib.1107377 12 Open Access Library JournalM. C. Marcucci et al.
Figure 3. Principal component analysis of the (PCA) of the chocolate samples. PC1 xPC2
scores (samples) (a) and the loadings (variables) (b). For abbreviations see Materials and
Methods.
from the rest because they had a high fat content. The AC80 and MAH chocolate
samples have the highest content of ether insoluble solids (Figure 3(a)).
4. Conclusion
The highest fat contents were found in the milk chocolate samples followed by
the white chocolate samples. Bitter chocolate has a higher percentage of cocoa in
its composition than other types of chocolates and therefore presented higher
total phenolic contents than other types (such as white chocolate that has a very
low or almost no polyphenols because there is no cocoa paste). To date, cocoa
has been studied as a source of polyphenols, with its main components ex-
tracted, isolated and identified in bench processes, using organic solvents not al-
lowed for use in food, such as methanol, for example. These solid-liquid extrac-
tions leave a residual content in the product, rendering it unsuitable for human
consumption. Extractions using permitted organic solvents often promote de-
gradation of the polyphenols during the process due to the temperature and
oxygen exposure conditions to which the product is subjected. Polyphenols are
DOI: 10.4236/oalib.1107377 13 Open Access Library JournalM. C. Marcucci et al.
compounds that degrade easily in the presence of heat and oxygen. A method of
extraction of the alkaloids using barium oxide was used, successfully separating
of the methylxanthines, as confirmed by mass spectrometry. The literature de-
scribes the use of magnesium oxide for the same analyses. It was possible to eva-
luate and to prove that the antioxidant activity was closely linked to the phenolic
content. Theobromine and caffeine content were also high in these samples,
possibly due to the higher percentage pf cacao paste used, confirmed by the mul-
tivariate statistical analysis. This work came to contribute to the confirmation of
the properties of chocolates for human health, and these can be considered func-
tional foods, such as CEPLAC chocolate with high phenol content, theobromine
and caffeine, as well as a good antioxidant activity.
Acknowledgements
CEPLAC (Comissão Executiva de Planejamento da Lavoura Cacaueira) Ilheus,
Bahia, Brazil, which provided the samples of cocoa and chocolate seeds to carry
out this work.
Conflicts of Interest
The authors declare no conflicts of interest regarding the publication of this pa-
per.
References
[1] Leite, P.B. (2012) Caracterização de chocolates provenientes de variedades de cacau
Theobroma cacao L resistentes a vassoura de bruxa. Dissertação apresentada no
Programa de Pós-graduação em Ciência de Alimentos da Faculdade de Farmácia.
Universidade Federal da Bahia, Bahia, 170.
[2] Godočiková, L., Ivanišová, E. and Kačániová, M. (2019) The Impact of Addition of
Different Tea Powders on the Biological Value of White Chocolates. Journal of Mi-
crobiology, Biotechnology and Food Science, 9, 396-399.
https://doi.org/10.15414/jmbfs.2019.9.special.396-399
[3] Efraim, C., Alves, A.B. and Jardim, D.C.P. (2011) Polifenóis em cacau e derivados:
Teores, fatores de variação e efeitos na saúde. Journal of Food Technology, 14,
181-201. https://doi.org/10.4260/BJFT2011140300023
[4] Vicentim, A.L. and Marcellino, M.C.L. (2012) Efeito do pó do cacau (Theobroma
cacao) e seus princípios ativos na pressão arterial de portadores de diabetes mellitus
tipo II. Salusvita, 31, 29-40.
[5] Kerimi, A. and Williamson, G. (2015) The Cardiovascular Benefits of Dark Choco-
late. Vascular Pharmacology, 71, 11-15. https://doi.org/10.1016/j.vph.2015.05.011
[6] Magrone, T., Russo, M.A. and Jirillo, E. (2017) Cocoa and Dark Chocolate Poly-
phenols: From Biology to Clinical Applications. Frontiers in Immunology, 8, 677.
https://doi.org/10.3389/fimmu.2017.00677
[7] Anwar, N.Z.R., Jamaluddin, A., Shahidan, N. and Zakaria, Z. (2018) Nutritional
Composition and Glycaemic Index of Milk Chocolate Using Different Sweeteners.
Journal of Agrobiotechnology, 9, 62-68.
[8] Kardum, N. and Glibetic, M. (2018) Polyphenols and Their Interactions with 629
DOI: 10.4236/oalib.1107377 14 Open Access Library JournalM. C. Marcucci et al.
Other Dietary Compounds: Implications for Human Health. Advances in Food and
Nutrition Research, 84, 103-144. https://doi.org/10.1016/bs.afnr.2017.12.001
[9] Stanley, T.H., Van Buiten, C.B., Baker, S.A., Elias, R.J., Anantheswaran, R.C. and
Lambert, J.D. (2018) Impact of Roasting on the Flavan-3-ol Composition, Sen-
sory-Related Chemistry, and in Vitro Pancreatic Lipase Inhibitory Activity of Cocoa
Beans. Food Chemistry, 255, 414-420.
https://doi.org/10.1016/j.foodchem.2018.02.036
[10] Coutinho, N.M., Silveira, M.R., Fernandes, L.M., Moraes, J., Pimentel, T.C., Freitas,
M.Q., et al. (2019) Processing Chocolate Milk Drink by Low-Pressure Cold Plasma
Technology. Food Chemistry, 278, 276-283.
https://doi.org/10.1016/j.foodchem.2018.11.061
[11] Godočiková, L., Ivanišová, E., Zaguła, G., Noguera-Artiaga, L., Carbonell-Barra-
china, Á.A., Kowalczewski, P.Ł. and Kačániová, M. (2020) Antioxidant Activities
and Volatile Flavor Components of Selected Single-Origin and Blend Chocolates.
Molecules, 25, 3648-3661. https://doi.org/10.3390/molecules25163648
[12] Counet, C., Callemien, D. and Collin, S. (2006) Chocolate and Cocoa: New Sources
of Trans-Resveratrol and Trans-Piceid. Food Chemistry, 98, 649-657.
https://doi.org/10.1016/j.foodchem.2005.06.030
[13] Alvarez-Barreto, J.F., Quintero, D., Rodríguez, M., Rea, R. and Sosa, D. (2018)
Evaluation of Phenolic Compounds, Lignin, Amino Acids and Carbohydrates in Theo-
broma cacao L. from Three Different Climate Regions in Venezuela. Emirates Journal
of Food and Agriculture, 30, 522-530.
[14] Muhammad, D.R.A., Saputro, A.D., Rottiers, H., Van de Walle, D. and Dewettinck,
K. (2018) Physicochemical Properties and Antioxidant Activities of Chocolates Enriched
with Engineered Cinnamon Nanoparticles. European Food Research and Technol-
ogy, 244, 1185-1202. https://doi.org/10.1007/s00217-018-3035-2
[15] Lee, K.W., Kim, Y.K., Lee, H.J. and Lee, C.Y. (2003) Cocoa Has More Phenolic
Phytochemicals and a Higher Antioxidant Capacity than Teas and Red Wine. Jour-
nal Food Chemistry, 51, 7292-7295. https://doi.org/10.1021/jf0344385
[16] Hu, Y., Pan, Z.J., Liao, W., Li, J., Gruget, P., Kitts, D.D., et al. (2016) Determination
of Antioxidant Capacity and Phenolic Content of Chocolate by Attenuated Total
Reflectance-Fourier Transformed-Infrared Spectroscopy. Food Chemistry, 202,
254-261. https://doi.org/10.1016/j.foodchem.2016.01.130
[17] Mudenuti, N.V.R., De Camargo, A.C., Shahidi, F., Madeira, T.B., Hirooka, E.Y. and
Grossmann, M.V.E. (2018) Soluble and Insoluble-Bound Fractions of Phenolics and
Alkaloids and Their Antioxidant Activities in Raw and Traditional Chocolate: A
Comparative Study. Journal of Functional Foods, 50, 164-171.
https://doi.org/10.1016/j.jff.2018.10.003
[18] Tafurt, G., Suarez, O., Lares, M.C., Álvarez, C. and Liconte, N. (2021) Antioxidant
Capacity of a Dark Chocolate from Organic and Unfermented Cocoa Beans. Revista
Digital de Postgrado, 10, 1-8. https://doi.org/10.37910/RDP.2021.10.1.e280
[19] Torres-Moreno, M., Tarrega, A., Costell, E. and Blanch, C. (2012) Dark Chocolate
Acceptability: Influence of Cocoa Origin and Processing Conditions. Journal of Science
Food and Agriculture, 92, 404-411. https://doi.org/10.1002/jsfa.4592
[20] Gu, L., Kelm, M.A. and Hammerstone, J.F. (2004) Concentrations of Proanthocya-
nidins in Common Foods and Estimations of Normal Consumption. Journal of Nu-
trition, 134, 613-617. https://doi.org/10.1093/jn/134.3.613
[21] Gu, L., House, S.E., Wu, S., Ou, B. and Prior, R.L. (2006) Procyanidin and Catechin
Contents and Antioxidant Capacity of Cocoa and Chocolate Products. Journal of
DOI: 10.4236/oalib.1107377 15 Open Access Library JournalM. C. Marcucci et al.
Agricultural and Food Chemistry, 53, 4057-4061. https://doi.org/10.1021/jf060360r
[22] Vinson, J., Proch, J., Bose, P., Muchler, S., Tafera, P., Shuta, D., et al. (2006) Choco-
late Is a Powerful ex Vivo and in Vivo Antioxidant, an Antiatherosclerotic Agent in
an Animal Model and a Significant Contributor to Antioxidants in the European
and American Diets. Journal of Agricultural Food Chemistry, 54, 8071-8076.
https://doi.org/10.1021/jf062175j
[23] De Oliveira, T.B. and Genovese, M.I. (2013) Chemical Composition of Cupuaçu
(Theobroma grandiflorum) and Cocoa (Theobroma cacao) Liquors and Their Ef-
fects on Streptozotocin-Induced Diabetic Rats. Food Research International, 51,
929-935. https://doi.org/10.1016/j.foodres.2013.02.019
[24] Cambrai, A., Marchioni, E., Julien-David, D. and Marcic, C. (2017) Discrimination
of Cocoa Bean Origin by Chocolate Polyphenol Chromatographic Analysis and
Chemometrics. Food Analytical Methods, 10, 1991-2000.
https://doi.org/10.1007/s12161-016-0744-7
[25] Martini, S., Conte, A. and Tagliazucchi, D. (2018) Comprehensive Evaluation of
Phenolic Profile in Dark Chocolate and Dark Chocolate Enriched with Sakura Green
Tea Leaves or Turmeric Powder. Food Research International, 112, 1-16.
https://doi.org/10.1016/j.foodres.2018.06.020
[26] Fayeulle, N., Meudec, E., Boulet, J.C., Vallverdu-Queralt, A., Hue, C., Boulanger, R.,
Cheynier, V. and Sommerer, N. (2019) Fast Discrimination of Chocolate Quality
Based on Average-Mass Spectra Fingerprints of Cocoa Polyphenols. Journal of Agri-
cultural and Food Chemistry, 67, 2723-2731.
https://doi.org/10.1021/acs.jafc.8b06456
[27] Gopalakrishnan, B., Sahib, K.A., Selvam, R. and Lakshmanan, G. (2021) Antioxi-
dant Activity in Toffees and Selected Medicinal Plants. Annals of the Romanian So-
ciety for Cell Biology, 25, 1294-1300.
[28] Torres-Moreno, M., Torres-Casana, E., Salas-Salvadó, J. and Blanch, C. (2015) Nu-
tritional Composition and Fatty Acids Profile in Cocoa Beans and Chocolates with
Different Geographical Origin and Processing Conditions, Food Chemistry, 166,
125-132. https://doi.org/10.1016/j.foodchem.2014.05.141
[29] Oliveira, L.B., De Melo, J.C., Da Boa Morte, E.C., De Jesus, R.M., Teixeira, L.S.G.
and Korn, M.G.A. (2021) Multi-Element Determination in Chocolate Bars by Mi-
crowave-Induced Plasma Optical Emission Spectrometry. Food Chemistry, 351, Ar-
ticle ID: 129285. https://doi.org/10.1016/j.foodchem.2021.129285
[30] DEl Rei, J. and Medeiros, F. (2011) Chocolate e os benefícios cardiovasculares. Re-
vista do Hospital Universitário Pedro Ernesto, UERJ, 10, 54-59.
[31] Grassia, M., Salvatori, G., Roberti, M., Planeta, D. and Cinquanta, L. (2019) Poly-
phenols, Methylxanthines, Fatty Acids and Minerals in Cocoa Beans and Cocoa
Products. Journal of Food Measurement and Characterization, 13, 1721-1728.
https://doi.org/10.1007/s11694-019-00089-5
[32] Ceplac (Comissão Executiva da Lavoura Cacaueira).
https://www.gov.br/agricultura/pt-br/assuntos/ceplac
[33] Lima, D.G., Padovani, R.M., Rodriguez-Amaya, D.B., Farfán, J.A., Nonato, C.T., De
Lima, M.T., et al. (2011) Tabela Brasileira de Composição de Alimentos-TACO 4ª
Edição Revisada e Ampliada. Núcleo de Estudos e Pesquisas em Alimentação-NEPA
Universidade Estadual de Campinas-UNICAMP.
http://www.cfn.org.br/wp-content/uploads/2017/03/taco_4_edicao_ampliada_e_rev
isada.pdf
[34] Seem, S.A., Yuan, Y.V. and Tou, J.C. (2019) Chocolate and Chocolate Constituents
DOI: 10.4236/oalib.1107377 16 Open Access Library JournalM. C. Marcucci et al.
Influence Bone Health and Osteoporosis Risk. Nutrition, 65, 74-84.
https://doi.org/10.1016/j.nut.2019.02.011
[35] European Union (2000) Directive 2000/36/EC of the European Parliament and of
the Council of 23 June 2000 Relating to Cocoa and Chocolate Products Intended for
Human Consumption.
https://eur-lex.europa.eu/legal-content/EN/ALL/?uri=CELEX%3A32000L0036
[36] Rodriguez-Negrette, A.C., Huck-Iriart, C. and Herrera, M.I. (2019) Physical Chem-
ical Properties of Shea/Cocoa Butter Blends and Their Potential for Chocolate Manu-
facture. Journal of American Oil Chemical Society, 96, 239-248.
https://doi.org/10.1002/aocs.12189
[37] Matsume, M., Osakabe, N., Yamagishi, M., Takizawa, T., Nakamura, T., Miyatake,
H., et al. (2000) Analysis of Polyphenols in Cacao Liquor, Cocoa and Chocolate by
Normal-Phase and Reversed-Phase HPLC. Bioscience, Biotechnology and Bioche-
mistry, 64, 2581-2587. https://doi.org/10.1271/bbb.64.2581
[38] De Maria, C.A.B. and Moreira, R.F.A. (2007) Cafeína: Revisão sobre métodos de
análise. Química Nova, 30, 99-105.
https://doi.org/10.1590/S0100-40422007000100021
[39] Ribeiro, F.A.L., Ferreira, M.M.C., Morano, S.C., Da Silva, L.R. and Schneider, R.P.
(2008) Planilha de validação: Uma nova ferramenta para estimar figuras de mérito
na validação de métodos analíticos univariados. Química Nova, 31, 200-228.
https://doi.org/10.1590/S0100-40422008000100029
[40] Veiga, R.S., Mendonça, S., Mendes, P.B., Paulino, N., Mimica, M.J., Lagareiro Netto,
A.A., et al. (2017) Artepillin C and Phenolic Compounds Responsible for Antimi-
crobial and Antioxidant Activity of Green Propolis and Baccharis dracunculifolia
DC. Journal of Applied Microbiology, 122, 911-920.
https://doi.org/10.1111/jam.13400
[41] Hammer, Ø., Harper, D.A.T. and Ryan, P.D. (2001) Past: Paleontological Statistics
software Package for Education and Data Analysis. Palaeontologia Electronica, 4, 9
p. http://palaeo-electronica.org/2001_1/past/issue1_01.htm
[42] De Melo, C.W.B., Bandeira, M.J., Maciel, L.F., Bispo, E.S., De Souza, E.O. and
Soares, S.E. (2020) Chemical Composition and Fatty Acids Profile of Chocolates Pro-
duced with Different Cocoa (Theobroma cacao L.) Cultivars. Food Science and Tech-
nology, 40, 326-333. https://doi.org/10.1590/fst.43018
[43] Alves, A.B. and Bragagnolo, N. (2002) Determinação simultânea de teobromina e
cafeína em chás por cromatografia líquida de alta eficiência. Revista Brasileira de
Ciências Farmacêuticas, 38, 237-243.
https://doi.org/10.1590/S1516-93322002000200013
[44] Ramli, N., Yatim, A.M., Said, M. and Hok, H.C. (2001) HPLC Determination of
Methylxanthines and Polyphenols Levels in Cocoa and Chocolate Products. Malay-
sian Journal of Analytical Sciences, 7, 377-386.
[45] Vertuani, S., Scalambra, E., Trotta, V., Bino, A., Malisardi, G., Baldisserotto, A. and
Manfredini, S. (2014) Evaluation of Antiradical Activity of Different Cocoa and Choc-
olate Products: Relation with Lipid and Protein Composition. Journal of Medicinal
Food, 17, 1-5. https://doi.org/10.1089/jmf.2013.0110
[46] Waterhouse, A.L., Sirley, J.R. and Donovan, J.L. (1996) Antioxidants in Chocolate.
The Lancet, 348, 834. https://doi.org/10.1016/S0140-6736(05)65262-2
[47] Serra-Bonvehí, J. and Ventura Coll, F. (1997) Evaluation of Bitterness and Astrin-
gency of Polyphenolic Compounds in Cocoa Powder. Food Chemistry, 60, 365-370.
https://doi.org/10.1016/S0308-8146(96)00353-6
DOI: 10.4236/oalib.1107377 17 Open Access Library JournalM. C. Marcucci et al.
[48] Kealey, K.S., Snyder, R.M., Romaczyk, L.J., Geyer, H.M., Hammerstone, J.F., Buck,
M.M., et al. (2000) Method for Producing Fat and/or Solids from Cocoa Beans.
http://www.google.com/patents/US6015913
[49] Natsume, M., Osakabe, N., Yamagishi, M., Takizawa, T., Nakamura, T., Miyatake,
H., et al. (2000) Analyses of Polyphenols in Cacao Liquor, Cocoa and Chocolate by
Normal-Phase and Reverse-Phase HPLC. Bioscience Biotechnology and Biochemi-
stry, 64, 2581-2657. https://doi.org/10.1271/bbb.64.2581
[50] Adamson, G.E., Lazarus, S.A., Mitchell, A.E., Prior, R.L., Cao, G., Jacobs, P.H., et al.
(1999) HPLC Method for the Quantification of Procyanidins in Cocoa and Choco-
late Samples and Correlation to Total Antioxidant Capacity. Journal of Agricultural
and Food Chemistry, 47, 4184-4188. https://doi.org/10.1021/jf990317m
[51] Luna, F., Crouzillat, D., Cirou, L. and Bucheli, P. (2002) Chemical Composition and
Flavor of Ecuadorian Cocoa Liquor. Journal of Agricultural and Food Chemistry,
50, 3527-3532. https://doi.org/10.1021/jf0116597
[52] Ramirez-Sanchez, I., Maya, L., Ceballos, G. and Villarreal, F. (2010) Fluorescent
Detection of (-)-epicatechin in Microsamples from Cacao Seeds and Cocoa Prod-
ucts: Comparison with Folin Ciocalteau Method. Journal of Food Composition and
Analysis, 23, 790-793. https://doi.org/10.1016/j.jfca.2010.03.014
DOI: 10.4236/oalib.1107377 18 Open Access Library JournalYou can also read